Microeconomics Homework: Demand, Supply, Market Structures, Costs
VerifiedAdded on 2020/02/24
|5
|1031
|69
Homework Assignment
AI Summary
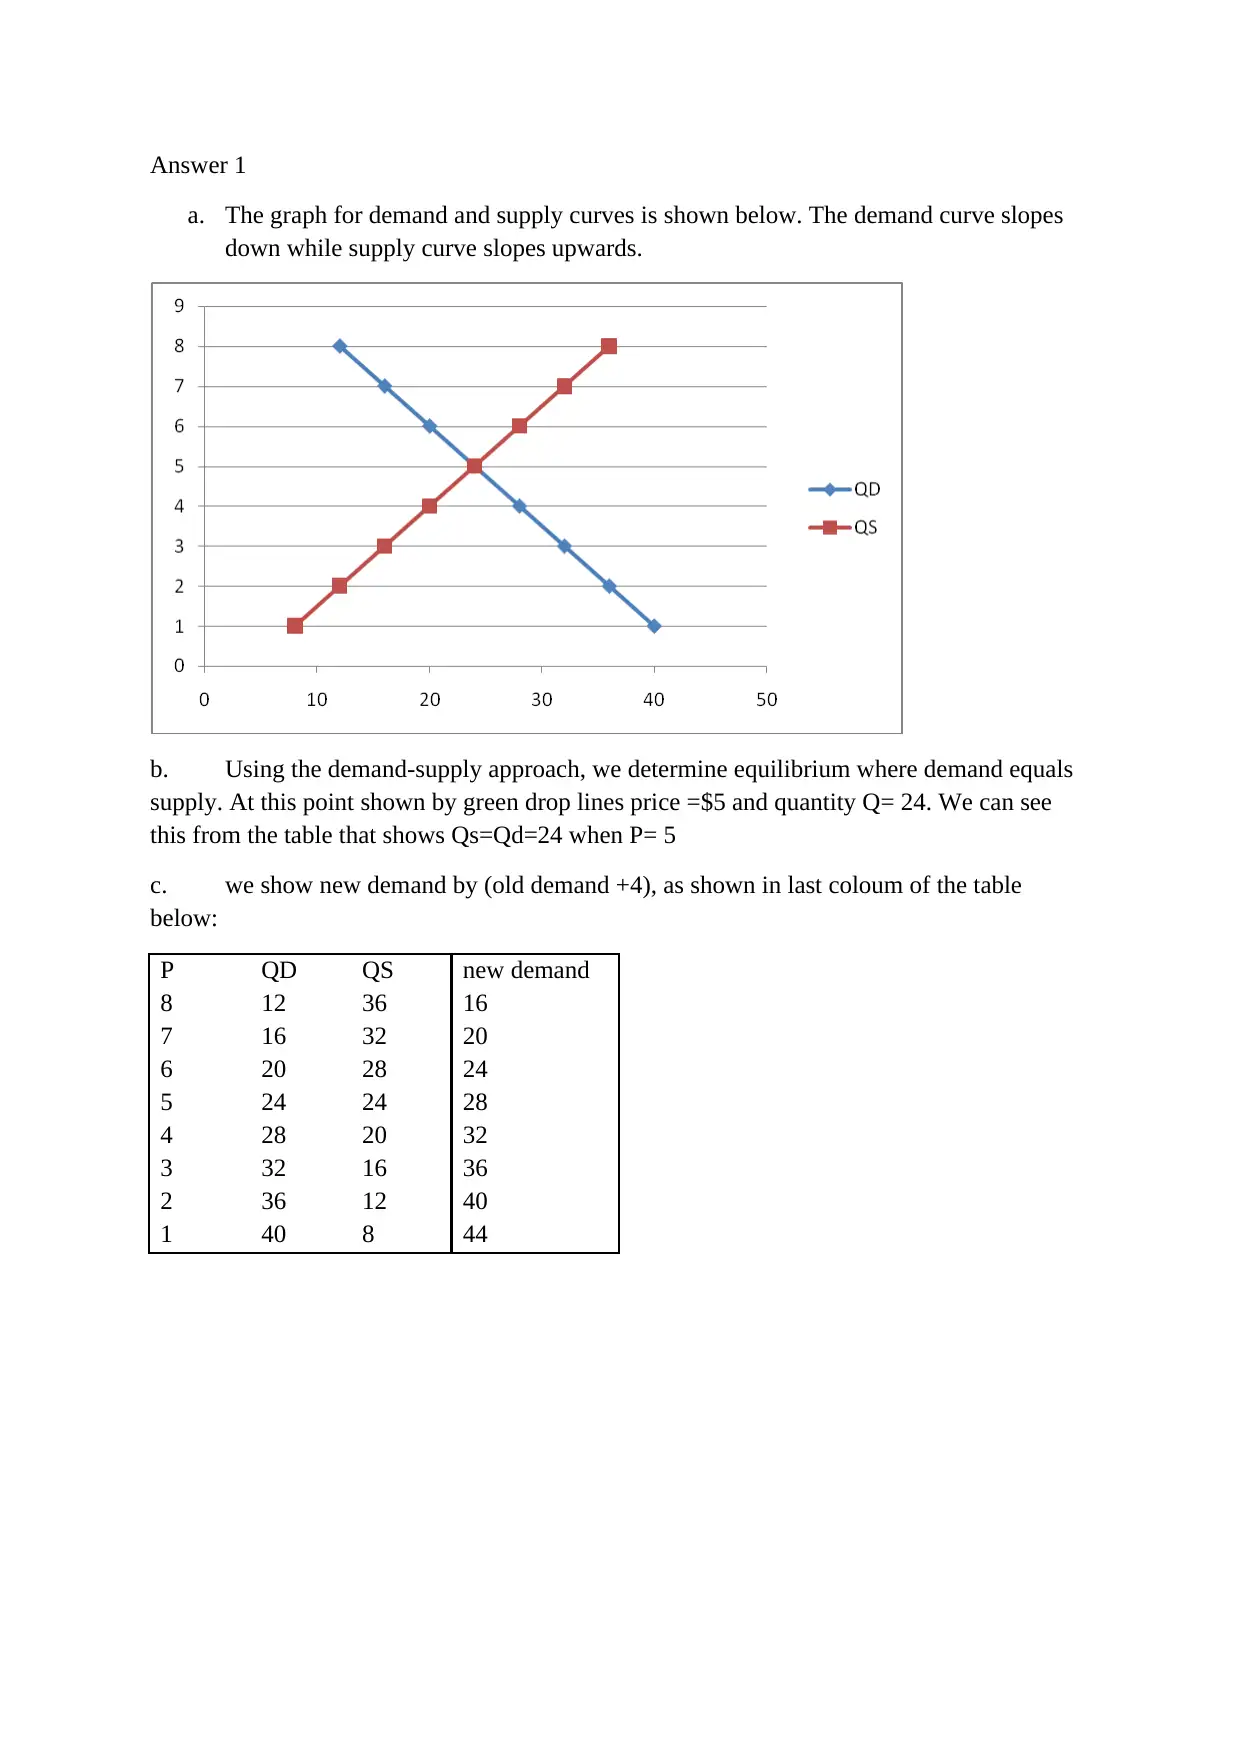
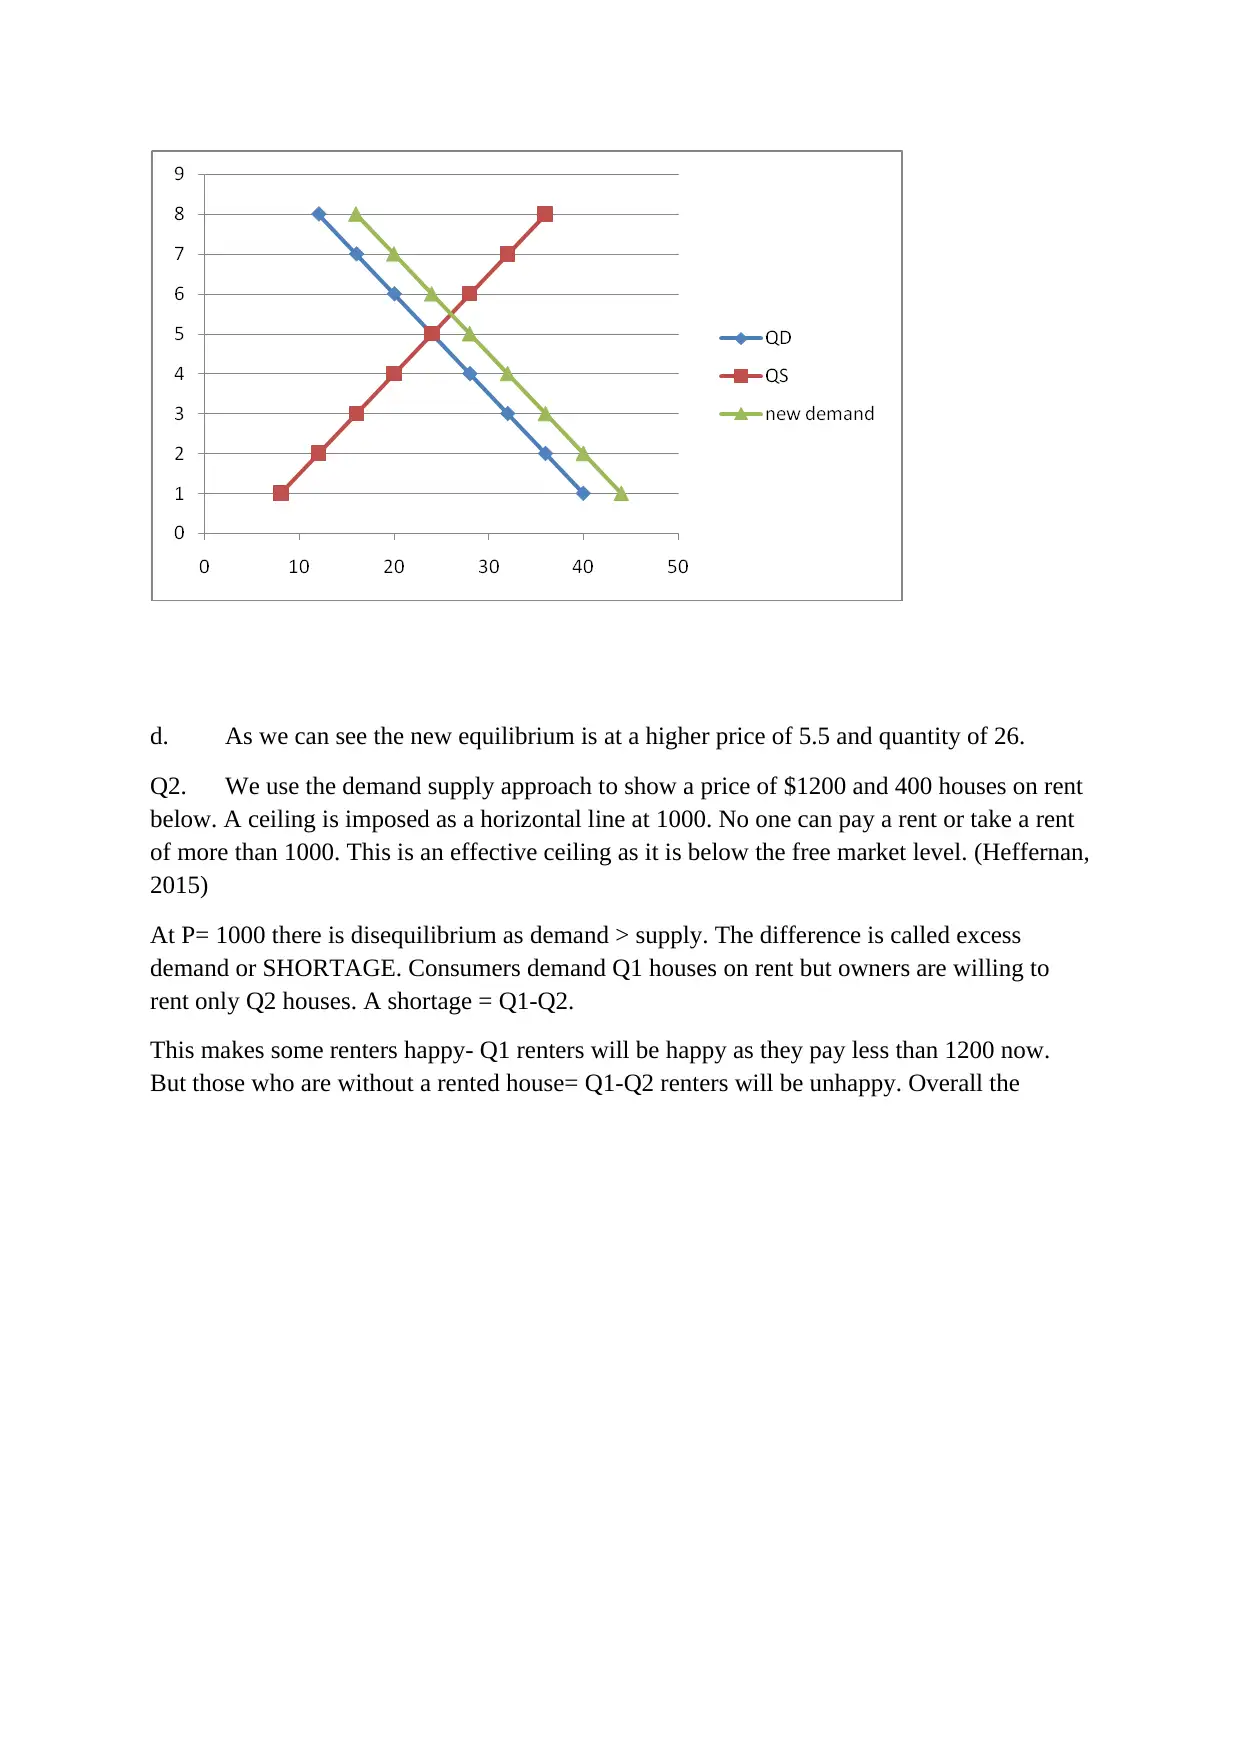
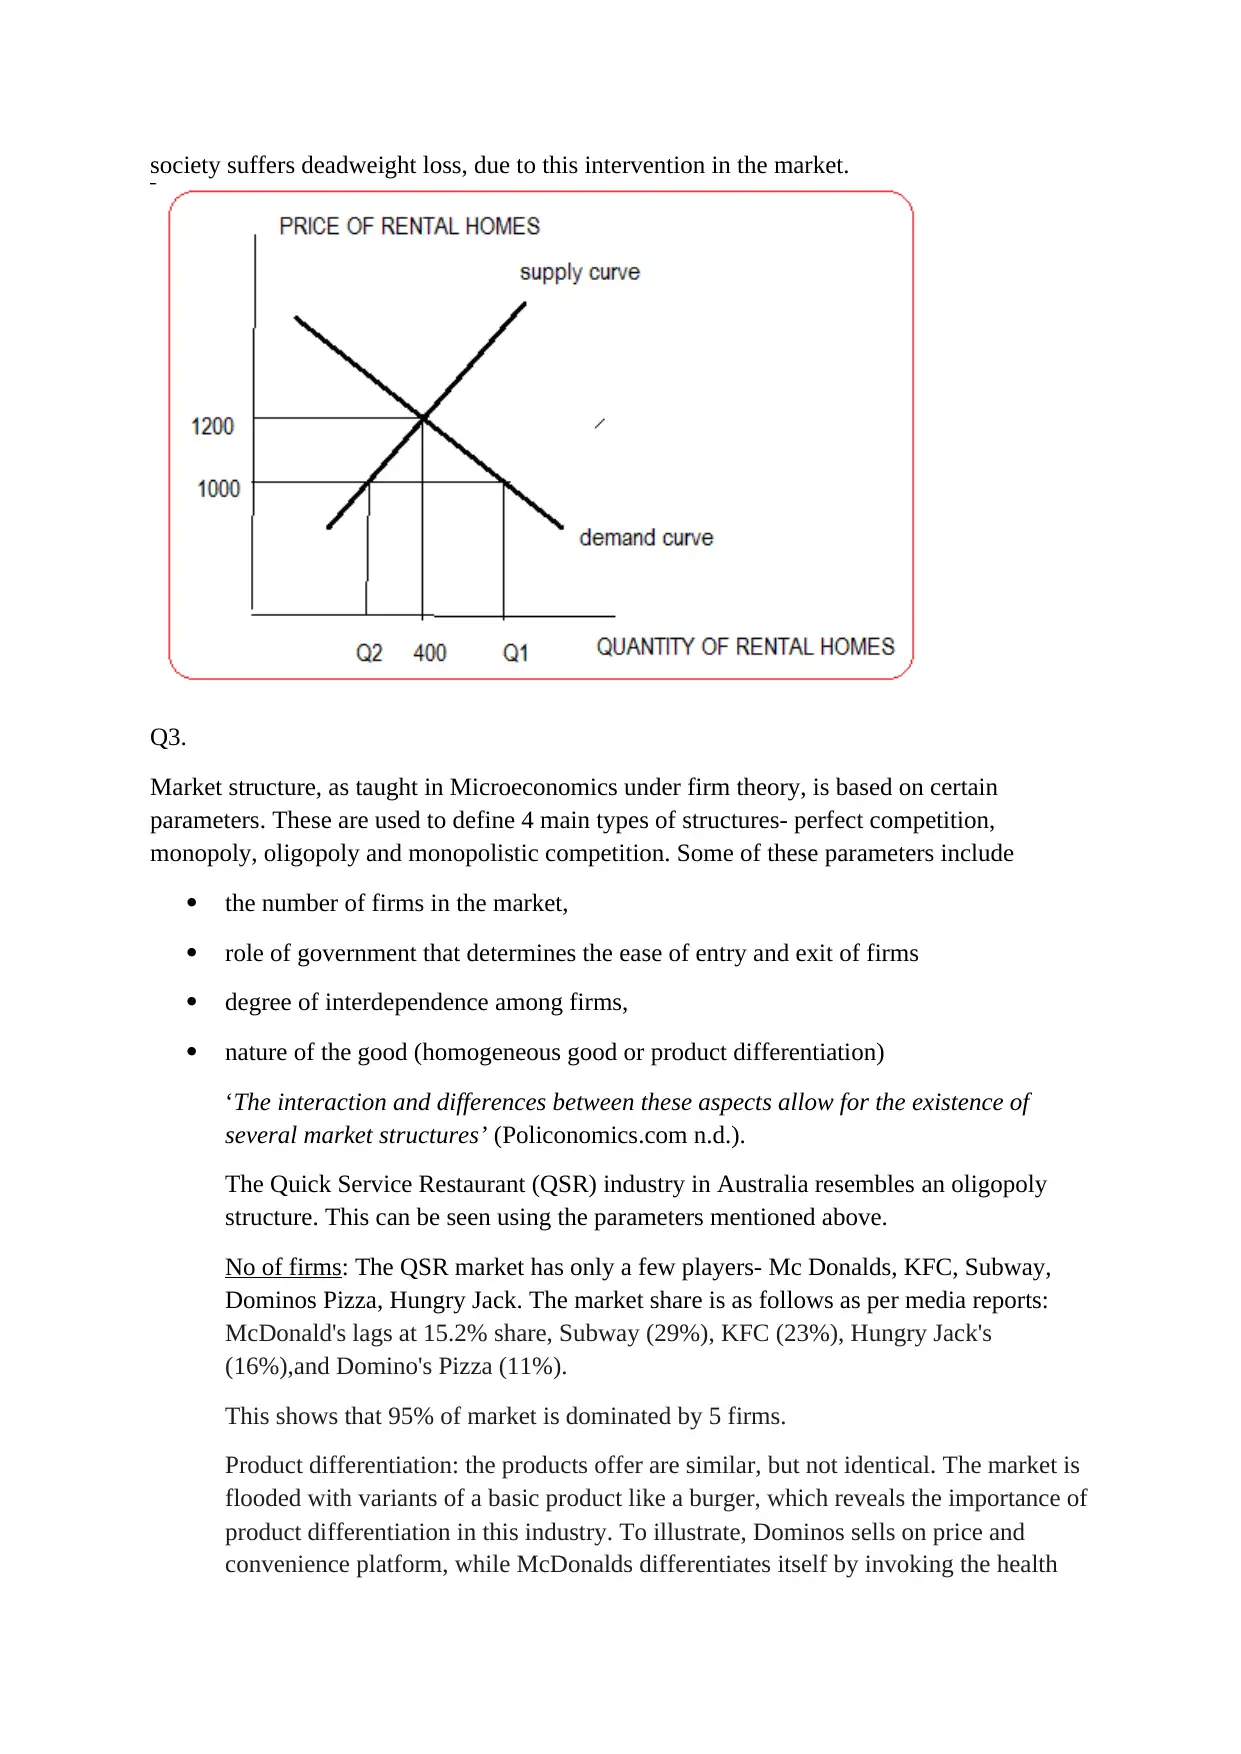
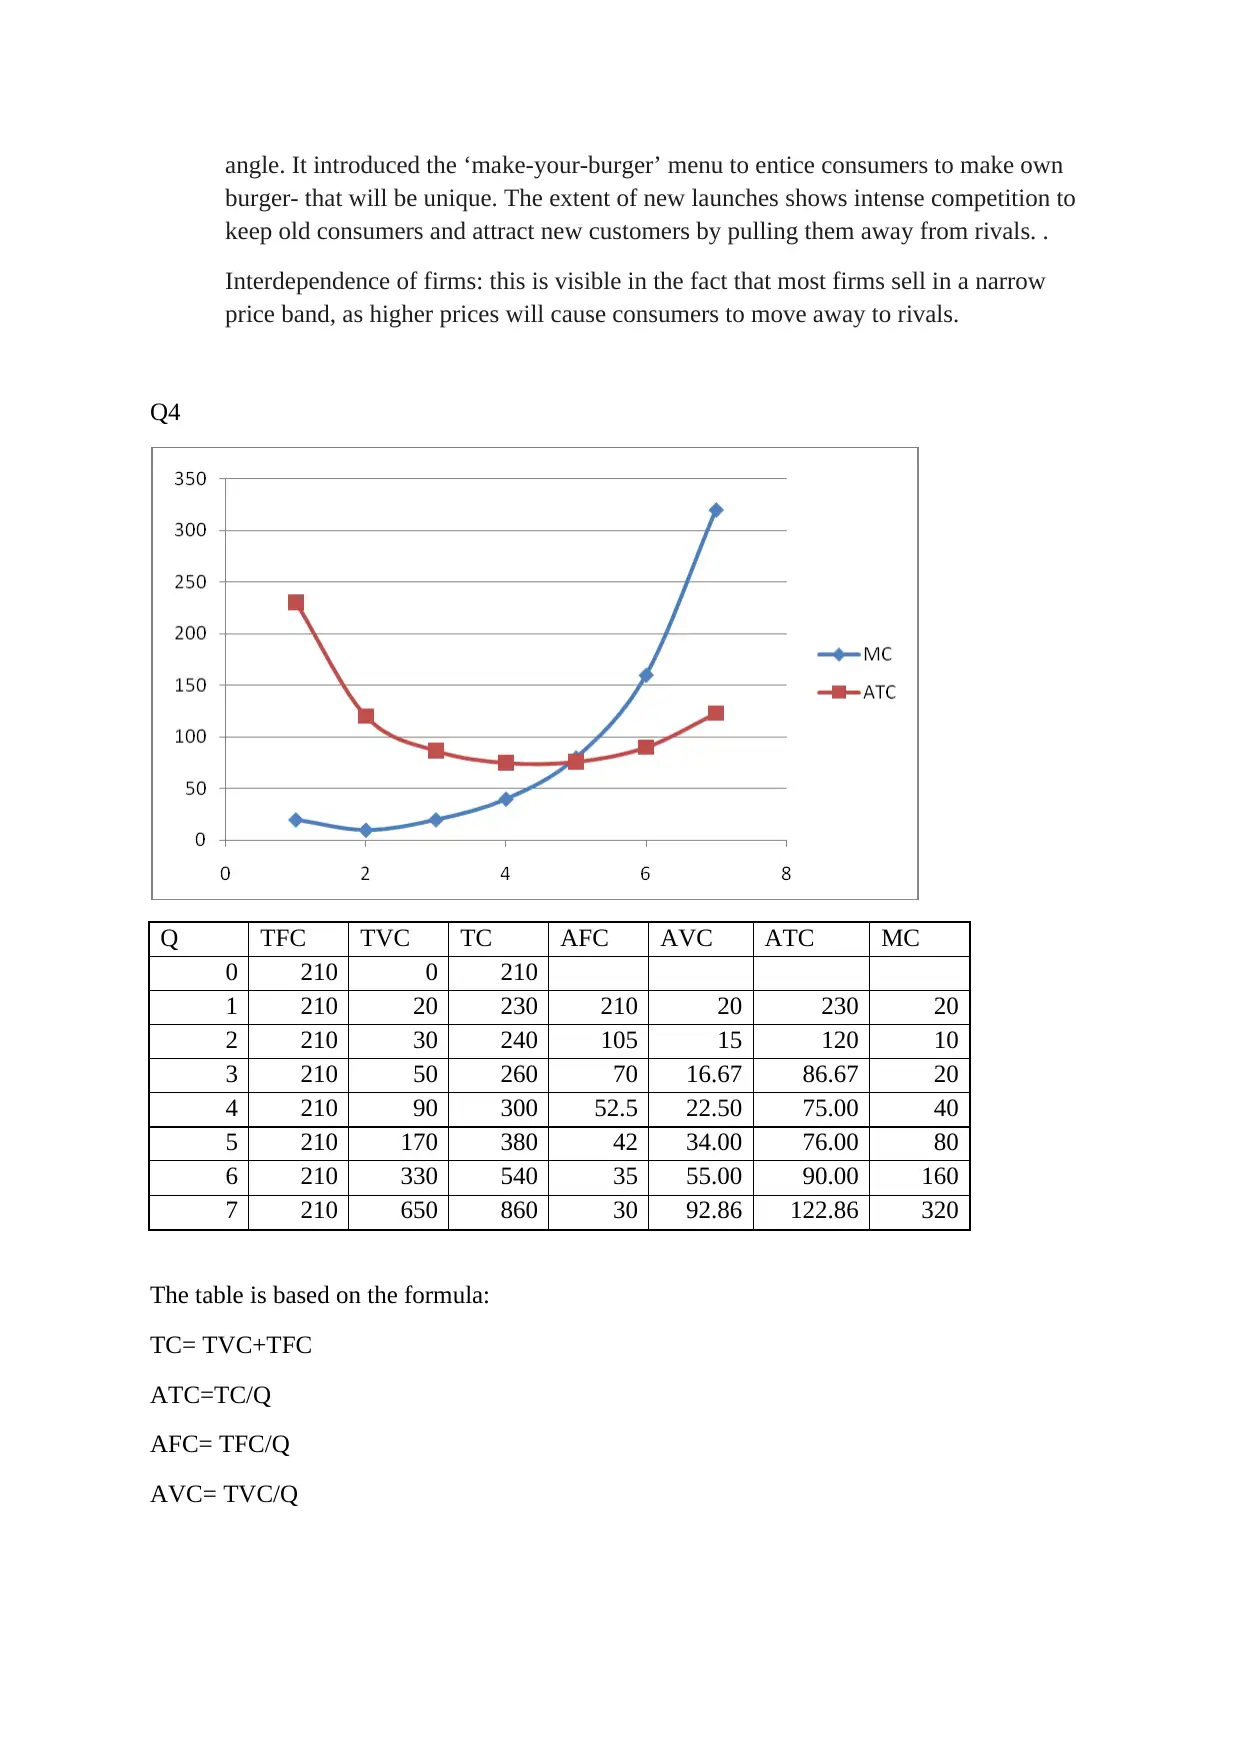
This document provides solutions to a microeconomics homework assignment. The first question analyzes demand and supply curves, determining equilibrium and the impact of shifts in demand. The second question uses the demand-supply approach to demonstrate the effects of a price ceiling on the housing market, illustrating concepts like excess demand and deadweight loss. The third question examines market structures, specifically focusing on the oligopoly structure of the Quick Service Restaurant (QSR) industry in Australia, analyzing factors such as the number of firms, product differentiation, and interdependence. Finally, the fourth question presents a cost analysis table, calculating total cost, average cost, and marginal cost based on provided data.
1 out of 5

Your All-in-One AI-Powered Toolkit for Academic Success.
+13062052269
info@desklib.com
Available 24*7 on WhatsApp / Email
![[object Object]](/_next/static/media/star-bottom.7253800d.svg)
Copyright © 2020–2026 A2Z Services. All Rights Reserved. Developed and managed by ZUCOL.