Ask a question from expert
Document Related to Statistics | Docx
9 Pages1266 Words352 Views
Added on 2020-05-16
Document Related to Statistics | Docx
Added on 2020-05-16
BookmarkShareRelated Documents
Running head: STATISTICSStatisticsName of the studentName of the universityAuthor’s note
STATISTICS1Table of ContentsAnswer 1..........................................................................................................................................2Part a............................................................................................................................................2Part b............................................................................................................................................2Part c............................................................................................................................................2Answer 2..........................................................................................................................................2Answer 3..........................................................................................................................................3Part a............................................................................................................................................3Part b............................................................................................................................................3Answer 4..........................................................................................................................................3Answer 5..........................................................................................................................................4Answer 6..........................................................................................................................................4Part a............................................................................................................................................4Part b............................................................................................................................................4Part c............................................................................................................................................4Answer 7..........................................................................................................................................4Answer 8..........................................................................................................................................6Part a............................................................................................................................................6Part b............................................................................................................................................6Part c............................................................................................................................................6Answer 9..........................................................................................................................................6Part a............................................................................................................................................6Part b............................................................................................................................................7Part c............................................................................................................................................7Answer 10........................................................................................................................................7Part a............................................................................................................................................7Part b............................................................................................................................................7Part c............................................................................................................................................8Part d............................................................................................................................................8
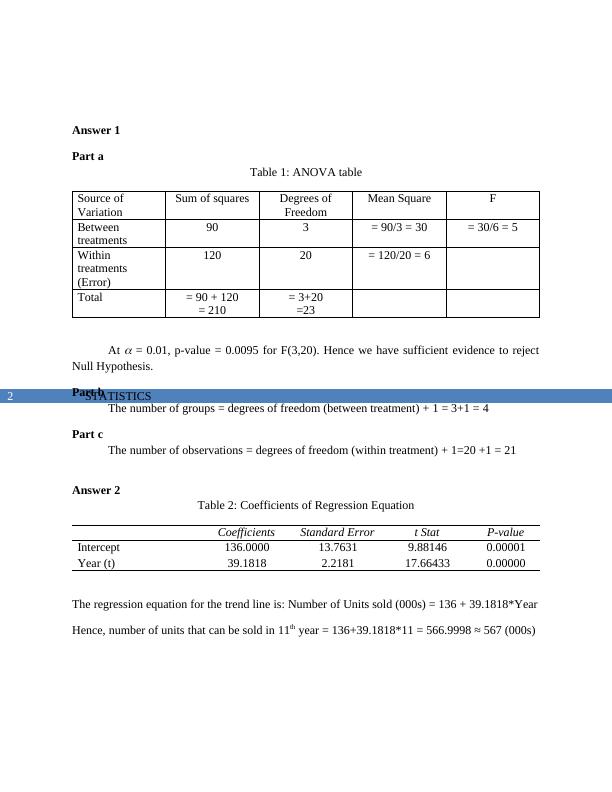
STATISTICS2Answer 1Part aTable 1: ANOVA tableSource of VariationSum of squaresDegrees ofFreedomMean SquareFBetween treatments903= 90/3 = 30= 30/6 = 5Within treatments (Error)12020= 120/20 = 6Total= 90 + 120= 210= 3+20=23At = 0.01, p-value = 0.0095 for F(3,20). Hence we have sufficient evidence to rejectNull Hypothesis. Part bThe number of groups = degrees of freedom (between treatment) + 1 = 3+1 = 4Part cThe number of observations = degrees of freedom (within treatment) + 1=20 +1 = 21Answer 2Table 2: Coefficients of Regression EquationCoefficientsStandard Errort StatP-valueIntercept136.000013.76319.881460.00001Year (t)39.18182.218117.664330.00000The regression equation for the trend line is: Number of Units sold (000s) = 136 + 39.1818*YearHence, number of units that can be sold in 11th year = 136+39.1818*11 = 566.9998 ≈ 567 (000s)
End of preview
Want to access all the pages? Upload your documents or become a member.
Related Documents
Statistics Name of the university Author's notelg...
|9
|1256
|369
Statistics Assignment - (Answers)lg...
|14
|1805
|829
HI6007 : Statistics And Research Methods For Businesslg...
|9
|1719
|50
STAT670: Introductory Statisticslg...
|9
|1680
|204
HI6007 Assignment on Statisticslg...
|8
|1746
|307
Analytical Method for Regression Analysislg...
|10
|1432
|91