Descriptive Statistics for Statistics Study Material
42 Pages5113 Words90 Views
Added on 2023-01-19
About This Document
This study material provides detailed information about descriptive statistics in the field of statistics. It covers various variables such as gender, age, living arrangements, macronutrients, weight, and more. The material includes tables, interpretations, and test statistics to help understand the significance of different variables. It also provides mean, standard deviation, minimum, and maximum values for each variable.
Descriptive Statistics for Statistics Study Material
Added on 2023-01-19
ShareRelated Documents
STATISTICS

TABLE OF CONTENTS
Table 1 Descriptive statistics...........................................................................................................1
Table 2 Normality check and t test for macronutrientS...................................................................2
Table 3 T test for weight..................................................................................................................6
APPENDIX......................................................................................................................................8
Table 1 Descriptive statistics
Descriptive Statistics
N Minimu
m
Maximu
m
Mean Std.
Deviation
1. Gender 111 1 2 1.89 .312
2. Age (years) 111 19 31 22.09 2.585
6. Living
arrangements 111 0 4 1.69 .980
17. Protein (g) 110 18.1 258.9 90.181 36.2453
18. Total Fat (g) 110 18.7 225.0 78.980 34.4656
23. Carbohydrates
(g) 110 1.0 672.5 208.901 89.2295
8. Weight (kg) 110 42.0 92.0 61.878 9.9812
9. Height (cm) 110 147.0 192.5 166.351 8.0132
16. Energy (KJ) 109 2049.0 20063.6 8333.194 2726.5415
10. BMI (Kg/m2) 110 16.0 35.3 22.264 2.9350
12. Waist Circ (cm) 109 27.0 100.5 73.389 9.5036
13. Hip Circ. (cm) 109 35.4 115.0 93.994 11.4179
Valid N (listwise) 107
Interpretation
1
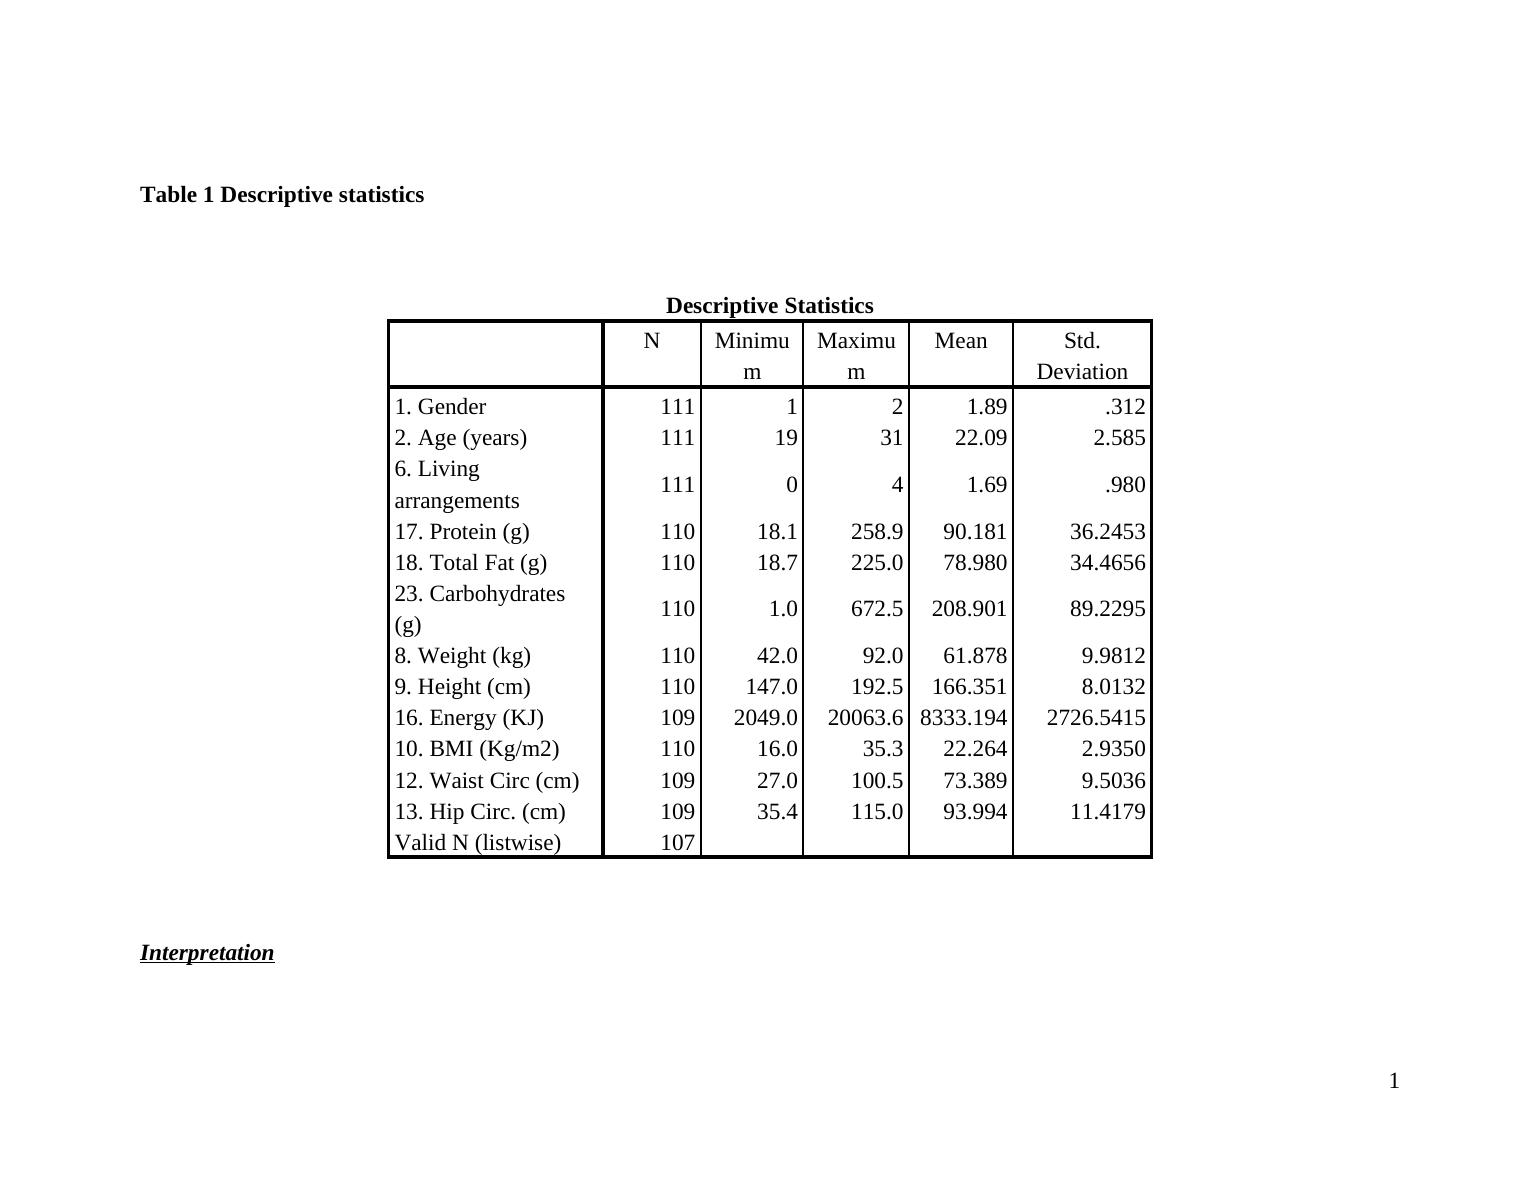
Facts indicate that most of sample units live out of home and have protein (M= 90.18, SD= 36.24), carbohydrate (M= 208, SD=
89.22), energy (M= 8333, SD= 2726) and weight (M= 61.87, SD= 9.98). In case of energy value of standard deviation is high and in
other cases low which reflect that energy, level vary across sample units.
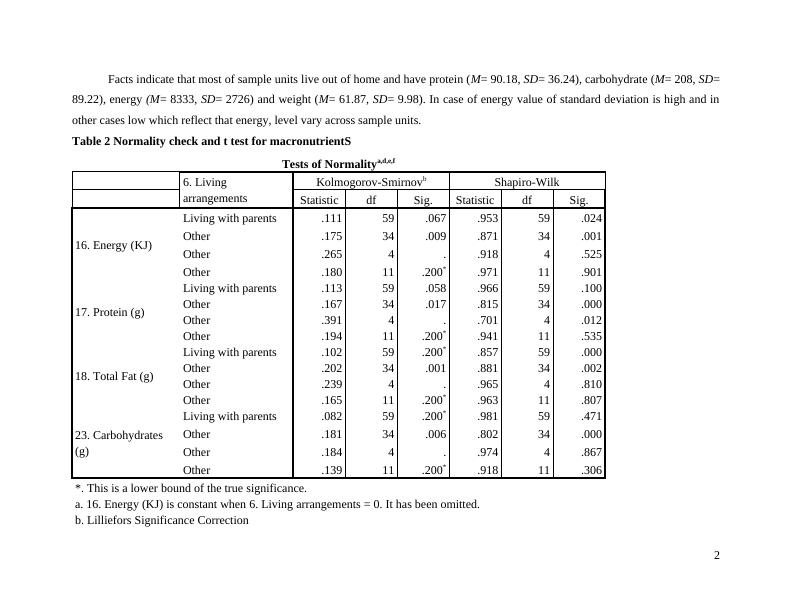
Table 2 Normality check and t test for macronutrientS
Tests of Normalitya,d,e,f
6. Living
arrangements
Kolmogorov-Smirnovb Shapiro-Wilk
Statistic df Sig. Statistic df Sig.
16. Energy (KJ)
Living with parents .111 59 .067 .953 59 .024
Other .175 34 .009 .871 34 .001
Other .265 4 . .918 4 .525
Other .180 11 .200* .971 11 .901
17. Protein (g)
Living with parents .113 59 .058 .966 59 .100
Other .167 34 .017 .815 34 .000
Other .391 4 . .701 4 .012
Other .194 11 .200* .941 11 .535
18. Total Fat (g)
Living with parents .102 59 .200* .857 59 .000
Other .202 34 .001 .881 34 .002
Other .239 4 . .965 4 .810
Other .165 11 .200* .963 11 .807
23. Carbohydrates
(g)
Living with parents .082 59 .200* .981 59 .471
Other .181 34 .006 .802 34 .000
Other .184 4 . .974 4 .867
Other .139 11 .200* .918 11 .306
*. This is a lower bound of the true significance.
a. 16. Energy (KJ) is constant when 6. Living arrangements = 0. It has been omitted.
b. Lilliefors Significance Correction
2
89.22), energy (M= 8333, SD= 2726) and weight (M= 61.87, SD= 9.98). In case of energy value of standard deviation is high and in
other cases low which reflect that energy, level vary across sample units.
Table 2 Normality check and t test for macronutrientS
Tests of Normalitya,d,e,f
6. Living
arrangements
Kolmogorov-Smirnovb Shapiro-Wilk
Statistic df Sig. Statistic df Sig.
16. Energy (KJ)
Living with parents .111 59 .067 .953 59 .024
Other .175 34 .009 .871 34 .001
Other .265 4 . .918 4 .525
Other .180 11 .200* .971 11 .901
17. Protein (g)
Living with parents .113 59 .058 .966 59 .100
Other .167 34 .017 .815 34 .000
Other .391 4 . .701 4 .012
Other .194 11 .200* .941 11 .535
18. Total Fat (g)
Living with parents .102 59 .200* .857 59 .000
Other .202 34 .001 .881 34 .002
Other .239 4 . .965 4 .810
Other .165 11 .200* .963 11 .807
23. Carbohydrates
(g)
Living with parents .082 59 .200* .981 59 .471
Other .181 34 .006 .802 34 .000
Other .184 4 . .974 4 .867
Other .139 11 .200* .918 11 .306
*. This is a lower bound of the true significance.
a. 16. Energy (KJ) is constant when 6. Living arrangements = 0. It has been omitted.
b. Lilliefors Significance Correction
2
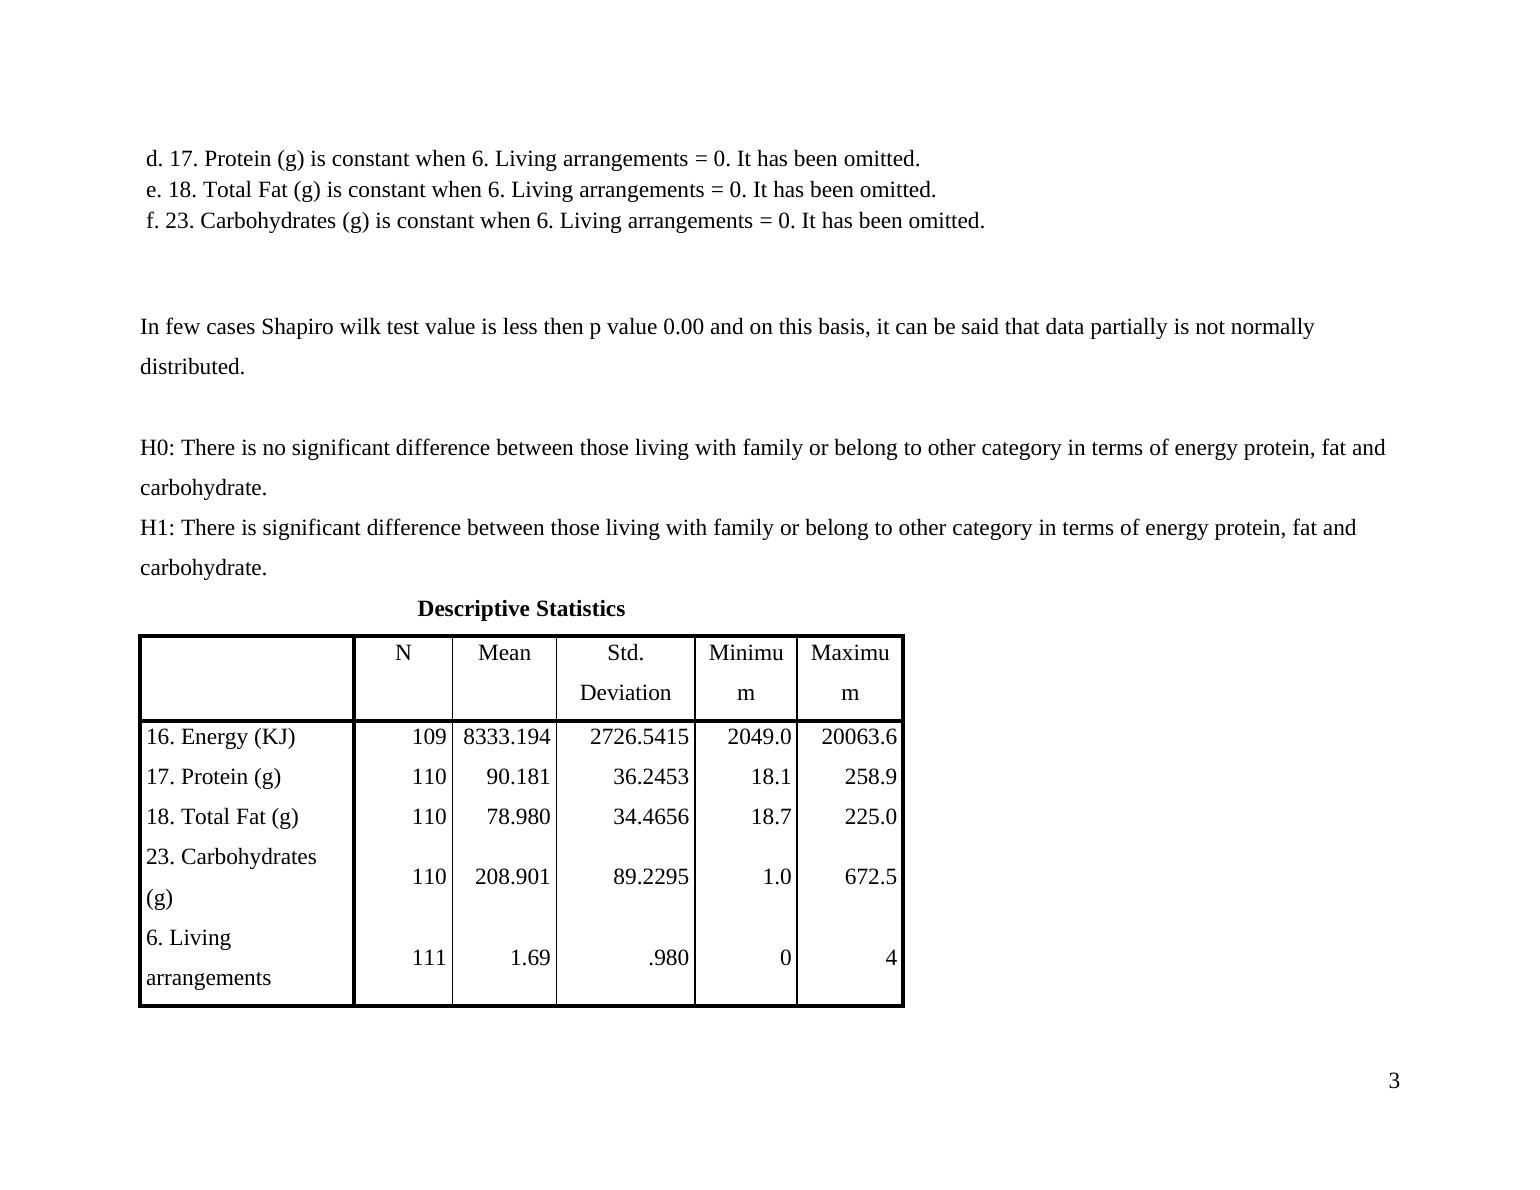
d. 17. Protein (g) is constant when 6. Living arrangements = 0. It has been omitted.
e. 18. Total Fat (g) is constant when 6. Living arrangements = 0. It has been omitted.
f. 23. Carbohydrates (g) is constant when 6. Living arrangements = 0. It has been omitted.
In few cases Shapiro wilk test value is less then p value 0.00 and on this basis, it can be said that data partially is not normally
distributed.
H0: There is no significant difference between those living with family or belong to other category in terms of energy protein, fat and
carbohydrate.
H1: There is significant difference between those living with family or belong to other category in terms of energy protein, fat and
carbohydrate.
Descriptive Statistics
N Mean Std.
Deviation
Minimu
m
Maximu
m
16. Energy (KJ) 109 8333.194 2726.5415 2049.0 20063.6
17. Protein (g) 110 90.181 36.2453 18.1 258.9
18. Total Fat (g) 110 78.980 34.4656 18.7 225.0
23. Carbohydrates
(g) 110 208.901 89.2295 1.0 672.5
6. Living
arrangements 111 1.69 .980 0 4
3
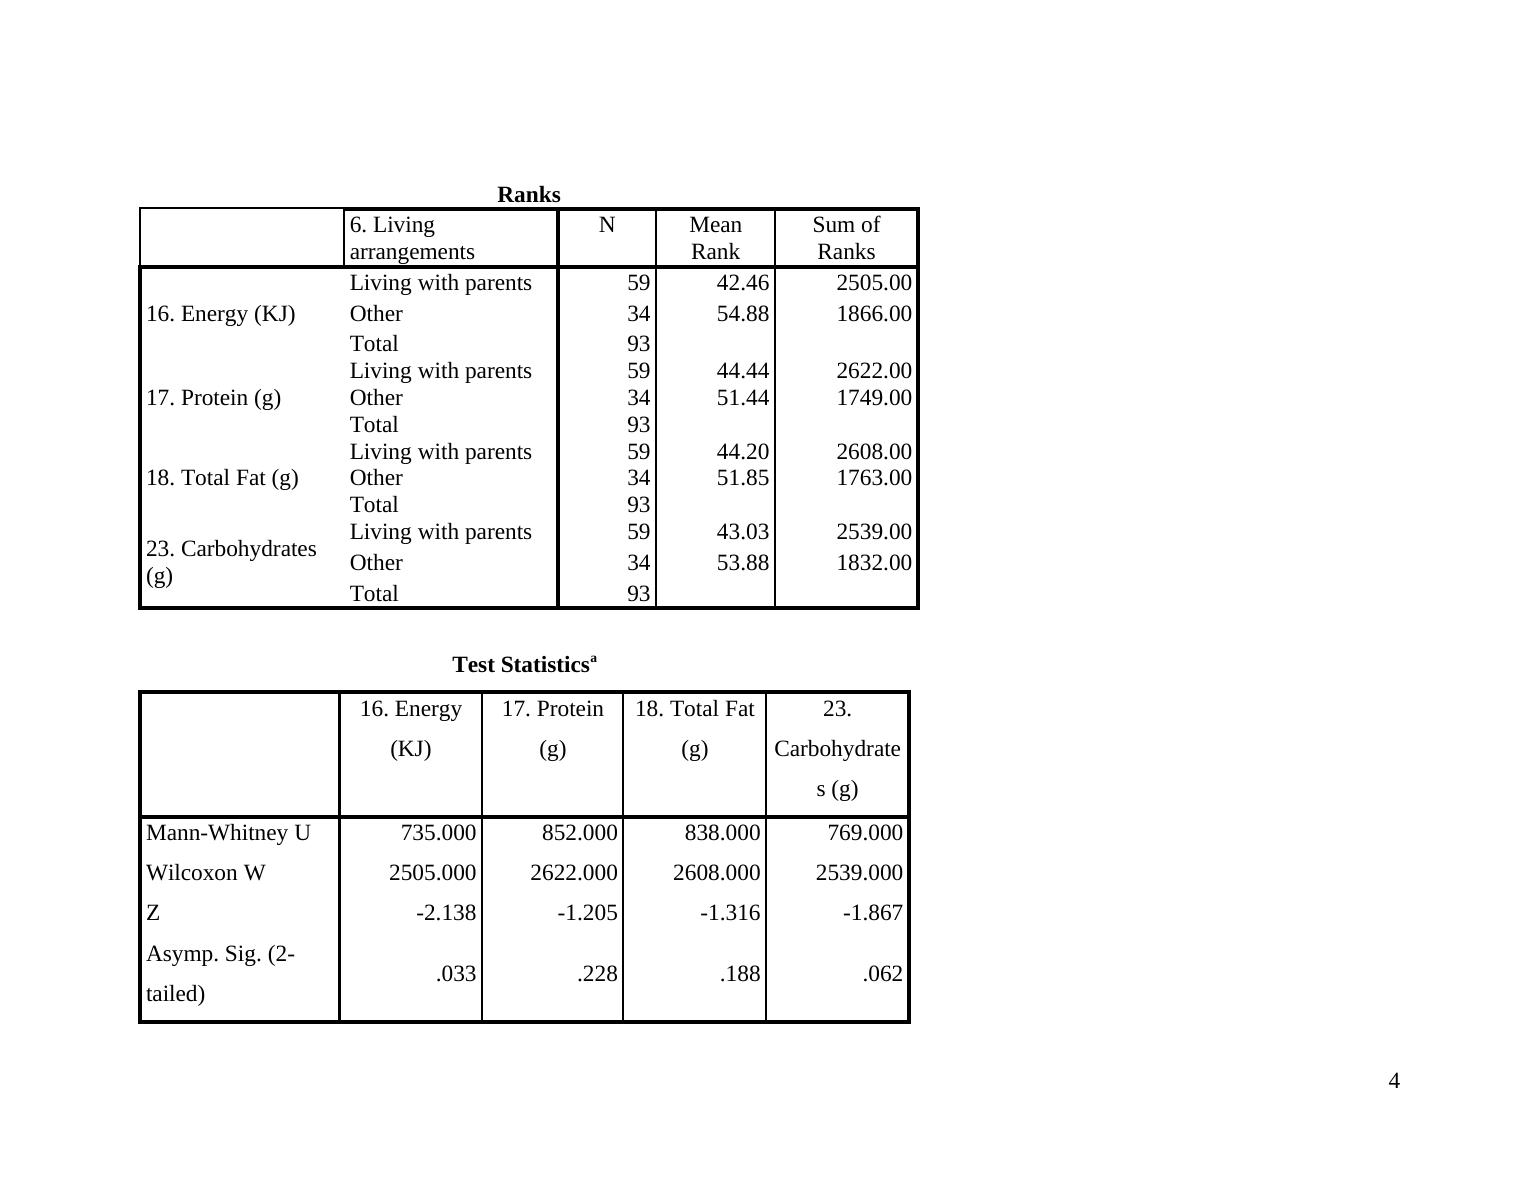
Ranks
6. Living
arrangements
N Mean
Rank
Sum of
Ranks
16. Energy (KJ)
Living with parents 59 42.46 2505.00
Other 34 54.88 1866.00
Total 93
17. Protein (g)
Living with parents 59 44.44 2622.00
Other 34 51.44 1749.00
Total 93
18. Total Fat (g)
Living with parents 59 44.20 2608.00
Other 34 51.85 1763.00
Total 93
23. Carbohydrates
(g)
Living with parents 59 43.03 2539.00
Other 34 53.88 1832.00
Total 93
Test Statisticsa
16. Energy
(KJ)
17. Protein
(g)
18. Total Fat
(g)
23.
Carbohydrate
s (g)
Mann-Whitney U 735.000 852.000 838.000 769.000
Wilcoxon W 2505.000 2622.000 2608.000 2539.000
Z -2.138 -1.205 -1.316 -1.867
Asymp. Sig. (2-
tailed) .033 .228 .188 .062
4
a. Grouping Variable: 6. Living arrangements
Interpretation
For energy, protein, total fat and carbohydrate mean rank is high for living alone group which reflect that energy level and
macronutrients are high in case of another category. Value of level of significance in case of energy 0.03<0.05 which indicate that
energy level is different across both groups. Alternative hypothesis accepted. However, in case of protein, fat and carbohydrate p
value is greater than 0.05 which indicate that across these factors there is not significant difference in those living with parents or
another group. Null hypothesis accepted.
5
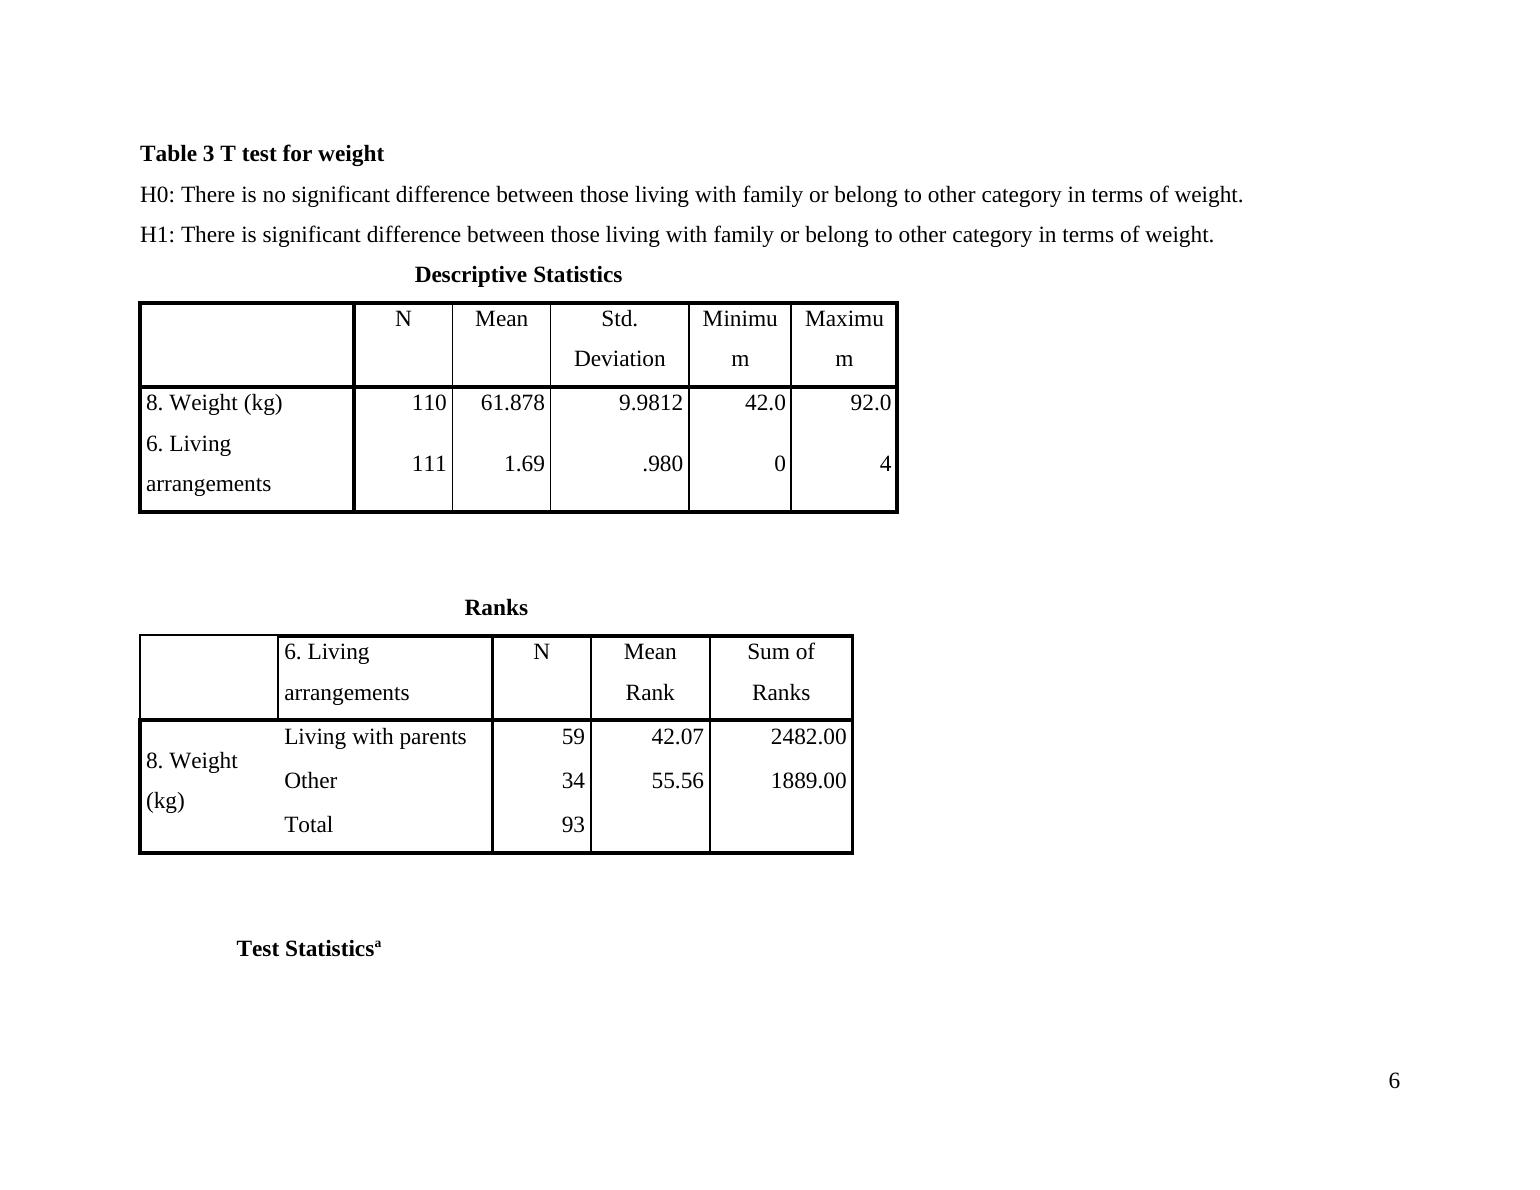
Table 3 T test for weight
H0: There is no significant difference between those living with family or belong to other category in terms of weight.
H1: There is significant difference between those living with family or belong to other category in terms of weight.
Descriptive Statistics
N Mean Std.
Deviation
Minimu
m
Maximu
m
8. Weight (kg) 110 61.878 9.9812 42.0 92.0
6. Living
arrangements 111 1.69 .980 0 4
Ranks
6. Living
arrangements
N Mean
Rank
Sum of
Ranks
8. Weight
(kg)
Living with parents 59 42.07 2482.00
Other 34 55.56 1889.00
Total 93
Test Statisticsa
6
End of preview
Want to access all the pages? Upload your documents or become a member.