University Financial Analysis Report: Dollar and Sense (BUS1AFB)
VerifiedAdded on 2022/11/16
|11
|1731
|370
Report
AI Summary
This report analyzes the financial performance of Domino's Pizza Enterprises Limited and Retail Food Group Limited. The analysis includes calculating holding period returns, expected returns, and total returns to shareholders for each company from 2013 to 2018. Key financial ratios, such as profitability, efficiency, liquidity, and solvency ratios, are calculated and compared. The report also examines a case study involving a cupcake business, calculating contribution margin, breakeven points, annual profit, net present value, and profitability index. Based on these calculations, recommendations are provided to improve the business's viability and mitigate risks. The report uses data from Yahoo Finance and company annual reports to support its findings and provides recommendations to improve the business's viability and mitigate risks.
Running head: DOLLAR AND SENSE
Dollar and Sense
Name of the Student:
Name of the University:
Author’s Note:
Course ID:
Dollar and Sense
Name of the Student:
Name of the University:
Author’s Note:
Course ID:
Paraphrase This Document
Need a fresh take? Get an instant paraphrase of this document with our AI Paraphraser
1DOLLAR AND SENSE
Table of Contents
Case study 1:....................................................................................................................................2
1. Holding period return:.................................................................................................................2
2. Expected Return:.........................................................................................................................2
3. Total Return to Shareholders:......................................................................................................2
4. Comparing and contrasting the performance:..............................................................................3
5. Calculating certain ratios of the organizations:...........................................................................4
6. Calculations of financial ratios:...................................................................................................4
6.a Profitability ratio:.......................................................................................................................4
6.b Efficiency ratio:.........................................................................................................................5
6.c Liquidity ratio:...........................................................................................................................5
6.d Solvency ratio:...........................................................................................................................6
Case study 2:....................................................................................................................................6
1. Contribution margin:...................................................................................................................6
2. Breakeven:...................................................................................................................................7
3. Annual profit before tax:.............................................................................................................7
4. Net profit per year:.......................................................................................................................7
5. Net present value:........................................................................................................................8
6. Profitability index:.......................................................................................................................8
7. Providing recommendations:.......................................................................................................8
8. Advising the measures that can minimize exposure of risk:.......................................................9
References and Bibliography:........................................................................................................10
2DOLLAR AND SENSE
Case study 1:
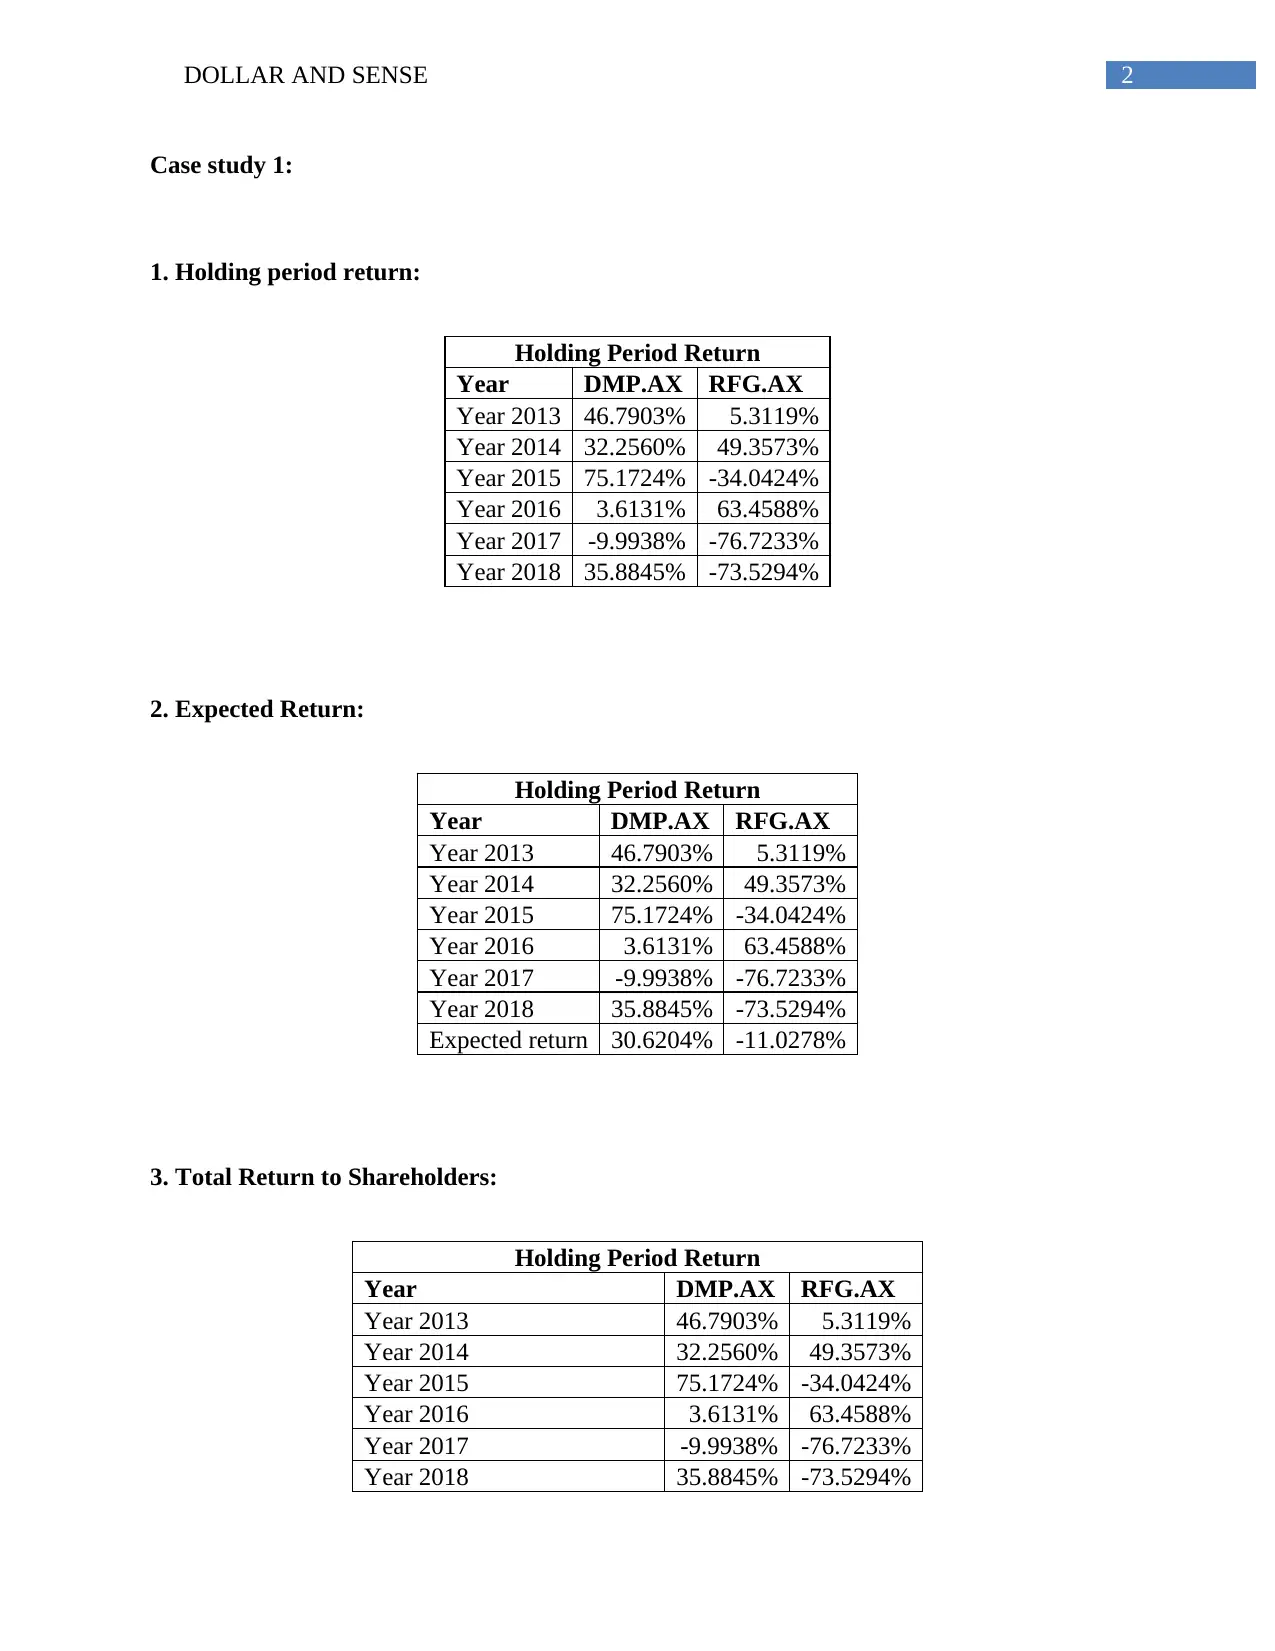
1. Holding period return:
Holding Period Return
Year DMP.AX RFG.AX
Year 2013 46.7903% 5.3119%
Year 2014 32.2560% 49.3573%
Year 2015 75.1724% -34.0424%
Year 2016 3.6131% 63.4588%
Year 2017 -9.9938% -76.7233%
Year 2018 35.8845% -73.5294%
2. Expected Return:
Holding Period Return
Year DMP.AX RFG.AX
Year 2013 46.7903% 5.3119%
Year 2014 32.2560% 49.3573%
Year 2015 75.1724% -34.0424%
Year 2016 3.6131% 63.4588%
Year 2017 -9.9938% -76.7233%
Year 2018 35.8845% -73.5294%
Expected return 30.6204% -11.0278%
3. Total Return to Shareholders:
Holding Period Return
Year DMP.AX RFG.AX
Year 2013 46.7903% 5.3119%
Year 2014 32.2560% 49.3573%
Year 2015 75.1724% -34.0424%
Year 2016 3.6131% 63.4588%
Year 2017 -9.9938% -76.7233%
Year 2018 35.8845% -73.5294%
Case study 1:
1. Holding period return:
Holding Period Return
Year DMP.AX RFG.AX
Year 2013 46.7903% 5.3119%
Year 2014 32.2560% 49.3573%
Year 2015 75.1724% -34.0424%
Year 2016 3.6131% 63.4588%
Year 2017 -9.9938% -76.7233%
Year 2018 35.8845% -73.5294%
2. Expected Return:
Holding Period Return
Year DMP.AX RFG.AX
Year 2013 46.7903% 5.3119%
Year 2014 32.2560% 49.3573%
Year 2015 75.1724% -34.0424%
Year 2016 3.6131% 63.4588%
Year 2017 -9.9938% -76.7233%
Year 2018 35.8845% -73.5294%
Expected return 30.6204% -11.0278%
3. Total Return to Shareholders:
Holding Period Return
Year DMP.AX RFG.AX
Year 2013 46.7903% 5.3119%
Year 2014 32.2560% 49.3573%
Year 2015 75.1724% -34.0424%
Year 2016 3.6131% 63.4588%
Year 2017 -9.9938% -76.7233%
Year 2018 35.8845% -73.5294%
⊘ This is a preview!⊘
Do you want full access?
Subscribe today to unlock all pages.
Trusted by 1+ million students worldwide
3DOLLAR AND SENSE
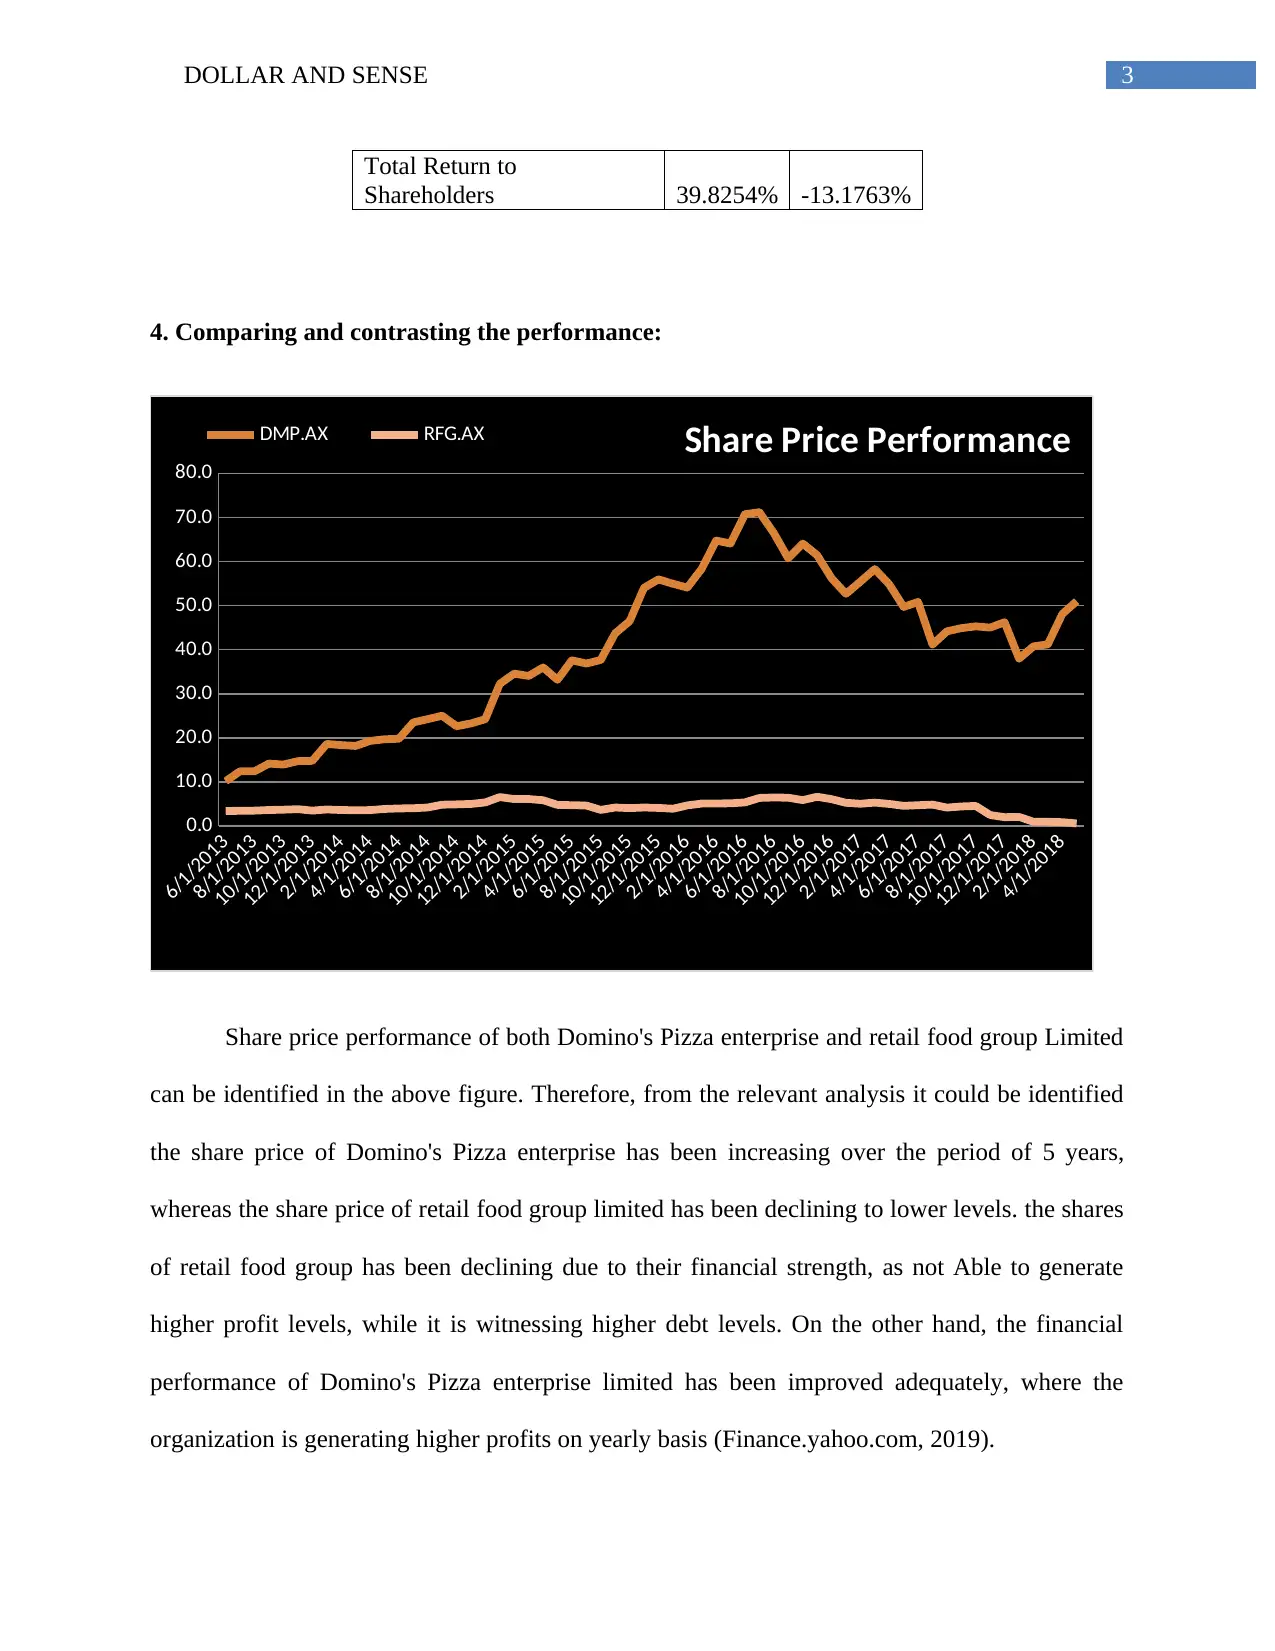
Total Return to
Shareholders 39.8254% -13.1763%
4. Comparing and contrasting the performance:
6/1/2013
8/1/2013
10/1/2013
12/1/2013
2/1/2014
4/1/2014
6/1/2014
8/1/2014
10/1/2014
12/1/2014
2/1/2015
4/1/2015
6/1/2015
8/1/2015
10/1/2015
12/1/2015
2/1/2016
4/1/2016
6/1/2016
8/1/2016
10/1/2016
12/1/2016
2/1/2017
4/1/2017
6/1/2017
8/1/2017
10/1/2017
12/1/2017
2/1/2018
4/1/2018
0.0
10.0
20.0
30.0
40.0
50.0
60.0
70.0
80.0
Share Price PerformanceDMP.AX RFG.AX
Share price performance of both Domino's Pizza enterprise and retail food group Limited
can be identified in the above figure. Therefore, from the relevant analysis it could be identified
the share price of Domino's Pizza enterprise has been increasing over the period of 5 years,
whereas the share price of retail food group limited has been declining to lower levels. the shares
of retail food group has been declining due to their financial strength, as not Able to generate
higher profit levels, while it is witnessing higher debt levels. On the other hand, the financial
performance of Domino's Pizza enterprise limited has been improved adequately, where the
organization is generating higher profits on yearly basis (Finance.yahoo.com, 2019).
Paraphrase This Document
Need a fresh take? Get an instant paraphrase of this document with our AI Paraphraser
4DOLLAR AND SENSE
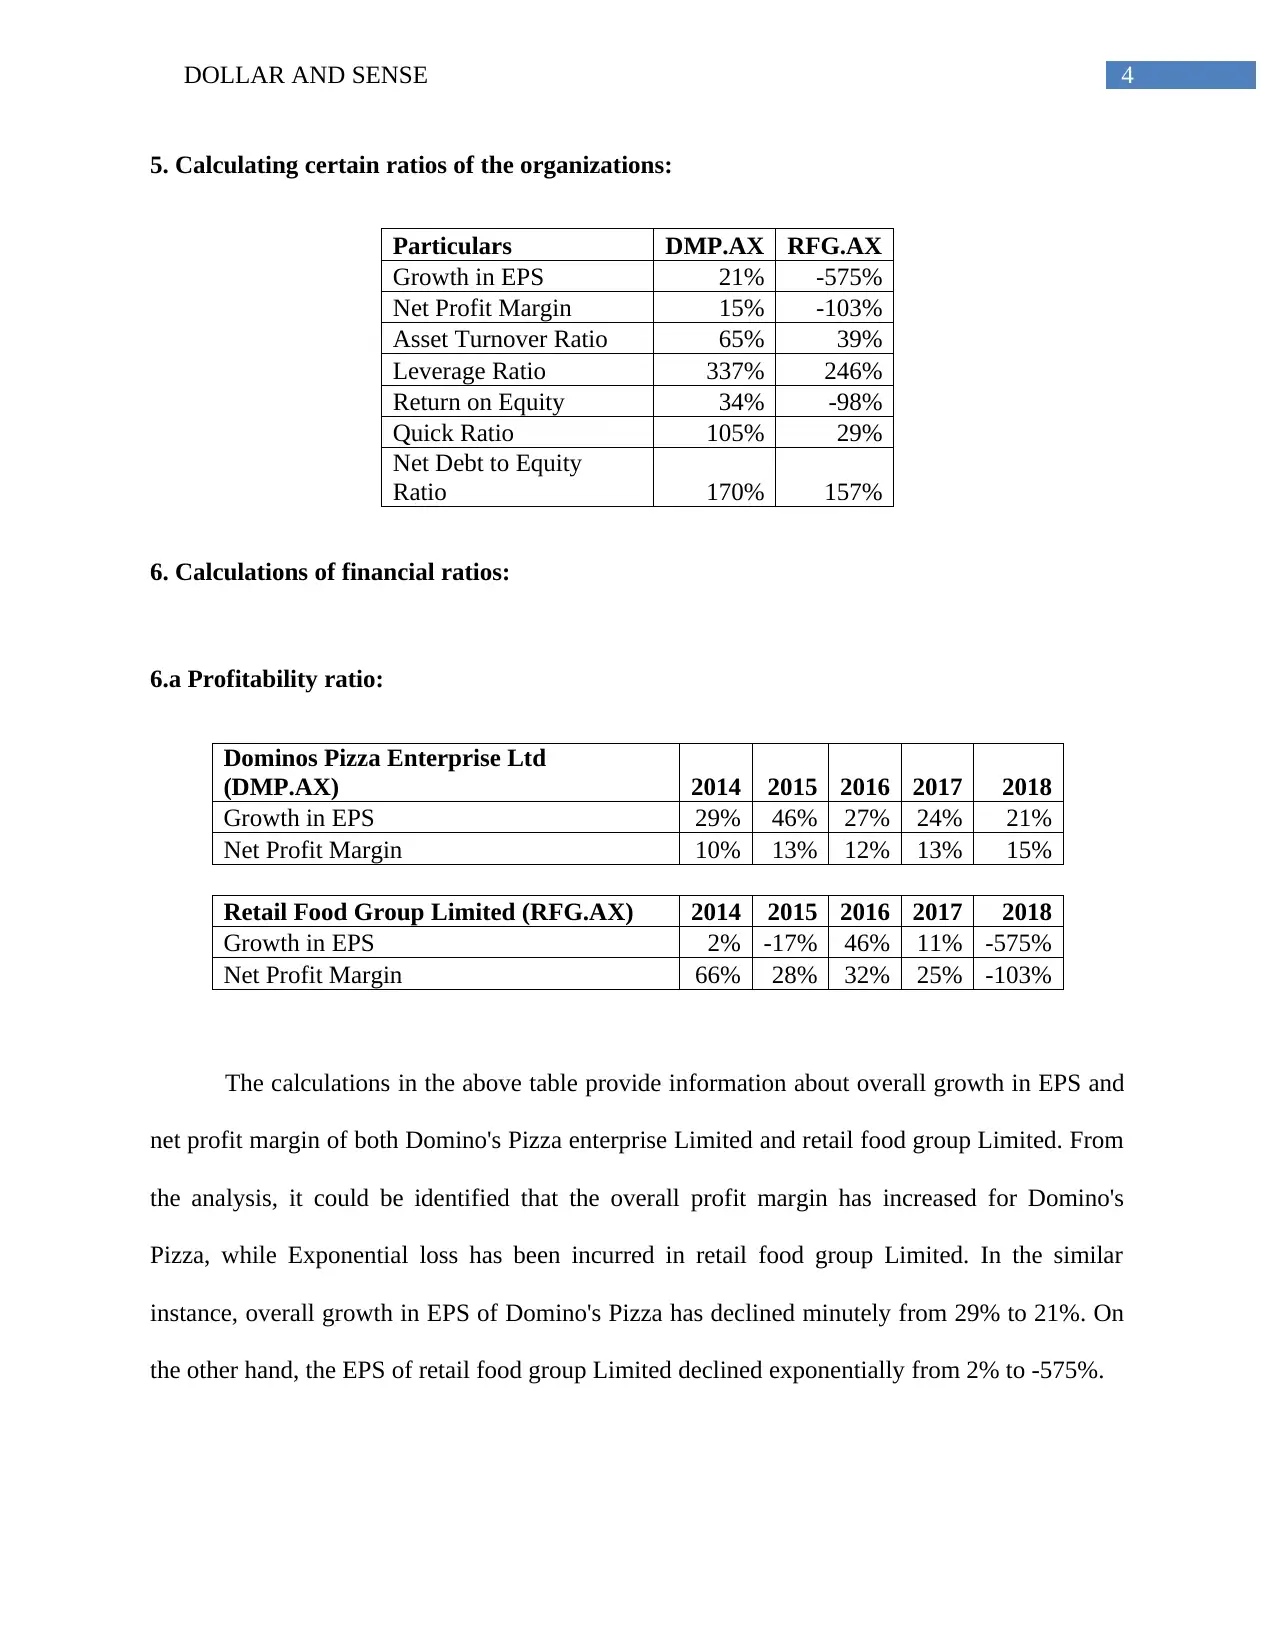
5. Calculating certain ratios of the organizations:
Particulars DMP.AX RFG.AX
Growth in EPS 21% -575%
Net Profit Margin 15% -103%
Asset Turnover Ratio 65% 39%
Leverage Ratio 337% 246%
Return on Equity 34% -98%
Quick Ratio 105% 29%
Net Debt to Equity
Ratio 170% 157%
6. Calculations of financial ratios:
6.a Profitability ratio:
Dominos Pizza Enterprise Ltd
(DMP.AX) 2014 2015 2016 2017 2018
Growth in EPS 29% 46% 27% 24% 21%
Net Profit Margin 10% 13% 12% 13% 15%
Retail Food Group Limited (RFG.AX) 2014 2015 2016 2017 2018
Growth in EPS 2% -17% 46% 11% -575%
Net Profit Margin 66% 28% 32% 25% -103%
The calculations in the above table provide information about overall growth in EPS and
net profit margin of both Domino's Pizza enterprise Limited and retail food group Limited. From
the analysis, it could be identified that the overall profit margin has increased for Domino's
Pizza, while Exponential loss has been incurred in retail food group Limited. In the similar
instance, overall growth in EPS of Domino's Pizza has declined minutely from 29% to 21%. On
the other hand, the EPS of retail food group Limited declined exponentially from 2% to -575%.
5DOLLAR AND SENSE
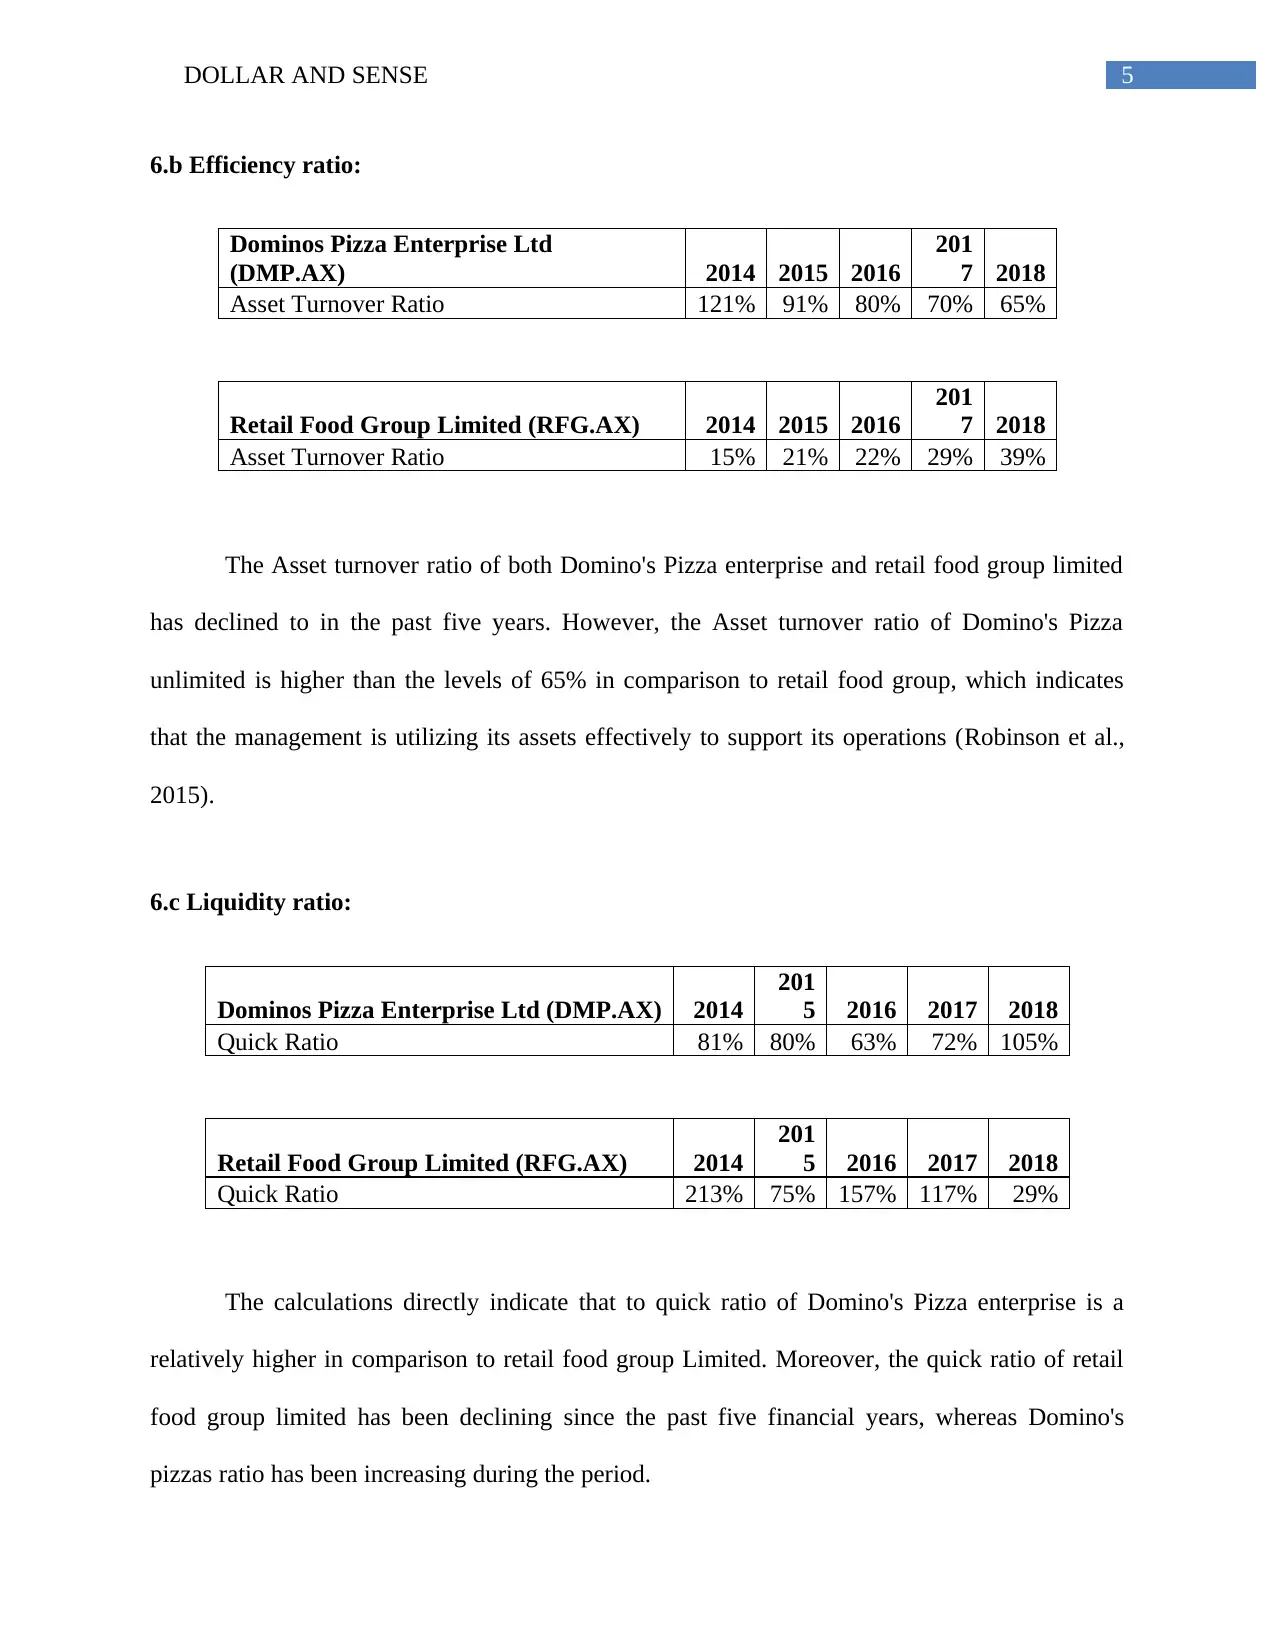
6.b Efficiency ratio:
Dominos Pizza Enterprise Ltd
(DMP.AX) 2014 2015 2016
201
7 2018
Asset Turnover Ratio 121% 91% 80% 70% 65%
Retail Food Group Limited (RFG.AX) 2014 2015 2016
201
7 2018
Asset Turnover Ratio 15% 21% 22% 29% 39%
The Asset turnover ratio of both Domino's Pizza enterprise and retail food group limited
has declined to in the past five years. However, the Asset turnover ratio of Domino's Pizza
unlimited is higher than the levels of 65% in comparison to retail food group, which indicates
that the management is utilizing its assets effectively to support its operations (Robinson et al.,
2015).
6.c Liquidity ratio:
Dominos Pizza Enterprise Ltd (DMP.AX) 2014
201
5 2016 2017 2018
Quick Ratio 81% 80% 63% 72% 105%
Retail Food Group Limited (RFG.AX) 2014
201
5 2016 2017 2018
Quick Ratio 213% 75% 157% 117% 29%
The calculations directly indicate that to quick ratio of Domino's Pizza enterprise is a
relatively higher in comparison to retail food group Limited. Moreover, the quick ratio of retail
food group limited has been declining since the past five financial years, whereas Domino's
pizzas ratio has been increasing during the period.
⊘ This is a preview!⊘
Do you want full access?
Subscribe today to unlock all pages.
Trusted by 1+ million students worldwide
6DOLLAR AND SENSE
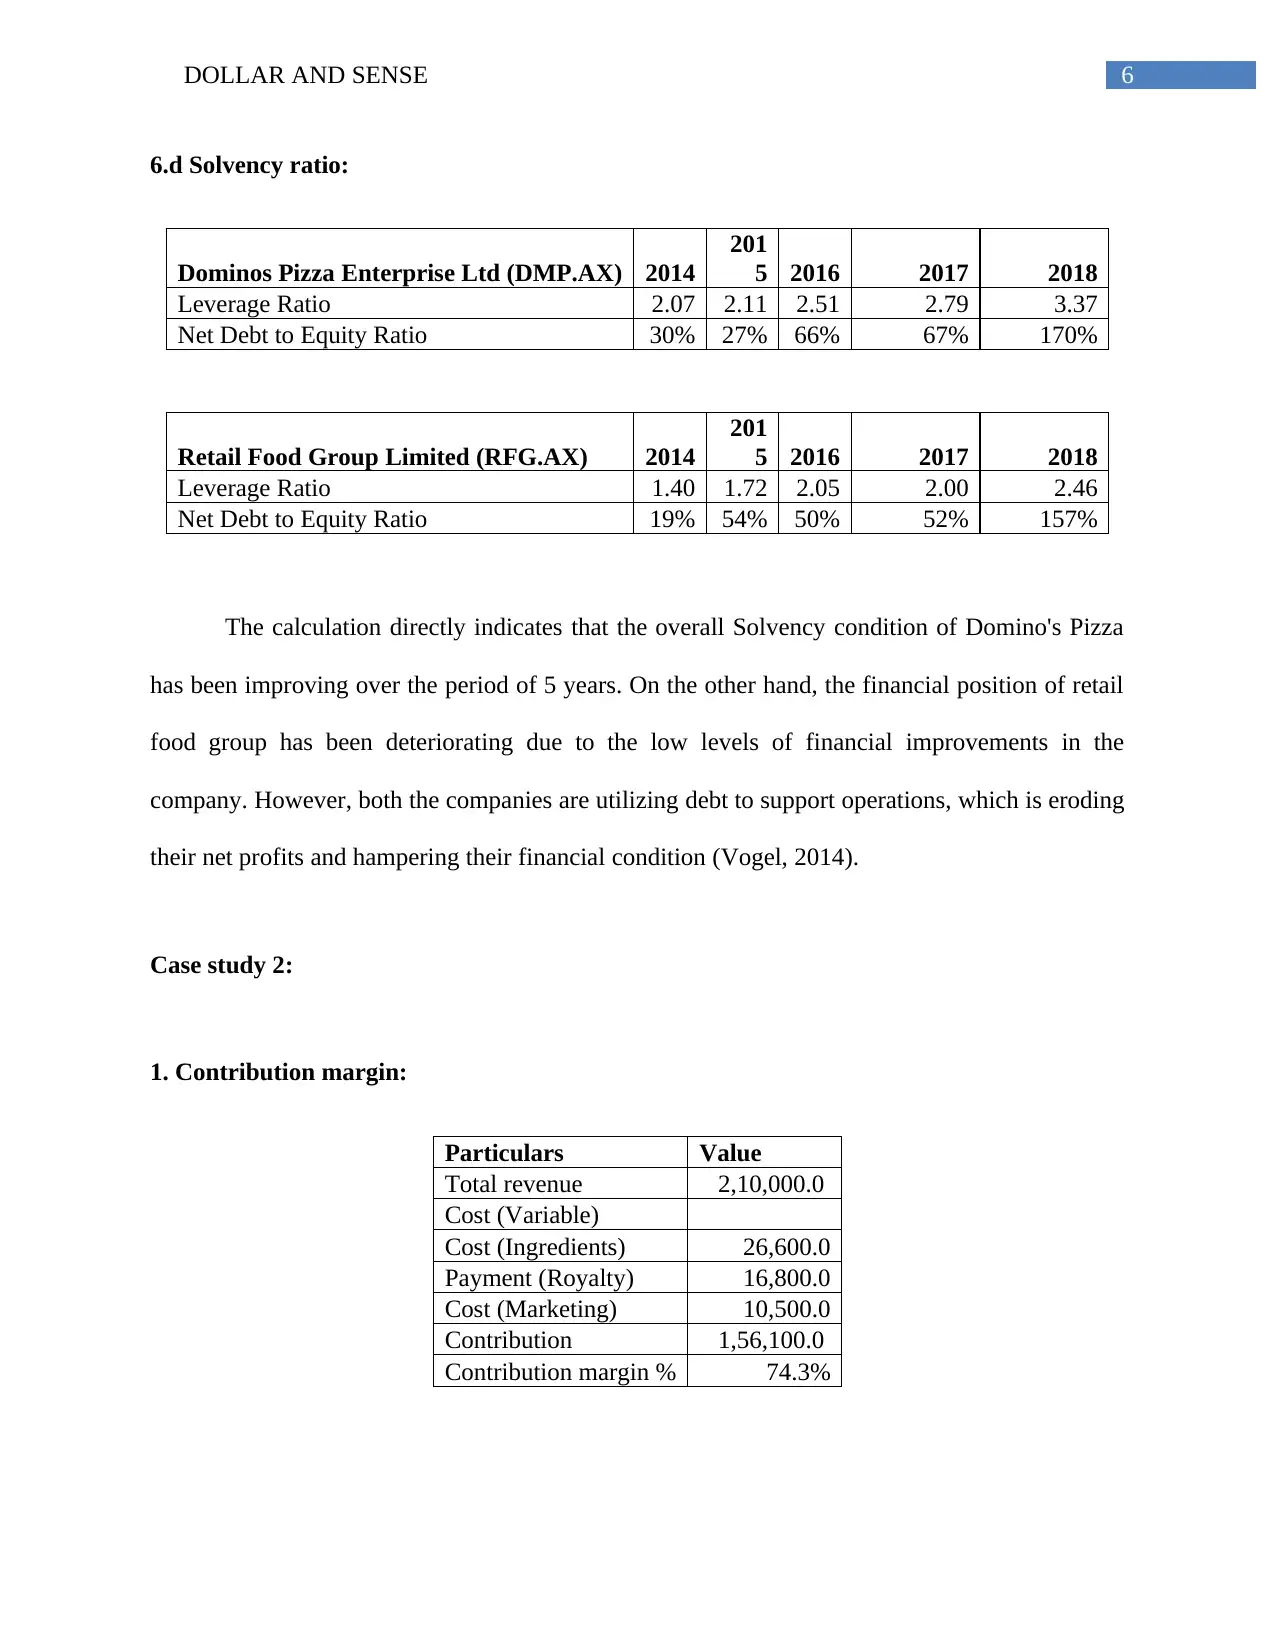
6.d Solvency ratio:
Dominos Pizza Enterprise Ltd (DMP.AX) 2014
201
5 2016 2017 2018
Leverage Ratio 2.07 2.11 2.51 2.79 3.37
Net Debt to Equity Ratio 30% 27% 66% 67% 170%
Retail Food Group Limited (RFG.AX) 2014
201
5 2016 2017 2018
Leverage Ratio 1.40 1.72 2.05 2.00 2.46
Net Debt to Equity Ratio 19% 54% 50% 52% 157%
The calculation directly indicates that the overall Solvency condition of Domino's Pizza
has been improving over the period of 5 years. On the other hand, the financial position of retail
food group has been deteriorating due to the low levels of financial improvements in the
company. However, both the companies are utilizing debt to support operations, which is eroding
their net profits and hampering their financial condition (Vogel, 2014).
Case study 2:
1. Contribution margin:
Particulars Value
Total revenue 2,10,000.0
Cost (Variable)
Cost (Ingredients) 26,600.0
Payment (Royalty) 16,800.0
Cost (Marketing) 10,500.0
Contribution 1,56,100.0
Contribution margin % 74.3%
Paraphrase This Document
Need a fresh take? Get an instant paraphrase of this document with our AI Paraphraser
7DOLLAR AND SENSE
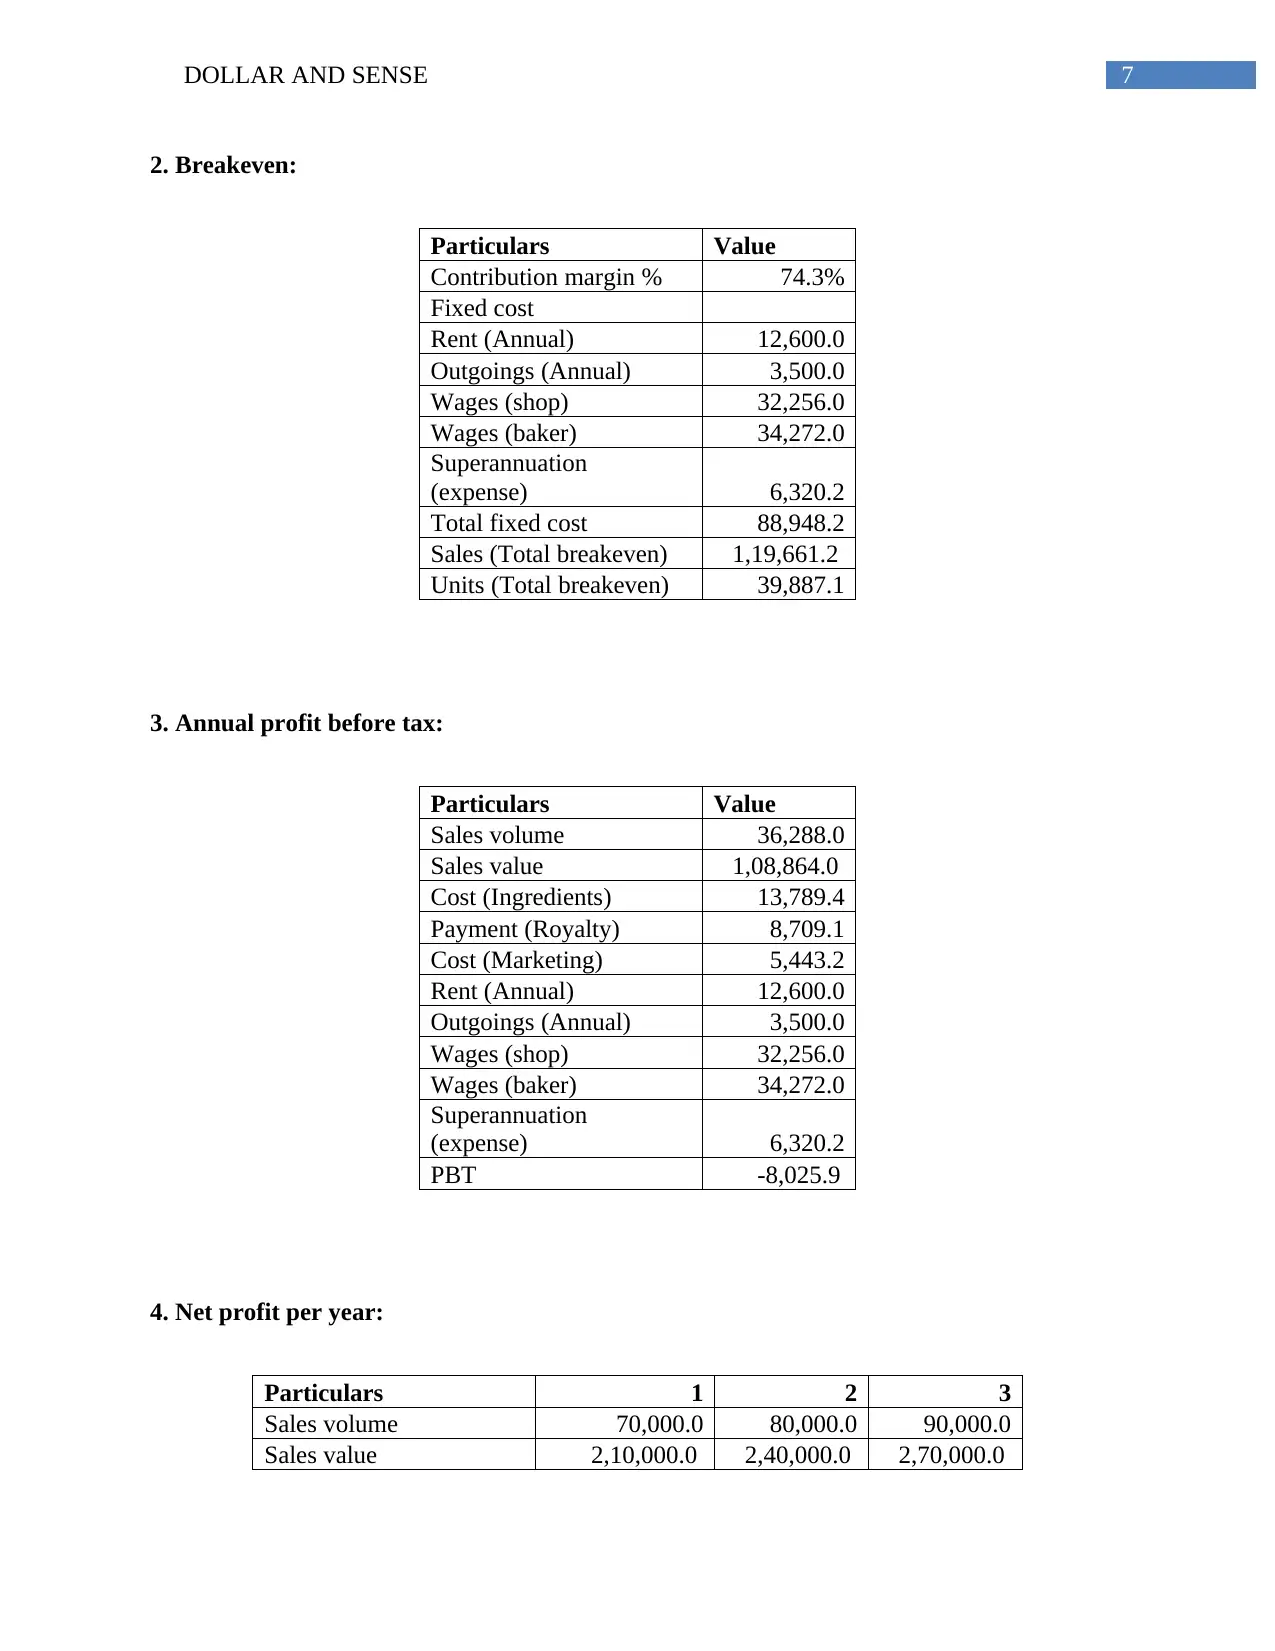
2. Breakeven:
Particulars Value
Contribution margin % 74.3%
Fixed cost
Rent (Annual) 12,600.0
Outgoings (Annual) 3,500.0
Wages (shop) 32,256.0
Wages (baker) 34,272.0
Superannuation
(expense) 6,320.2
Total fixed cost 88,948.2
Sales (Total breakeven) 1,19,661.2
Units (Total breakeven) 39,887.1
3. Annual profit before tax:
Particulars Value
Sales volume 36,288.0
Sales value 1,08,864.0
Cost (Ingredients) 13,789.4
Payment (Royalty) 8,709.1
Cost (Marketing) 5,443.2
Rent (Annual) 12,600.0
Outgoings (Annual) 3,500.0
Wages (shop) 32,256.0
Wages (baker) 34,272.0
Superannuation
(expense) 6,320.2
PBT -8,025.9
4. Net profit per year:
Particulars 1 2 3
Sales volume 70,000.0 80,000.0 90,000.0
Sales value 2,10,000.0 2,40,000.0 2,70,000.0
8DOLLAR AND SENSE
Cost (Ingredients) 26,600.0 30,400.0 34,200.0
Payment (Royalty) 16,800.0 19,200.0 21,600.0
Cost (Marketing) 10,500.0 12,000.0 13,500.0
Rent (Annual) 12,600.0 12,600.0 12,600.0
Outgoings (Annual) 3,500.0 3,500.0 3,500.0
Wages (shop) 32,256.0 32,256.0 32,256.0
Wages (baker) 34,272.0 34,272.0 34,272.0
Superannuation
(expense) 6,320.2 6,320.2 6,320.2
PBT 67,151.8 89,451.8 1,11,751.8
Tax 20,145.6 26,835.6 33,525.6
PAT 47,006.3 62,616.3 78,226.3
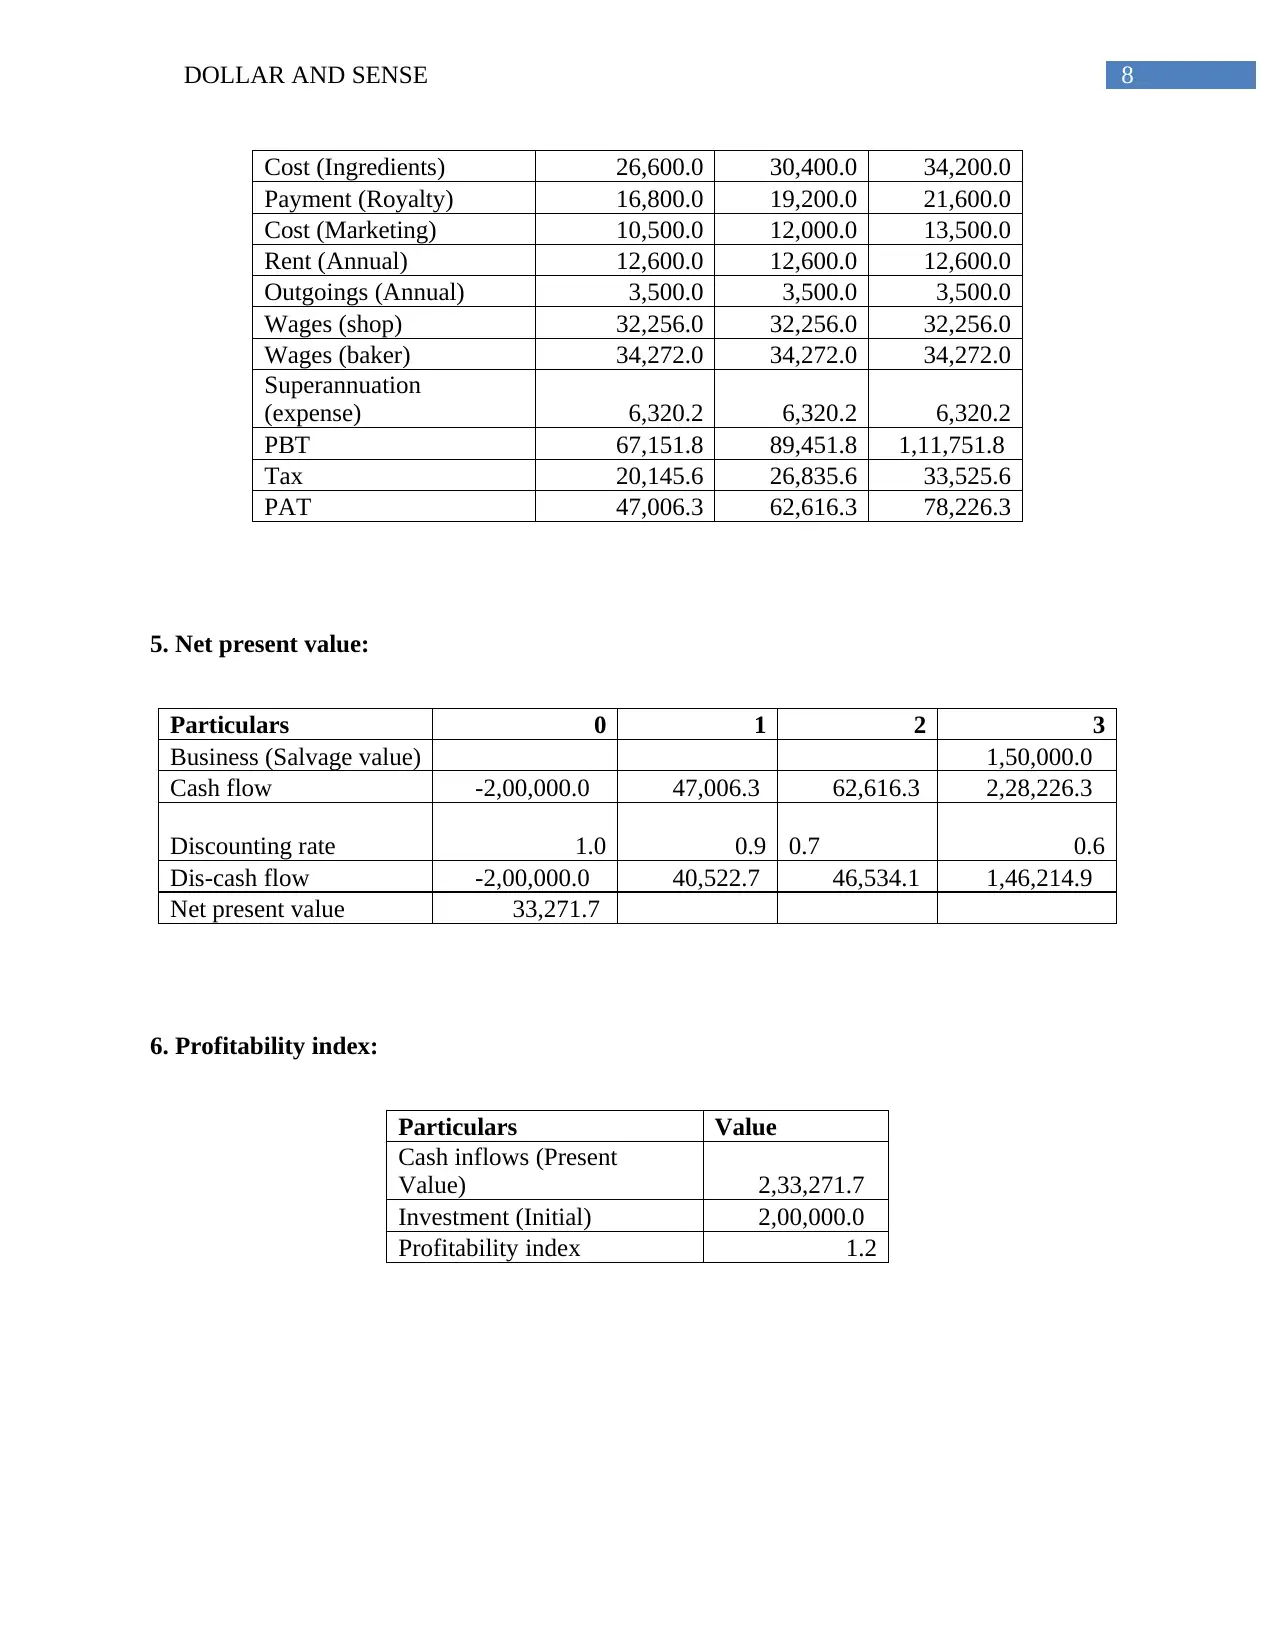
5. Net present value:
Particulars 0 1 2 3
Business (Salvage value) 1,50,000.0
Cash flow -2,00,000.0 47,006.3 62,616.3 2,28,226.3
Discounting rate 1.0 0.9 0.7 0.6
Dis-cash flow -2,00,000.0 40,522.7 46,534.1 1,46,214.9
Net present value 33,271.7
6. Profitability index:
Particulars Value
Cash inflows (Present
Value) 2,33,271.7
Investment (Initial) 2,00,000.0
Profitability index 1.2
Cost (Ingredients) 26,600.0 30,400.0 34,200.0
Payment (Royalty) 16,800.0 19,200.0 21,600.0
Cost (Marketing) 10,500.0 12,000.0 13,500.0
Rent (Annual) 12,600.0 12,600.0 12,600.0
Outgoings (Annual) 3,500.0 3,500.0 3,500.0
Wages (shop) 32,256.0 32,256.0 32,256.0
Wages (baker) 34,272.0 34,272.0 34,272.0
Superannuation
(expense) 6,320.2 6,320.2 6,320.2
PBT 67,151.8 89,451.8 1,11,751.8
Tax 20,145.6 26,835.6 33,525.6
PAT 47,006.3 62,616.3 78,226.3
5. Net present value:
Particulars 0 1 2 3
Business (Salvage value) 1,50,000.0
Cash flow -2,00,000.0 47,006.3 62,616.3 2,28,226.3
Discounting rate 1.0 0.9 0.7 0.6
Dis-cash flow -2,00,000.0 40,522.7 46,534.1 1,46,214.9
Net present value 33,271.7
6. Profitability index:
Particulars Value
Cash inflows (Present
Value) 2,33,271.7
Investment (Initial) 2,00,000.0
Profitability index 1.2
⊘ This is a preview!⊘
Do you want full access?
Subscribe today to unlock all pages.
Trusted by 1+ million students worldwide
9DOLLAR AND SENSE
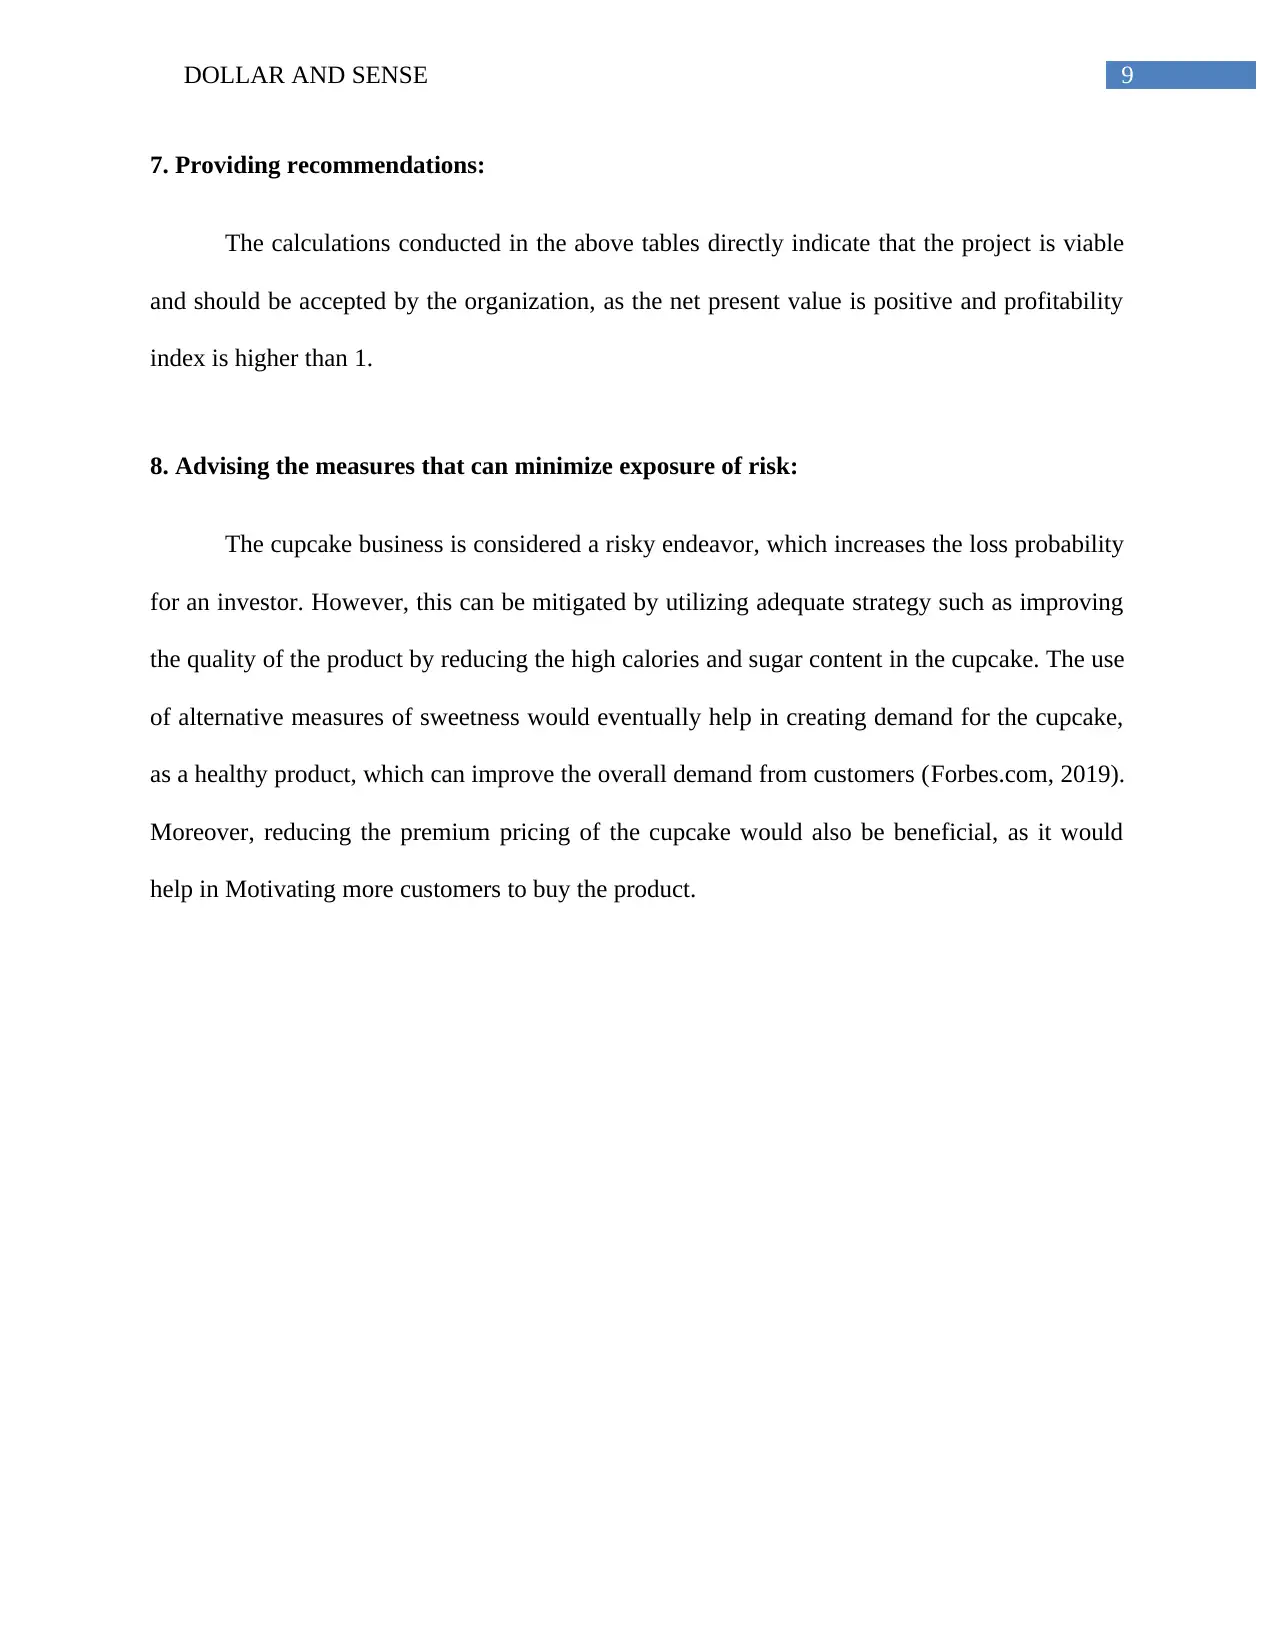
7. Providing recommendations:
The calculations conducted in the above tables directly indicate that the project is viable
and should be accepted by the organization, as the net present value is positive and profitability
index is higher than 1.
8. Advising the measures that can minimize exposure of risk:
The cupcake business is considered a risky endeavor, which increases the loss probability
for an investor. However, this can be mitigated by utilizing adequate strategy such as improving
the quality of the product by reducing the high calories and sugar content in the cupcake. The use
of alternative measures of sweetness would eventually help in creating demand for the cupcake,
as a healthy product, which can improve the overall demand from customers (Forbes.com, 2019).
Moreover, reducing the premium pricing of the cupcake would also be beneficial, as it would
help in Motivating more customers to buy the product.
Paraphrase This Document
Need a fresh take? Get an instant paraphrase of this document with our AI Paraphraser
10DOLLAR AND SENSE
References and Bibliography:
Baum, A. E., & Crosby, N. (2014). Property investment appraisal. John Wiley & Sons.
Finance.yahoo.com. (2019). Finance.yahoo.com. Retrieved 19 May 2019, from
https://finance.yahoo.com/quote/RFG.AX/history?
period1=1372530600&period2=1530297000&interval=div
%7Csplit&filter=div&frequency=1mo
Forbes.com. (2019). Forbes.com. Retrieved 19 May 2019, from
https://www.forbes.com/sites/allbusiness/2013/09/30/7-business-lessons-from-gourmet-
cupcakes/#c4a647440fab
Harris, E. (2017). Strategic project risk appraisal and management. Routledge.
Robinson, T. R., Henry, E., Pirie, W. L., & Broihahn, M. A. (2015). International financial
statement analysis. John Wiley & Sons.
Vogel, H. L. (2014). Entertainment industry economics: A guide for financial analysis.
Cambridge University Press.
1 out of 11
Related Documents


Your All-in-One AI-Powered Toolkit for Academic Success.
+13062052269
info@desklib.com
Available 24*7 on WhatsApp / Email
![[object Object]](/_next/static/media/star-bottom.7253800d.svg)
Unlock your academic potential
Copyright © 2020–2025 A2Z Services. All Rights Reserved. Developed and managed by ZUCOL.