Dynamic Aviation Environment Toolkit: British Airways Analysis Project
VerifiedAdded on 2023/01/04
|16
|4612
|76
Project
AI Summary
This project examines the dynamic aviation environment, focusing on British Airways and its response to the COVID-19 crisis. The assignment begins with a justification for selecting British Airways, highlighting its significance as a leading UK flag carrier. It then analyzes current trends in the aviation sector, drawing on data sets related to passenger numbers in Middle Eastern airports, traffic results for key airlines, and industry profitability. A definitional analysis of 'geopolitical' is conducted using three sources, followed by the student's own definition. The project concludes with a media analysis of British Airways, evaluating the coverage and its impact on the organization, including job cuts and financial challenges. The analysis uses news articles to assess the crisis's effects on the airline.
1
Dynamic Aviation Environment
Toolkit
A Chosen organisation
Choose one airline/airport affected by the crisis and provide a brief justification for your
choice.
Your focus throughout the assignment will be on the organisation chosen so make sure
you can access information related to it. If you choose an airport, be aware that financial
information may be more difficult to access and this may alter the approach required in
Task E. Your justification should be brief and should focus more on the organisation’s
relevance to the diplomatic crisis under consideration rather than availability of
information (100 words max.).
British Airways, it is known as one of the leading flag carrier airline within
United Kingdom. Respective firm was developed in year 1974 as well as
having headquarters is in London, England. Moreover, this is also considered
to be the second largest UK base carriers according to its size of fleet as well
as the passengers they carried beside easy jet. In addition to this, respective
entity that operates in airline industry was established after a Board of
British was incorporated by their government for administering two
nationalized development of airlines that are British European Airways as
well as the other is British Overseas Airways corporations. Along with this,
they perform their operation worldwide into diverse number of country as
well as there are around above 50, 60 staff who working in order to run
business effectively and efficiently. At present time, respective business is
impacted through COVID-19 pandemic issue as because of this issues the
whole world have to face the situation of lockdown as well as its functioning
get impacted adversely in respect of sales minimisation as well profit.
B Current trends in aviation
Based on the given data sets, determine the nature of current trends in the aviation sector.
You have three sets of data to consider, each represented by a table. These are given below:
Table 1: Passenger numbers (by year) in key airports across the Middle East
Paraphrase This Document
Need a fresh take? Get an instant paraphrase of this document with our AI Paraphraser
2
2016 2017 2018
Dubai (DXB) 83,654,250 88,242,099 89,149,387
Hamad (DOH) 37,322,843 35,867,752 35,400,000
King Abdulaziz (JED) 31,322,843 33,917,282 41,200,000
Abu Dhabi (AUH) 24,482,119 23,760,561 22,010,866
Riyadh (RUH) 23,400,000 25,038,000 26,772,525
(Source: ACI)
Table 2: Traffic results for key airlines in Middle East, 2018
RPKs (m) % change ASKs (m) % change LF (%) Pax (m) % change
Emirates 299,967 2.7 390,582 3.6 76.8 58.6 0.2
Qatar 154,080 5.5 231,094 13.5 67.0 29.5 1.0
Etihad 84,269 -6.7 110,300 -4.1 76.4 17.8 -4.3
Saudia 68,500 8.4 102,000 8.0 67.2 34.0 8.3
Oman 25,033 14.0 31,656 7.7 79.1 9.5 10.6
(Source: Airline Business)
Table 3: Airline industry profitability and traffic, by region, 2018-20
2018 2019 2020 (Forecast)
Africa
Net post-tax profit ($
bn)
-0.1 -0.3 -2.0
- Per passenger ($) -1.09 -2.67 -42.02
RPK growth (%) 8.0% 4.5% -58.5%
ASK growth (%) 7.5% 4.2% -50.4%
Asia-Pacific
Net post-tax profit ($
bn)
6.1 4.9 -29.0
- Per passenger ($) 3.74 2.92 -30.09
RPK growth (%) 7.0% 4.8% -53.8%
ASK growth (%) 6.8% 4.5% -39.2%
Middle East
Net post-tax profit ($
bn)
-1.5 -1.5 -4.8
- Per passenger ($) -6.69 -6.75 -37.03
RPK growth (%) 7.0% 2.3% -56.1%
ASK growth (%) 4.9% 0.1% -46.1%
Latin America
Net post-tax profit ($
bn)
-0.8 -0.7 -4.0
- Per passenger ($) -2.78 -2.24 -27.83
RPK growth (%) 8.0% 4.1% -57.4%
ASK growth (%) 7.5% 3.0% -43.3%
N America
Net post-tax profit ($
bn)
14.5 17.4 -23.1
3
- Per passenger ($) 14.66 16.95 -38.95
RPK growth (%) 3.5% 3.9% -52.6%
ASK growth (%) 3.4% 2.9% -35.2%
Europe
Net post-tax profit ($
bn)
9.1 6.5 -21.5
- Per passenger ($) 7.94 5.42 -34.39
RPK growth (%) 6.0% 4.3% -56.4%
ASK growth (%) 5.5% 3.6% -42.9%
(Source: IATA)
Note:% change represents the change between the figures for the year shown and the
ones for the year previously, expressed as a percentage of the previous year’s figure.
Higher values represent stronger growth; negative values show a decline.
So, e.g. in Table 2, the % change in the RPK figure for Emirates is given as 2.7%. This
means that RPKs grew between 2017 and 2018 by 2.7%. In Table 3, RPK growth for the
Middle East in 2018 was 7.0%. This tells us that that across the region, RPKs grew by this
amount between 2017 and 2018.
Consider each set of data and comment on the trends depicted (250 words max.)
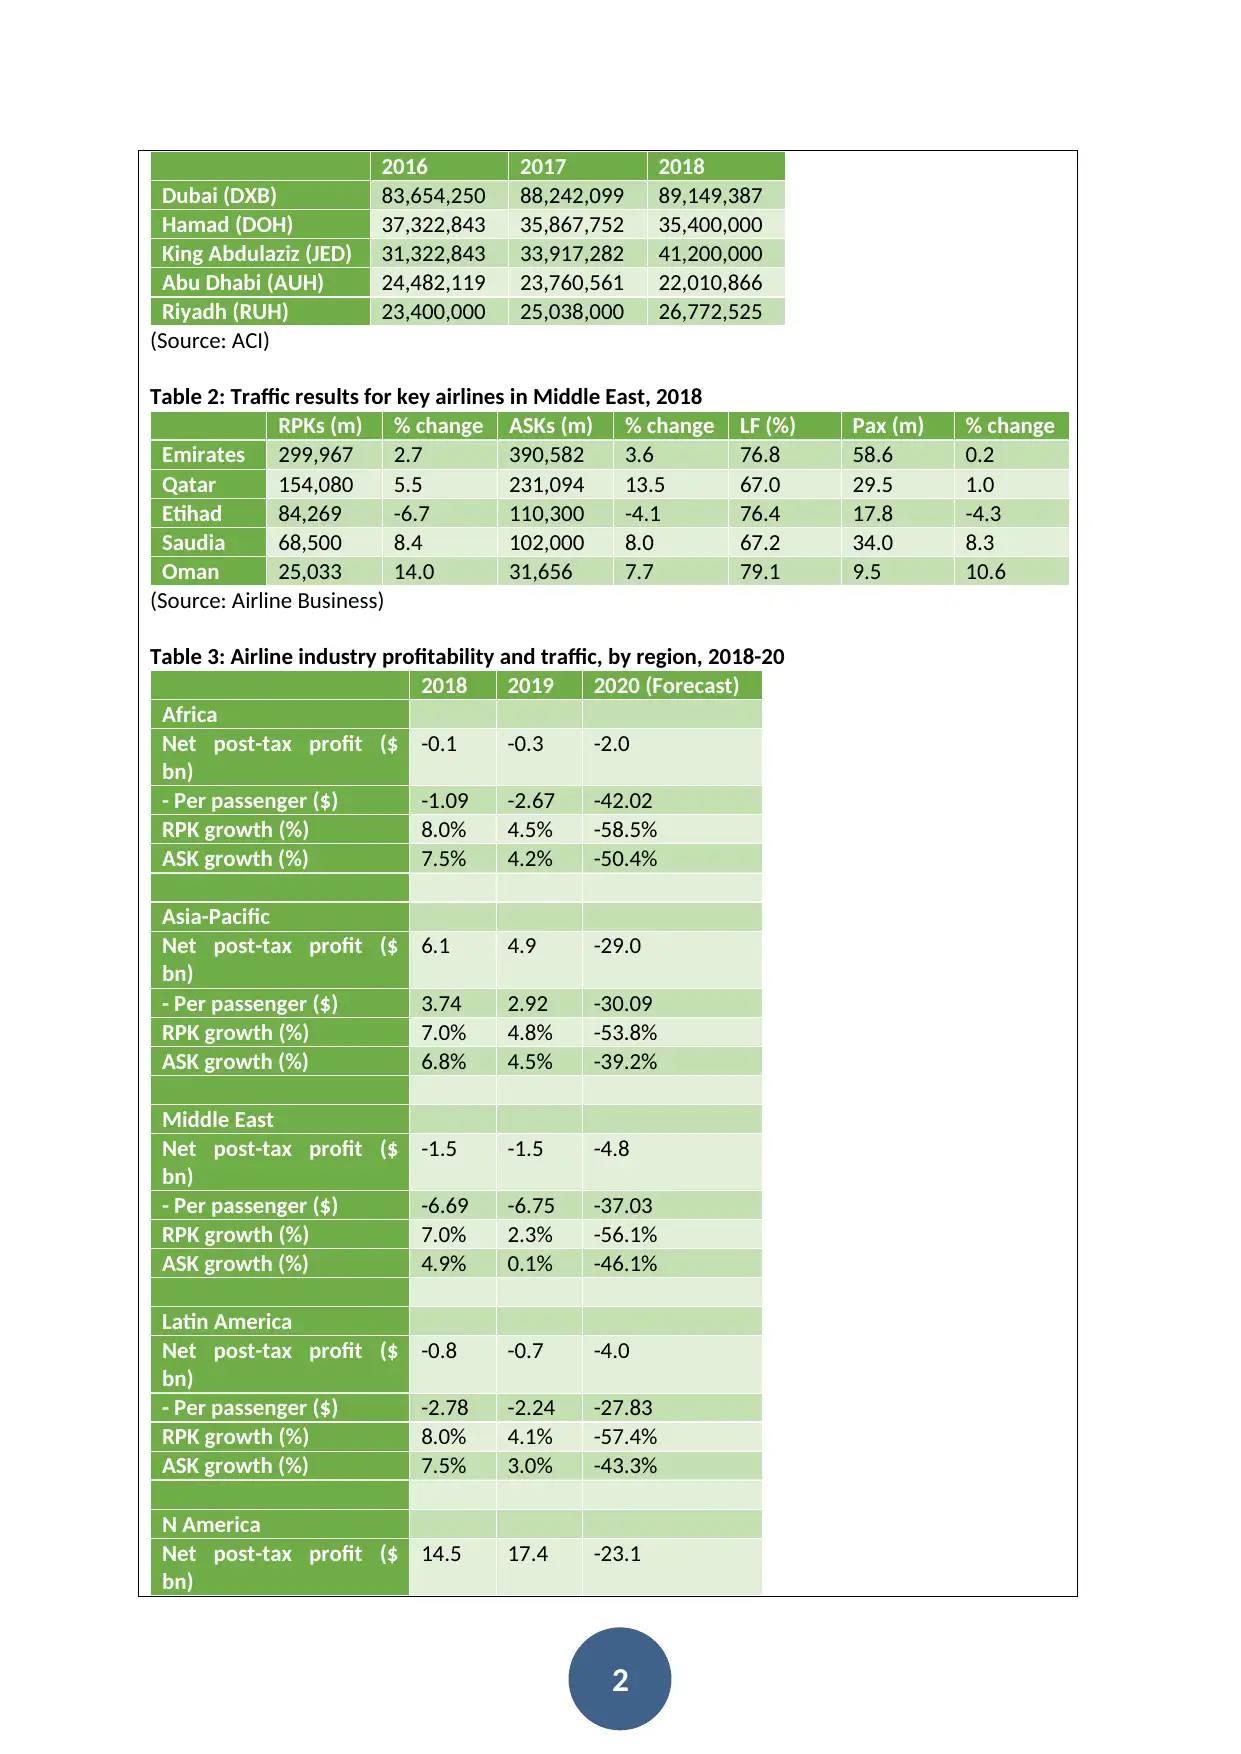
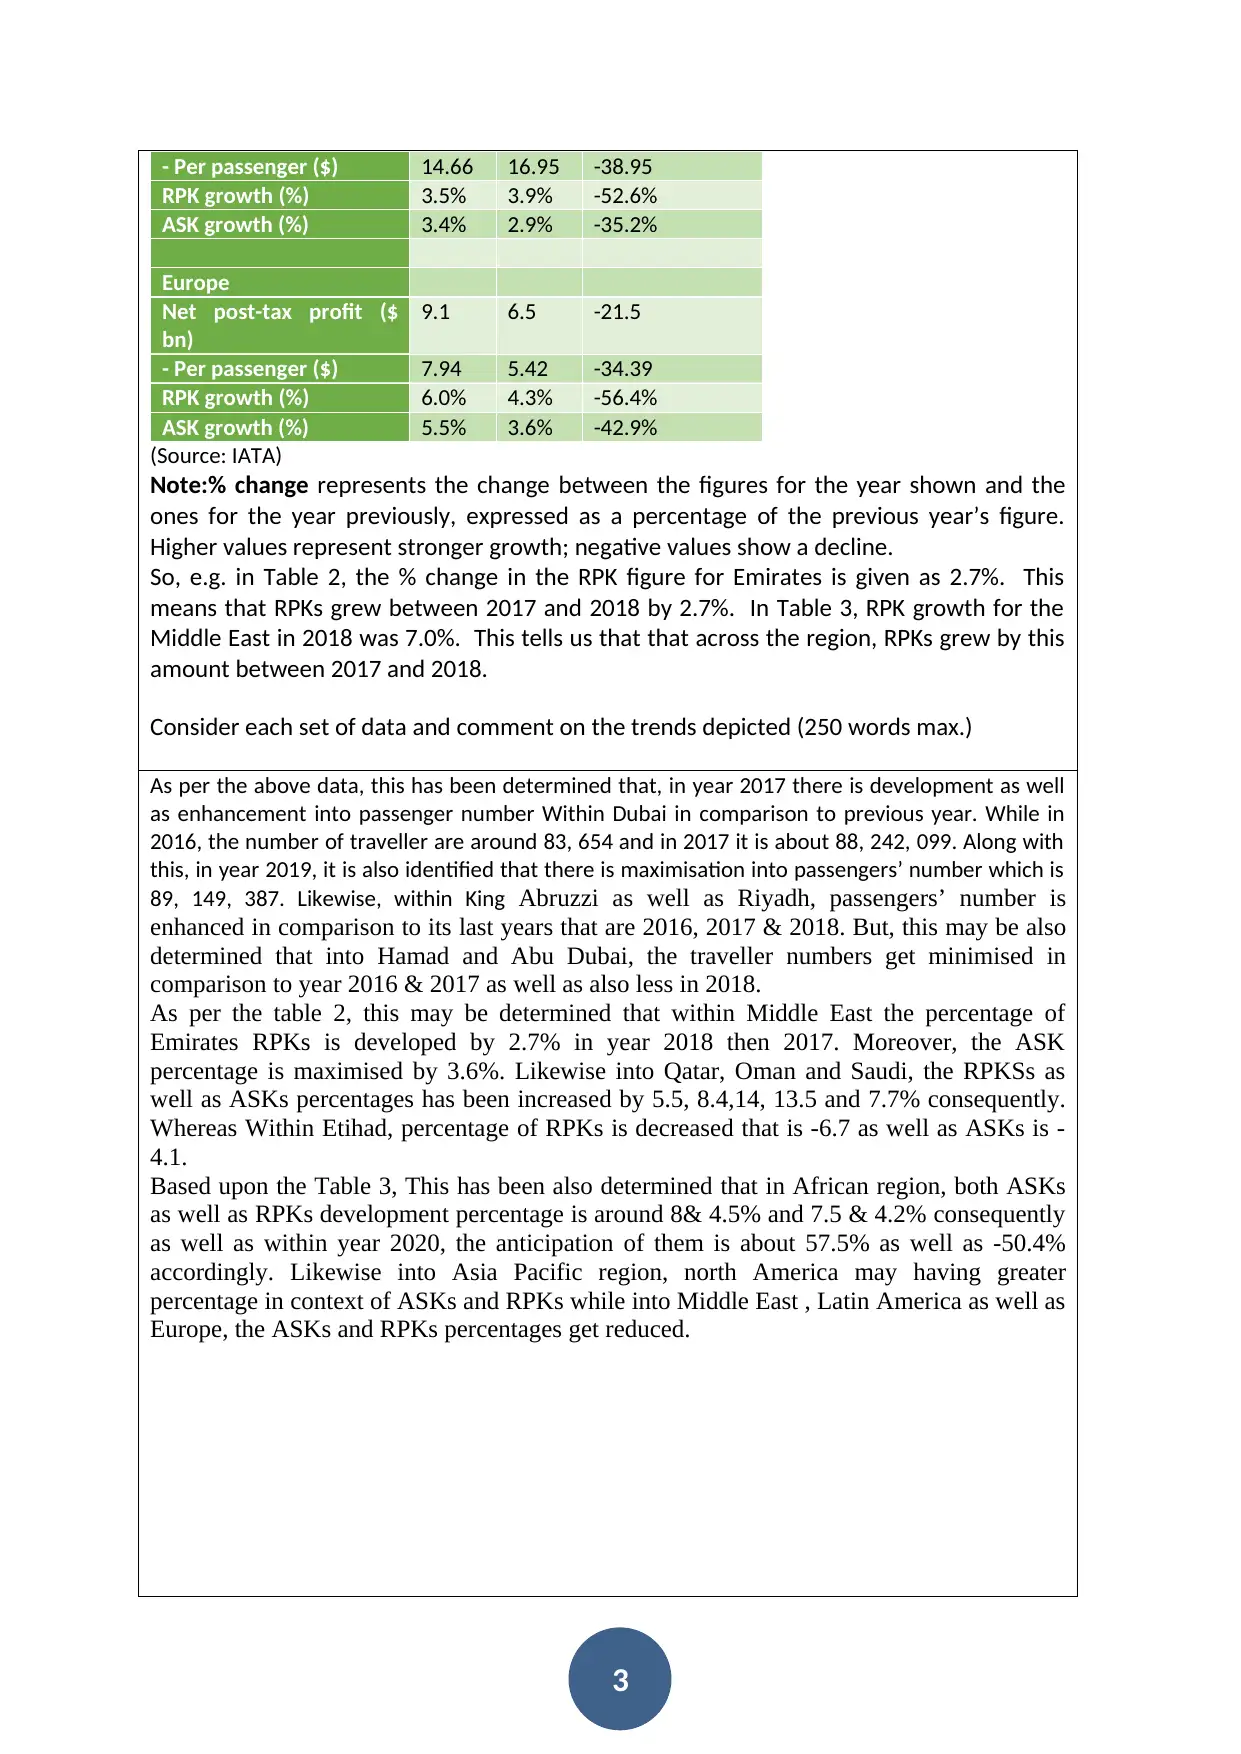
As per the above data, this has been determined that, in year 2017 there is development as well
as enhancement into passenger number Within Dubai in comparison to previous year. While in
2016, the number of traveller are around 83, 654 and in 2017 it is about 88, 242, 099. Along with
this, in year 2019, it is also identified that there is maximisation into passengers’ number which is
89, 149, 387. Likewise, within King Abruzzi as well as Riyadh, passengers’ number is
enhanced in comparison to its last years that are 2016, 2017 & 2018. But, this may be also
determined that into Hamad and Abu Dubai, the traveller numbers get minimised in
comparison to year 2016 & 2017 as well as also less in 2018.
As per the table 2, this may be determined that within Middle East the percentage of
Emirates RPKs is developed by 2.7% in year 2018 then 2017. Moreover, the ASK
percentage is maximised by 3.6%. Likewise into Qatar, Oman and Saudi, the RPKSs as
well as ASKs percentages has been increased by 5.5, 8.4,14, 13.5 and 7.7% consequently.
Whereas Within Etihad, percentage of RPKs is decreased that is -6.7 as well as ASKs is -
4.1.
Based upon the Table 3, This has been also determined that in African region, both ASKs
as well as RPKs development percentage is around 8& 4.5% and 7.5 & 4.2% consequently
as well as within year 2020, the anticipation of them is about 57.5% as well as -50.4%
accordingly. Likewise into Asia Pacific region, north America may having greater
percentage in context of ASKs and RPKs while into Middle East , Latin America as well as
Europe, the ASKs and RPKs percentages get reduced.
- Per passenger ($) 14.66 16.95 -38.95
RPK growth (%) 3.5% 3.9% -52.6%
ASK growth (%) 3.4% 2.9% -35.2%
Europe
Net post-tax profit ($
bn)
9.1 6.5 -21.5
- Per passenger ($) 7.94 5.42 -34.39
RPK growth (%) 6.0% 4.3% -56.4%
ASK growth (%) 5.5% 3.6% -42.9%
(Source: IATA)
Note:% change represents the change between the figures for the year shown and the
ones for the year previously, expressed as a percentage of the previous year’s figure.
Higher values represent stronger growth; negative values show a decline.
So, e.g. in Table 2, the % change in the RPK figure for Emirates is given as 2.7%. This
means that RPKs grew between 2017 and 2018 by 2.7%. In Table 3, RPK growth for the
Middle East in 2018 was 7.0%. This tells us that that across the region, RPKs grew by this
amount between 2017 and 2018.
Consider each set of data and comment on the trends depicted (250 words max.)
As per the above data, this has been determined that, in year 2017 there is development as well
as enhancement into passenger number Within Dubai in comparison to previous year. While in
2016, the number of traveller are around 83, 654 and in 2017 it is about 88, 242, 099. Along with
this, in year 2019, it is also identified that there is maximisation into passengers’ number which is
89, 149, 387. Likewise, within King Abruzzi as well as Riyadh, passengers’ number is
enhanced in comparison to its last years that are 2016, 2017 & 2018. But, this may be also
determined that into Hamad and Abu Dubai, the traveller numbers get minimised in
comparison to year 2016 & 2017 as well as also less in 2018.
As per the table 2, this may be determined that within Middle East the percentage of
Emirates RPKs is developed by 2.7% in year 2018 then 2017. Moreover, the ASK
percentage is maximised by 3.6%. Likewise into Qatar, Oman and Saudi, the RPKSs as
well as ASKs percentages has been increased by 5.5, 8.4,14, 13.5 and 7.7% consequently.
Whereas Within Etihad, percentage of RPKs is decreased that is -6.7 as well as ASKs is -
4.1.
Based upon the Table 3, This has been also determined that in African region, both ASKs
as well as RPKs development percentage is around 8& 4.5% and 7.5 & 4.2% consequently
as well as within year 2020, the anticipation of them is about 57.5% as well as -50.4%
accordingly. Likewise into Asia Pacific region, north America may having greater
percentage in context of ASKs and RPKs while into Middle East , Latin America as well as
Europe, the ASKs and RPKs percentages get reduced.
⊘ This is a preview!⊘
Do you want full access?
Subscribe today to unlock all pages.
Trusted by 1+ million students worldwide
4
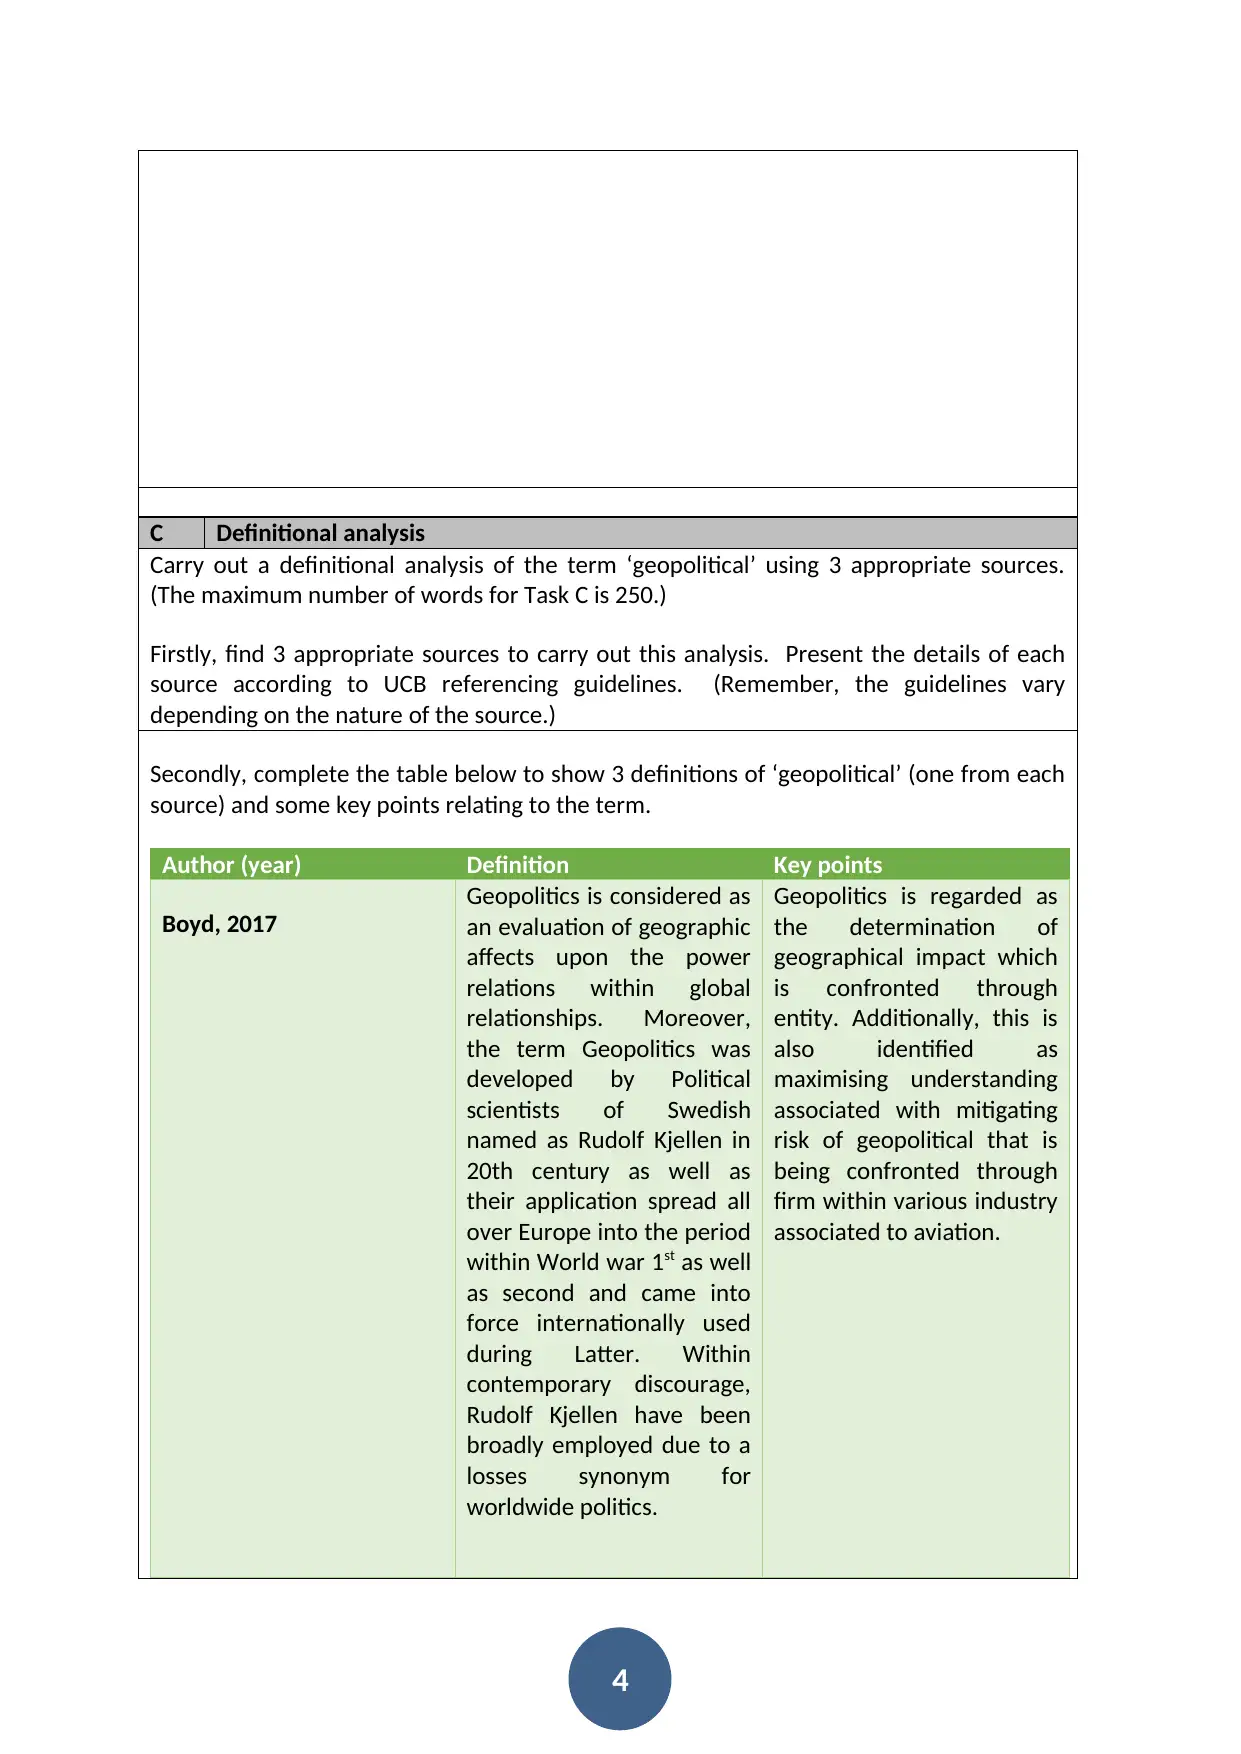
C Definitional analysis
Carry out a definitional analysis of the term ‘geopolitical’ using 3 appropriate sources.
(The maximum number of words for Task C is 250.)
Firstly, find 3 appropriate sources to carry out this analysis. Present the details of each
source according to UCB referencing guidelines. (Remember, the guidelines vary
depending on the nature of the source.)
Secondly, complete the table below to show 3 definitions of ‘geopolitical’ (one from each
source) and some key points relating to the term.
Author (year) Definition Key points
Boyd, 2017
Geopolitics is considered as
an evaluation of geographic
affects upon the power
relations within global
relationships. Moreover,
the term Geopolitics was
developed by Political
scientists of Swedish
named as Rudolf Kjellen in
20th century as well as
their application spread all
over Europe into the period
within World war 1st as well
as second and came into
force internationally used
during Latter. Within
contemporary discourage,
Rudolf Kjellen have been
broadly employed due to a
losses synonym for
worldwide politics.
Geopolitics is regarded as
the determination of
geographical impact which
is confronted through
entity. Additionally, this is
also identified as
maximising understanding
associated with mitigating
risk of geopolitical that is
being confronted through
firm within various industry
associated to aviation.
Paraphrase This Document
Need a fresh take? Get an instant paraphrase of this document with our AI Paraphraser
5
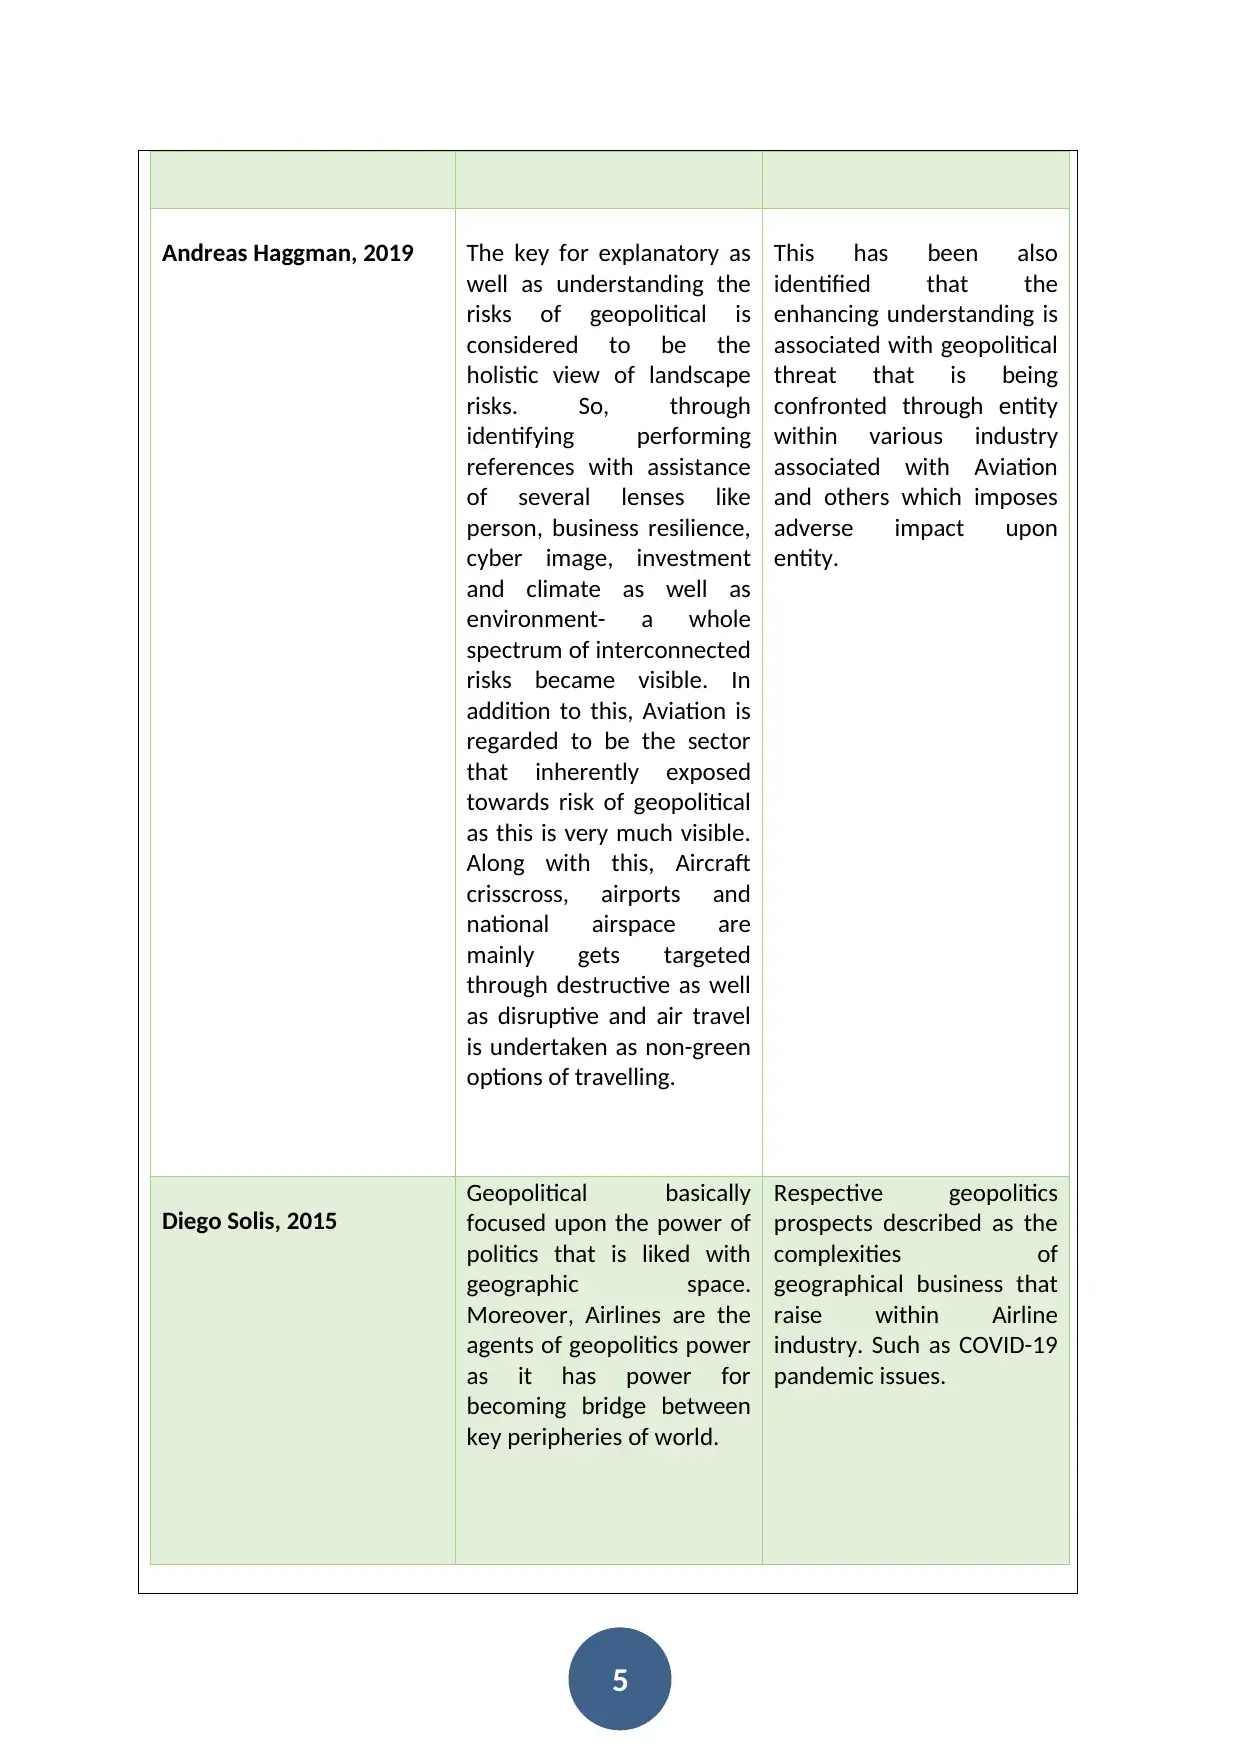
Andreas Haggman, 2019 The key for explanatory as
well as understanding the
risks of geopolitical is
considered to be the
holistic view of landscape
risks. So, through
identifying performing
references with assistance
of several lenses like
person, business resilience,
cyber image, investment
and climate as well as
environment- a whole
spectrum of interconnected
risks became visible. In
addition to this, Aviation is
regarded to be the sector
that inherently exposed
towards risk of geopolitical
as this is very much visible.
Along with this, Aircraft
crisscross, airports and
national airspace are
mainly gets targeted
through destructive as well
as disruptive and air travel
is undertaken as non-green
options of travelling.
This has been also
identified that the
enhancing understanding is
associated with geopolitical
threat that is being
confronted through entity
within various industry
associated with Aviation
and others which imposes
adverse impact upon
entity.
Diego Solis, 2015
Geopolitical basically
focused upon the power of
politics that is liked with
geographic space.
Moreover, Airlines are the
agents of geopolitics power
as it has power for
becoming bridge between
key peripheries of world.
Respective geopolitics
prospects described as the
complexities of
geographical business that
raise within Airline
industry. Such as COVID-19
pandemic issues.
6
And finally, construct your own definition of ‘geopolitical’. Present this below:
Geopolitical is defined as the aspects of geographical treats as well as risk that are tackle
through entity industry such as Aviation and others. Impact of these difficulties firm’s
business is effected is adverse way in respect of profit, sales as well as market shares.
Such as COVID- 19 can be undertaken as one of the crucial problem due to which British
airline business get impacted unfavourably as in corona virus, the situation of crisis occurs
across whole world and also they have to be suffered from lockdown conditions as well as
individuals did not able to travel due to which their revenue as well as sales get minimised
that develop an adverse impact. In addition to this, the staff of various firm are also gets
suffered from this unfavourably as they have to lose their jobs.
D Media Analysis
Carry out a media analysis of the organisation using a range of suitable sources to
determine how it has been affected by the crisis.
The purpose of this analysis is to determine how your chosen organisation has been
affected by the crisis according to the media selected. Find two sources to use as the
basis of the analysis. Find a range of source types as coverage will vary across different
media. Important questions to ask yourself here include:
Coverage – what does this tell you about the crisis and the organisation
concerned?
Bias – is the coverage subjective (opinion based) or objective (factual)?
How has the organisation been affected by the crisis?
The overall word limit for this task is 600 words max.
Firstly, complete the table below to determine the nature of the coverage of the
organisation:
Source & year Type of media Headline Coverage Evidence of
⊘ This is a preview!⊘
Do you want full access?
Subscribe today to unlock all pages.
Trusted by 1+ million students worldwide
7
bias?
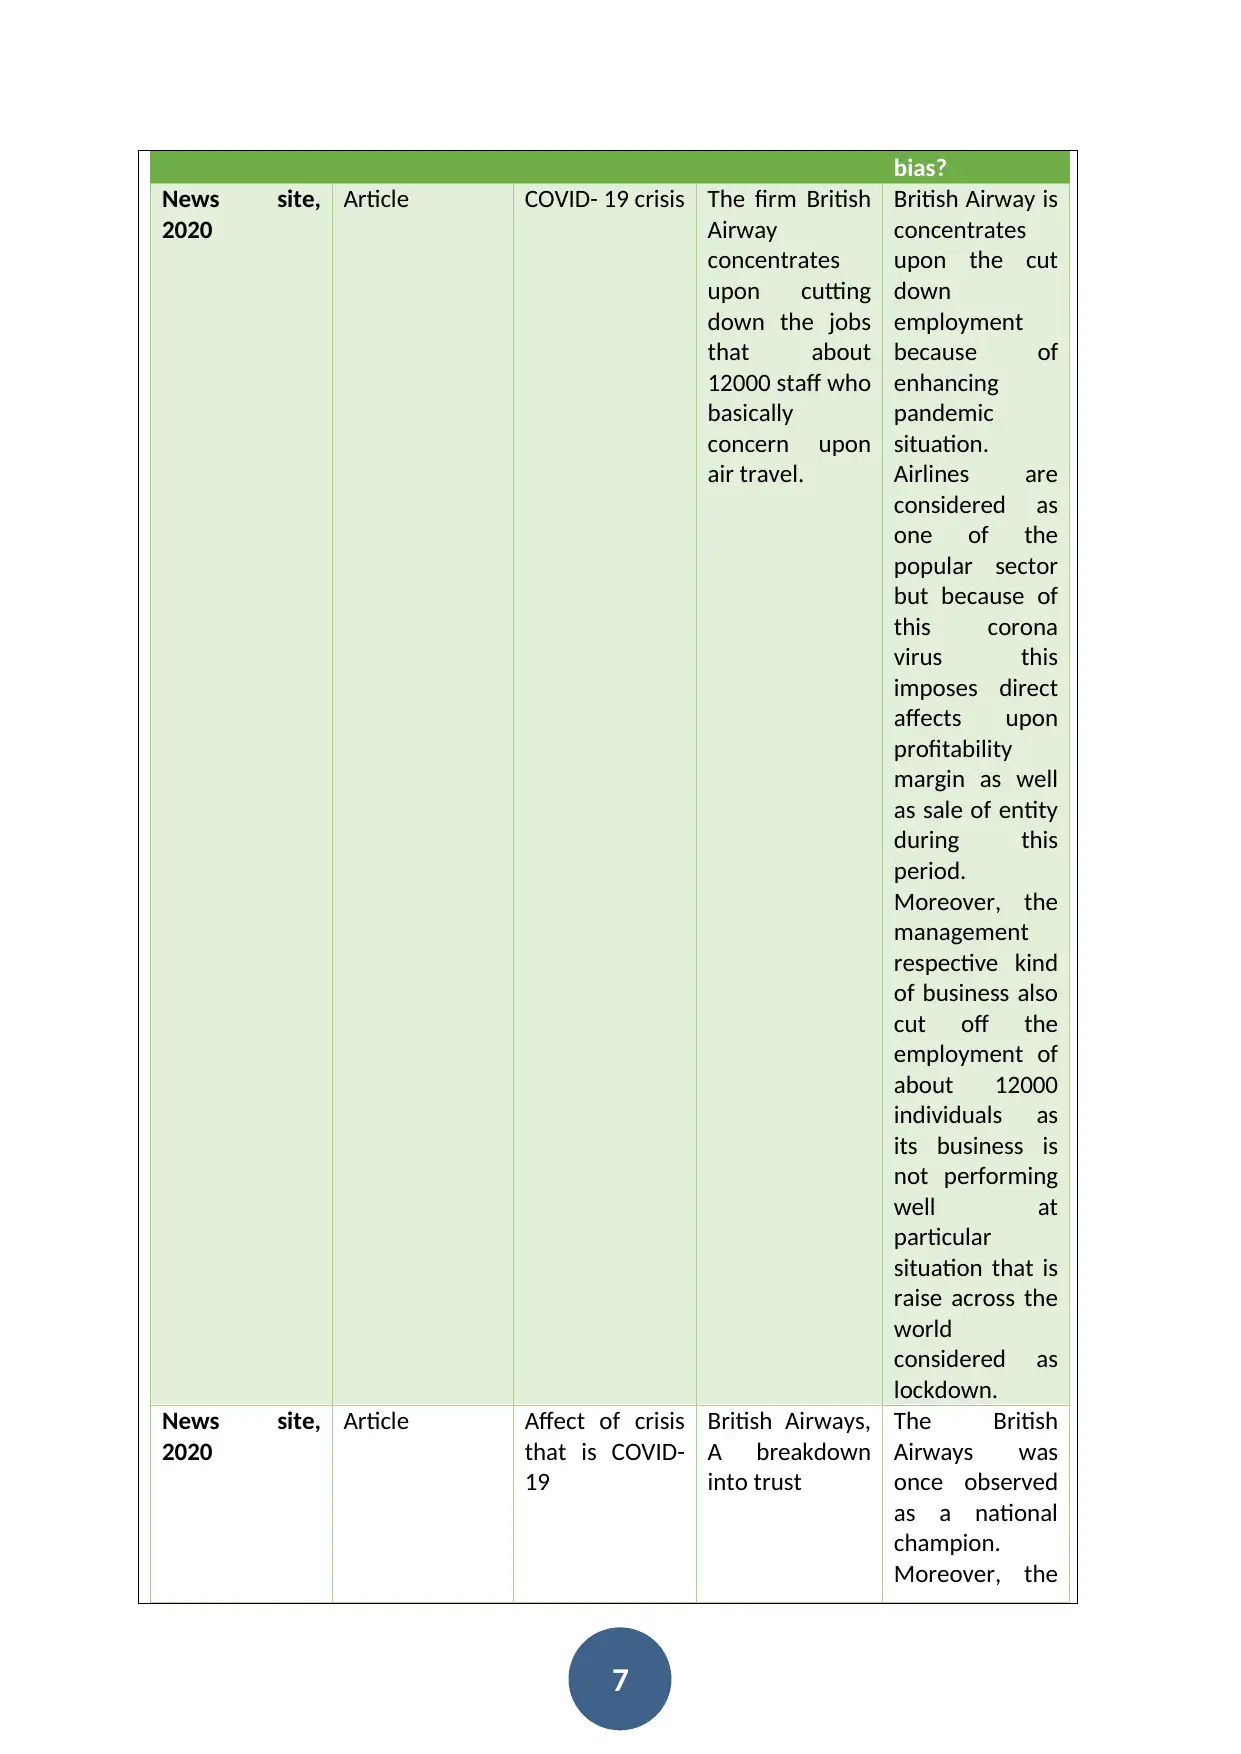
News site,
2020
Article COVID- 19 crisis The firm British
Airway
concentrates
upon cutting
down the jobs
that about
12000 staff who
basically
concern upon
air travel.
British Airway is
concentrates
upon the cut
down
employment
because of
enhancing
pandemic
situation.
Airlines are
considered as
one of the
popular sector
but because of
this corona
virus this
imposes direct
affects upon
profitability
margin as well
as sale of entity
during this
period.
Moreover, the
management
respective kind
of business also
cut off the
employment of
about 12000
individuals as
its business is
not performing
well at
particular
situation that is
raise across the
world
considered as
lockdown.
News site,
2020
Article Affect of crisis
that is COVID-
19
British Airways,
A breakdown
into trust
The British
Airways was
once observed
as a national
champion.
Moreover, the
bias?
News site,
2020
Article COVID- 19 crisis The firm British
Airway
concentrates
upon cutting
down the jobs
that about
12000 staff who
basically
concern upon
air travel.
British Airway is
concentrates
upon the cut
down
employment
because of
enhancing
pandemic
situation.
Airlines are
considered as
one of the
popular sector
but because of
this corona
virus this
imposes direct
affects upon
profitability
margin as well
as sale of entity
during this
period.
Moreover, the
management
respective kind
of business also
cut off the
employment of
about 12000
individuals as
its business is
not performing
well at
particular
situation that is
raise across the
world
considered as
lockdown.
News site,
2020
Article Affect of crisis
that is COVID-
19
British Airways,
A breakdown
into trust
The British
Airways was
once observed
as a national
champion.
Moreover, the
Paraphrase This Document
Need a fresh take? Get an instant paraphrase of this document with our AI Paraphraser
8
airline symbol
which
concentrates
upon British
Airline
strengths. At
current period,
the firm
concentrates
upon to deal
and face corona
virus for coping
up with all
challenges that
are faced
through them
because of
COVID-19. In
addition to this,
the relations
within entity as
well as
government are
broken as well
as disputes with
their staff. Also,
there is not any
question with
respective such
as other airline
have been get
influenced by
lockdown as
well as closure
of brooders
associated with
pandemic.
Moreover
because of this
issues, the
whole entity
get impacted
adversely in
context of staff
turnover
minimisation
into consume
9
base as well as
reduction in
profit.
Secondly,explain how the organisation has been affected by the crisis?
The crisis of COVID- 19 has impacted the whole business adversely. Moreover, the British
Airways that is developed by global consolidated Airlines group. However, the entity seek
forward for performing much flight upon fuel effectual as well as modern aircraft under
taken their new A350s as well as A787 as. In addition to this, the air carrier firm also
observed that their anticipated aircraft like A787s and A350s would aids them to
accomplish net zero emission by the year of 2050. Additionally, the restructuring waves
get activated through the outbreaks of virus and also this hit airline as well as industrial
firms all over the world adversely. But, the continuous spread of COVID-19 AS WELL AS
THE RESTRICTIONS Into subsequent travelling into across the world develop the changes
into their plans as well as badly the aircraft would shortly be considered as their final
resting areas. Also, because of this particular crisis, entity lay off their staff as well as also
cuts off their various flights in number due to which their business get impacted
adversely. Apart from this, the firm’s productivity get influenced in pessimistic term, their
sales is reduced as well as also get impacted the revenues and base of consumers in
unenthusiastic way.
⊘ This is a preview!⊘
Do you want full access?
Subscribe today to unlock all pages.
Trusted by 1+ million students worldwide

10
Paraphrase This Document
Need a fresh take? Get an instant paraphrase of this document with our AI Paraphraser
11
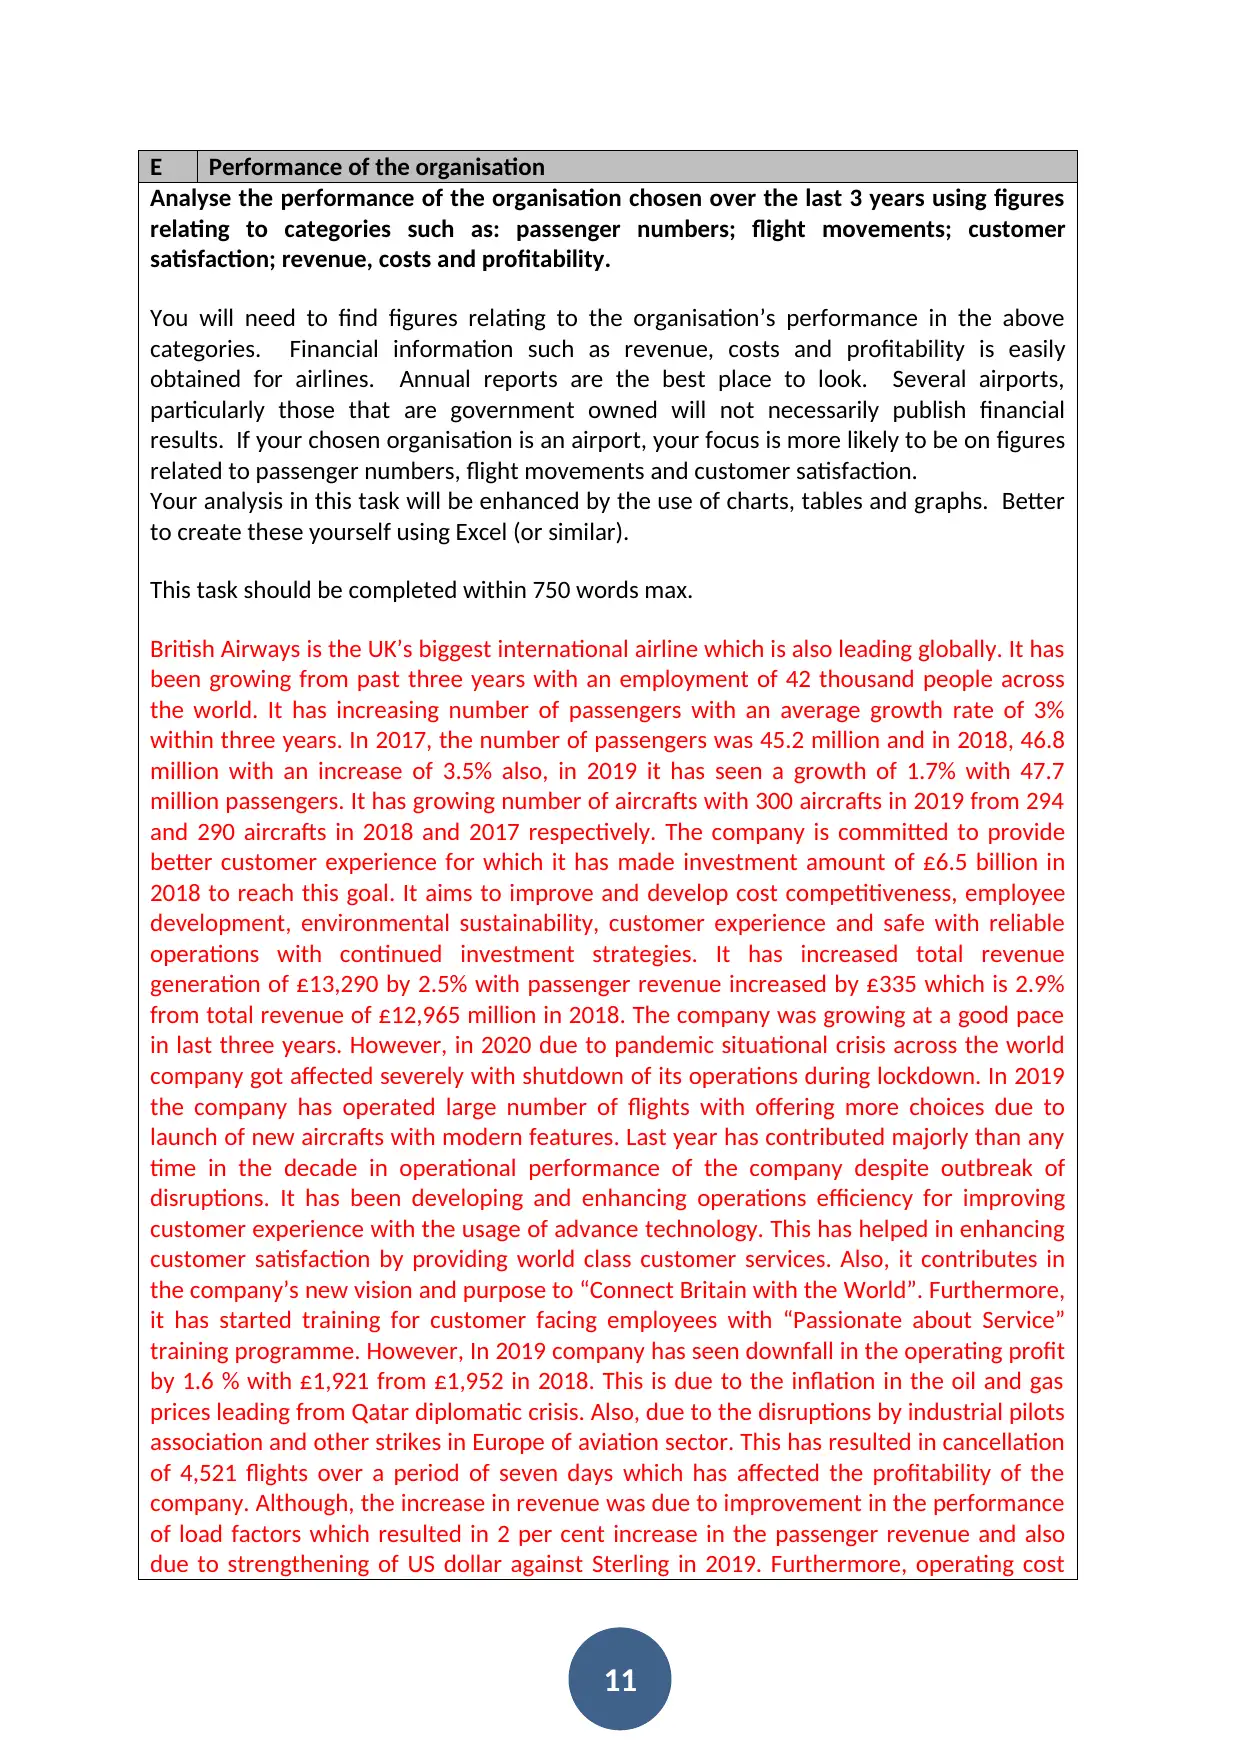
E Performance of the organisation
Analyse the performance of the organisation chosen over the last 3 years using figures
relating to categories such as: passenger numbers; flight movements; customer
satisfaction; revenue, costs and profitability.
You will need to find figures relating to the organisation’s performance in the above
categories. Financial information such as revenue, costs and profitability is easily
obtained for airlines. Annual reports are the best place to look. Several airports,
particularly those that are government owned will not necessarily publish financial
results. If your chosen organisation is an airport, your focus is more likely to be on figures
related to passenger numbers, flight movements and customer satisfaction.
Your analysis in this task will be enhanced by the use of charts, tables and graphs. Better
to create these yourself using Excel (or similar).
This task should be completed within 750 words max.
British Airways is the UK’s biggest international airline which is also leading globally. It has
been growing from past three years with an employment of 42 thousand people across
the world. It has increasing number of passengers with an average growth rate of 3%
within three years. In 2017, the number of passengers was 45.2 million and in 2018, 46.8
million with an increase of 3.5% also, in 2019 it has seen a growth of 1.7% with 47.7
million passengers. It has growing number of aircrafts with 300 aircrafts in 2019 from 294
and 290 aircrafts in 2018 and 2017 respectively. The company is committed to provide
better customer experience for which it has made investment amount of £6.5 billion in
2018 to reach this goal. It aims to improve and develop cost competitiveness, employee
development, environmental sustainability, customer experience and safe with reliable
operations with continued investment strategies. It has increased total revenue
generation of £13,290 by 2.5% with passenger revenue increased by £335 which is 2.9%
from total revenue of £12,965 million in 2018. The company was growing at a good pace
in last three years. However, in 2020 due to pandemic situational crisis across the world
company got affected severely with shutdown of its operations during lockdown. In 2019
the company has operated large number of flights with offering more choices due to
launch of new aircrafts with modern features. Last year has contributed majorly than any
time in the decade in operational performance of the company despite outbreak of
disruptions. It has been developing and enhancing operations efficiency for improving
customer experience with the usage of advance technology. This has helped in enhancing
customer satisfaction by providing world class customer services. Also, it contributes in
the company’s new vision and purpose to “Connect Britain with the World”. Furthermore,
it has started training for customer facing employees with “Passionate about Service”
training programme. However, In 2019 company has seen downfall in the operating profit
by 1.6 % with £1,921 from £1,952 in 2018. This is due to the inflation in the oil and gas
prices leading from Qatar diplomatic crisis. Also, due to the disruptions by industrial pilots
association and other strikes in Europe of aviation sector. This has resulted in cancellation
of 4,521 flights over a period of seven days which has affected the profitability of the
company. Although, the increase in revenue was due to improvement in the performance
of load factors which resulted in 2 per cent increase in the passenger revenue and also
due to strengthening of US dollar against Sterling in 2019. Furthermore, operating cost
12
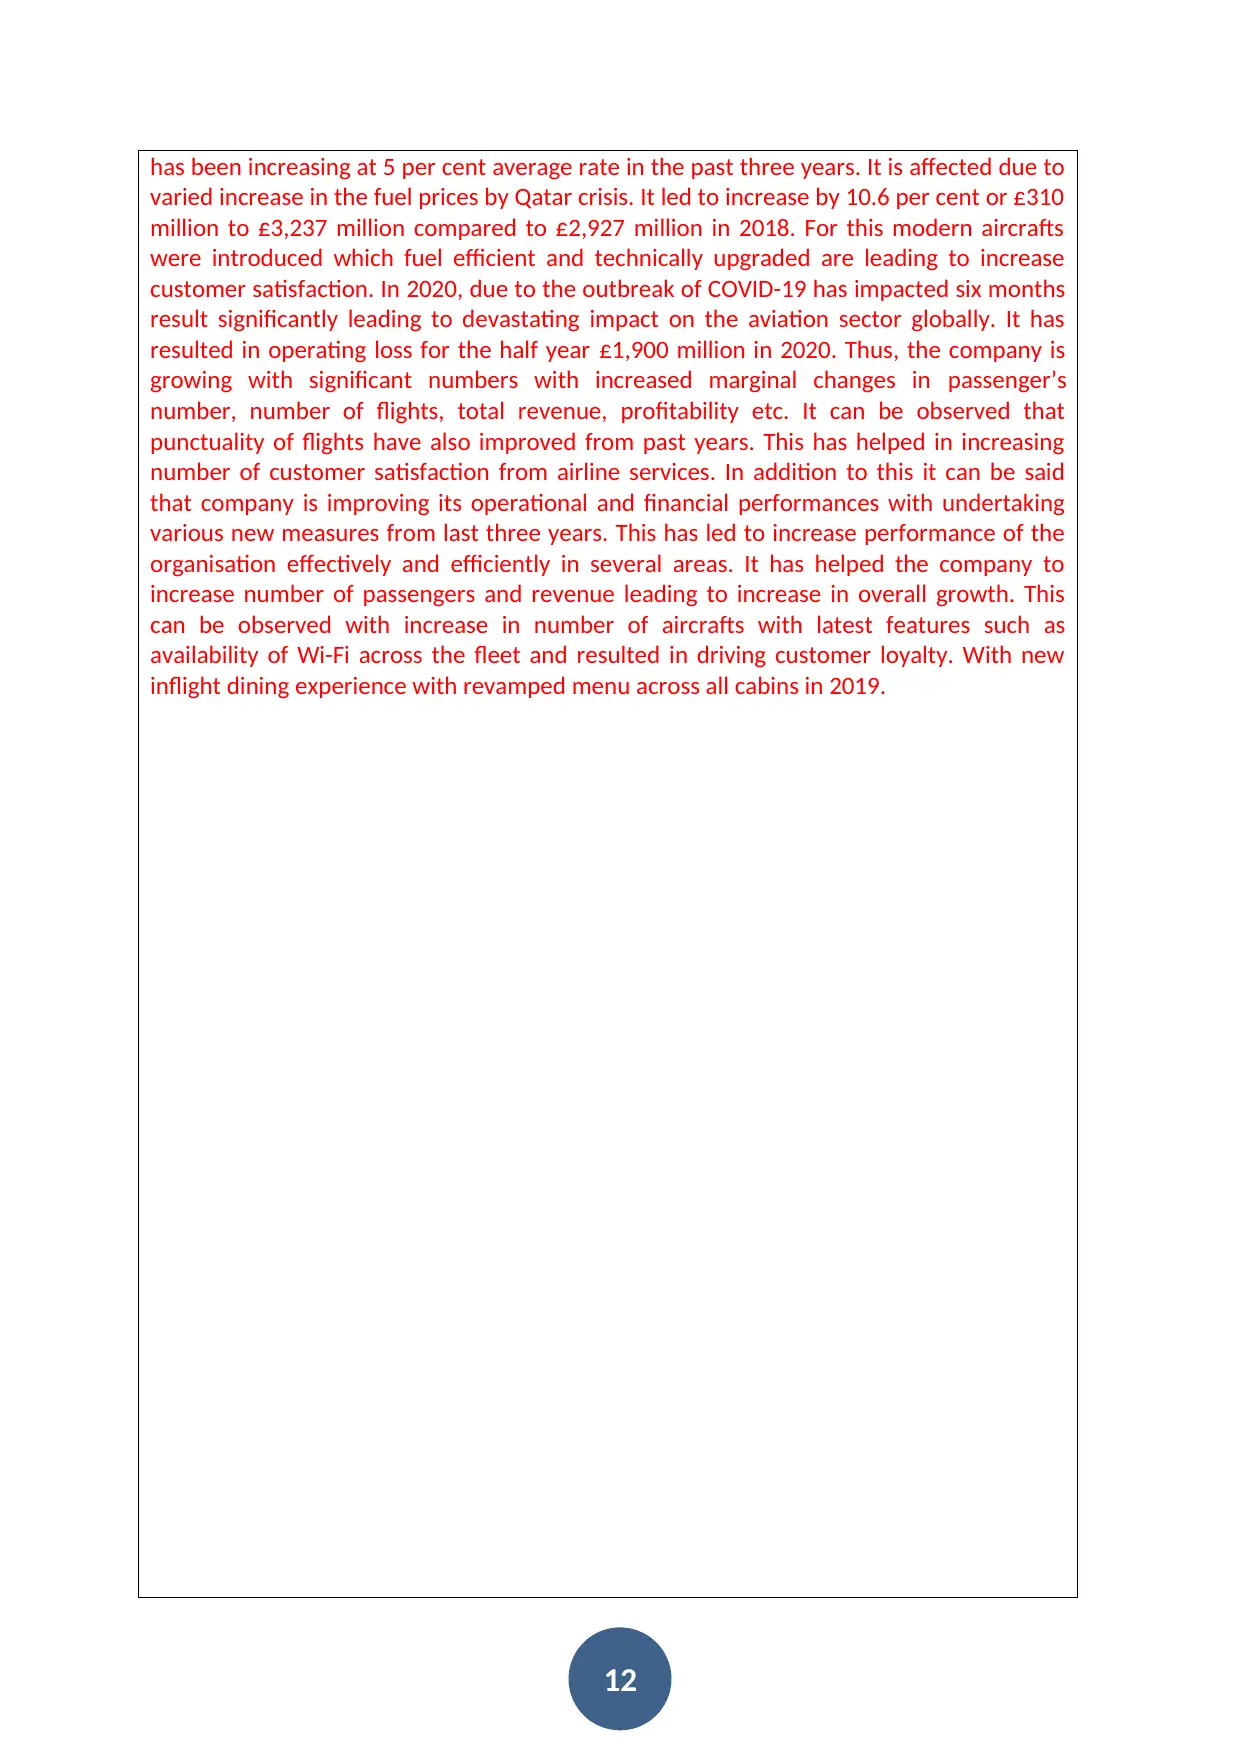
has been increasing at 5 per cent average rate in the past three years. It is affected due to
varied increase in the fuel prices by Qatar crisis. It led to increase by 10.6 per cent or £310
million to £3,237 million compared to £2,927 million in 2018. For this modern aircrafts
were introduced which fuel efficient and technically upgraded are leading to increase
customer satisfaction. In 2020, due to the outbreak of COVID-19 has impacted six months
result significantly leading to devastating impact on the aviation sector globally. It has
resulted in operating loss for the half year £1,900 million in 2020. Thus, the company is
growing with significant numbers with increased marginal changes in passenger’s
number, number of flights, total revenue, profitability etc. It can be observed that
punctuality of flights have also improved from past years. This has helped in increasing
number of customer satisfaction from airline services. In addition to this it can be said
that company is improving its operational and financial performances with undertaking
various new measures from last three years. This has led to increase performance of the
organisation effectively and efficiently in several areas. It has helped the company to
increase number of passengers and revenue leading to increase in overall growth. This
can be observed with increase in number of aircrafts with latest features such as
availability of Wi-Fi across the fleet and resulted in driving customer loyalty. With new
inflight dining experience with revamped menu across all cabins in 2019.
⊘ This is a preview!⊘
Do you want full access?
Subscribe today to unlock all pages.
Trusted by 1+ million students worldwide
1 out of 16
Related Documents


Your All-in-One AI-Powered Toolkit for Academic Success.
+13062052269
info@desklib.com
Available 24*7 on WhatsApp / Email
![[object Object]](/_next/static/media/star-bottom.7253800d.svg)
Unlock your academic potential
Copyright © 2020–2026 A2Z Services. All Rights Reserved. Developed and managed by ZUCOL.