Machine Learning Models for Banks' Early Warning Indicators
VerifiedAdded on 2023/06/15
|16
|6475
|185
Report
AI Summary
This report explores the use of supervised machine learning models to provide banks with early warnings of liquidity stress using market-based indicators. By transforming market stress into a classification problem, the study utilizes publicly available data from 2007 to 2021, encompassing the 2007-2008 Global Financial Crisis and the COVID-19 crisis, to train the models. The St. Louis Fed Financial Stress Index is used to define market stress levels, assigning a red-amber-green (RAG) status to each trading day to identify risk levels. An ensemble model with a random under-sampling boosting algorithm (RUSBoost) is employed to address the challenge of imbalanced data due to the limited number of "red" status days. Initial results demonstrate the model's ability to predict 83% of "red" risk days, with back-testing during the COVID-19 crisis triggering "amber" and "red" statuses as the crisis unfolded, showcasing the potential for enhanced bank risk management.
Constructing Early Warning Indicators for the Banks Using Machine
Learning Models
a
Abstract:
This work contributes to bank liquidity risk management by applying supervised machine learning
models to provide banks with early warnings of liquidity stress using market base indicators.
Identifying increasing levels of stress as early as possible provides management with a crucial
window of time in which to assess and develop a potential response. In this study, market stress was
transformed into a classification problem. Publicly available data from 2007 to 2021 was used to
train the machine learning model; this period covers two severe stress periods, namely the 2007-
2008 Global Financial Crisis and the COVID-19 crisis. The St. Louis Fed Financial Stress Index
was used to define the level of stress in the market. Each day trading was assigned a red-amber-
green (RAG) status to identify the risk level for that day. Machine learning models were then
applied to predict the RAG status of each day. Due to a significantly limited number of “red” status
days, modelling became more challenging. An ensemble model with a random under-sampling
boosting algorithm (RUSBoost) was used to improve predictions from imbalanced data. Initial
results show the machine learning model used in this study can predict 83% of “red” risk days. The
current version of the developed model has been back-tested using data from the COVID-19 crisis
and it was able to trigger “amber” and “red” statuses as the crisis was unfolding. These findings
show that the ensemble model with the RUSBoost algorithm predicts “red” and “amber” days and
average of 21% more than the average of other machine learning models and can contribute to bank
risk management.
Keywords: Early Warning Indicators, Financial Stress, Machine Learning, Ensemble model,
Liquidity Risk, Crisis Management, Covid-19 Crisis
JEL Codes: C51, C88, G21
a
? Director of Graduate School of Social Sciences, Yildiz Technical University, Turkey
Email: donduran@yildiz.edu.tr ORCID ID: 0000-0001-8514-5513
Disclaimer: The views and opinions expressed in this paper are those of the authors and they do not necessarily
reflect the views of the HSBC Group or Yildiz Technical University. The initial version of this paper presented at the 7 th
International Conference (ICE-TEA Conference) on April 9-11,2021.
Paraphrase This Document
Need a fresh take? Get an instant paraphrase of this document with our AI Paraphraser
1. Introduction
Bank risk management has become more complicated with the evolving regulatory framework
following the 2007-2008 global financial crisis. With increased regulation and advancements in risk
management practices, it is expected banks and the wider financial system will be more resilient to
shocks. However, any new crisis may unfold uniquely which will require management to be on alert
if the market stress level changes unexpectedly.
Banks have adapted to the current relatively complex environment with large costly investments.
Extensive transformation projects have been implemented for systems, reporting, modelling and
governance. The granularity of the risk data produced and reported has thus increased significantly.
Producing and reporting a significant amount of information does not necessarily give all the
answers, however. A few questions remain open on an ongoing basis, e.g. what are the stress levels
in the market, what is the perception of the clients and counterparties for a specific bank’s risk
level, and in the very short term, is there any emerging stress? These questions all need an answer to
define an alert level for any development in the market which may jeopardise banks survival in a
stress environment. For this reason, banks regularly monitor the market and internal bank indicators
to have a view of developing events.
Indicators, providing early detection of developing stress, will be referred to as Early Warning
Indicators (EWIs). It is a standard practice to monitor several indicators with defined thresholds to
inform management stress levels of the market. However, this study will bring a novel way of
looking at these indicators by using supervised machine learning models and transforming them
into a classification problem without creating another stress index.
There are three main motivations behind this study. Firstly, early warning indicators research in the
literature is often focussed on the policymaker perspective, but not the perspective of a bank as an
individual agent in the financial system. Secondly, research using machine learning models to
detect financial stress levels is in its early stages and still developing, therefore the addition of the
Ensemble classifier with a random under sampling algorithm, as applied by this study, will provide
a unique contribution to the field. Lastly, this study focusses on the immediate nature of the warning
based on daily data available publicly, which links real time market data and an institution’s internal
EWIs. This last item is specifically important in the variable selection, since different frequency and
granularity of data is available for the specific institution compared to the policymakers. In addition,
the flexibility of the proposed supervised machine learning model makes it possible to be used in
different markets and by different stakeholders such as investors, regulators, or central banks.
This study is organised as follows: Section 2 contains a review of existing literature; Section 3
provides definitions of and a framework for early warning indicators; Section 4 outlines the data
selected for this study and summarises the data transformation process; Section 5 outlines the
methodology of this study, while Section 6 discusses the results of this study. Section 7 summarises
the findings of the empirical analysis and discusses its policy implications.
2. Literature Review
According to Leo, Sharma and Maddulety (2019) bank in the current era is rapid growth
and development which require firm to pay attention on having significant information regarding
prevailing risk so that higher profitability can be derived. There are several components which can
be assessed by using different kinds of the models of machine learning. It helps in receiving number

of benefits like automation of everything, wide rage of application and scope of improvement. In
against to this, Loisel, Piette and Tsai (2021) depicted that machine learning is one of the crucial
technique that is helpful in assessing particular pattern which gives insights regarding certain
pattern so that set of data can be obtained. It contributes in identifying the crucial aspects which are
helpful in getting additional intelligence so that risk providing factor can be identified and
eliminated. On the other side, Paltrinieri, Comfort and Reniers (2019) articulated that in banking
sector there is need to pay attention on managing risk by adopting appropriate machine learning
method so that significant ability to detect fraud of lending, regulatory compliance, etc. can be
identified.
In the views of Ghorbanzadeh and et.al., (2019) there are number of factors which lead to
threat the smooth functioning of the bank. In order to successfully operate and functioning of the
banking sector it is highly essential for the organization to concentrate on the factors that lead to
hinder performance. It includes factors like credit, operational, market, etc are few factors that has
impact on the business. For having relevant functioning and processing banking sector with help of
machine learning can derive proper information regarding this aspects so that relevant course of
action can be taken to modify performance. On the other side, Bussmann and et.al., (2021) said that
important aspects which lead to influence the functioning of the organization so that moral hazard,
reputation, business, systematic, etc. These component has adverse impact on the functioning of
baking. The main reason behind such course of action includes possibility of high error, data
acquisition and time & space. These are the crucial disadvantages so that appropriate action to take
improvement can become possible. In contrast to this, Kushwaha and et.al., (2020) there are number
of benefits which can be derived by involving, machine learning model in banking activities such as
faster work, mobility of labour, algorithm selection, heavy & delicate work. These advantages tend
to give significant impact on the processing of the organization which allows to greater extent of
efficiency so that objective can be fulfilled.
In the views of Yu and et.al., (2021) exponential growth in the sector can be achieved by
adopting appropriate computing power & data availability so that new opportunities can be derived.
It has three type involve supervised, unsupervised and semi supervised learning. It aids in risk
responding planning, monitoring & control, etc. On the other side, Tripathi and et.al., 2021 there are
several methods which are taken into consideration by organization for overcoming risk
management in turn deep, visual recognition, natural language processing, etc. For handling the
issues like non crucial aspects business is required to pay attention on evaluating this method as
well machine learning does not allow getting proper functioning. On contrast to this, Chen and
Chen (2021)articulated that with machine learning to provide financial services can be done
⊘ This is a preview!⊘
Do you want full access?
Subscribe today to unlock all pages.
Trusted by 1+ million students worldwide
effectively. The main reason behind this is to get the appropriate level of ability to recognize
prevailing financial lacking area. It focuses on receiving competitive advantages include customer
service, accurate bank operations, financial advisor, fraud detecting, compliance with customer
service, etc. On the basis of this, it can be identified that financial advisory with having automated
trading is found to be crucial in overcoming practices so that operating practices without being
explicitly programmed.
According to Khan and Malaika (2021) there are number of actions which can be taken into
practice by the banking sector for having significant improvement action in order to construct
relevant strategy to ensure sustainability. It can be improved by ensuring relevant feature selection,
ensemble learning algorithms, handling missing value, etc. This can be modified by ensuring that
proper application is exerted by avoiding such aspects so that higher customer satisfaction can be
derived. On the other side, Van Greuning and Bratanovic (2020) depicted that risk management for
constructing relevant strategy becomes possible by having automated tedious task like organizing
information, reporting trends, organizing information, etc so that sound decision to plan functioning
for business can become possible. In against to this, Permatasari (2021) stated that classification of
problem is one of the significant action that contribute in achieving the relevant processing so that
higher profitability by eliminating non crucial aspects can become possible. On the basis of the
provided information it can be specified that constructing appropriate policy with help of machine
learning model helps in managing prevailing risk.
3. Early Warning Indicators (EWIs) Definitions and Framework
In this study, EWIs are defined as any data or information used to predict a potential stress event.
This can be numerical or categorical data. Market-based indicators reflect the health of the
economy, bank and firm, and can predict changes in financial conditions (Kliesen & McCracken,
2020).
Examples of EWIs include, but are not limited to, the following:
Market EWIs: These are mainly external data sources such as equity prices, interest rates,
spreads, commodity prices, macroeconomic variables, credit ratings, futures, foreign
exchange rates, policy rates, stock indices, volatility indices, and secured funding spreads.
Internal EWIs: These are bank-specific measures including capital position, deposit
outflows, maturity mismatch, stress test results, bank own credit rating and CDS spread,
credit losses measures, liquidity and funding metrics, market sentiment, share price, funding
spread compare to peers, concentration metrics, negative publicity, and increasing currency
mismatches.
Paraphrase This Document
Need a fresh take? Get an instant paraphrase of this document with our AI Paraphraser

A comprehensive list of Market and Internal EWIs can be seen in Venkat and Baird(2016) chapter 6
(authored by Bruce Choy and Girish Adake) and the BIS (2008) suggested EWIs for liquidity risk.
The following table (Table 1) summarises data asymmetry in the modelling literature on EWIs.
Data asymmetry is important since it defines which EWIs can be used in the modelling depending
on the stakeholders’ perspective. For instance, individual banks cannot build models which include
other banks’ daily risk data, which is only available to the other banks with production frequency
and to the regulator with reporting frequency.
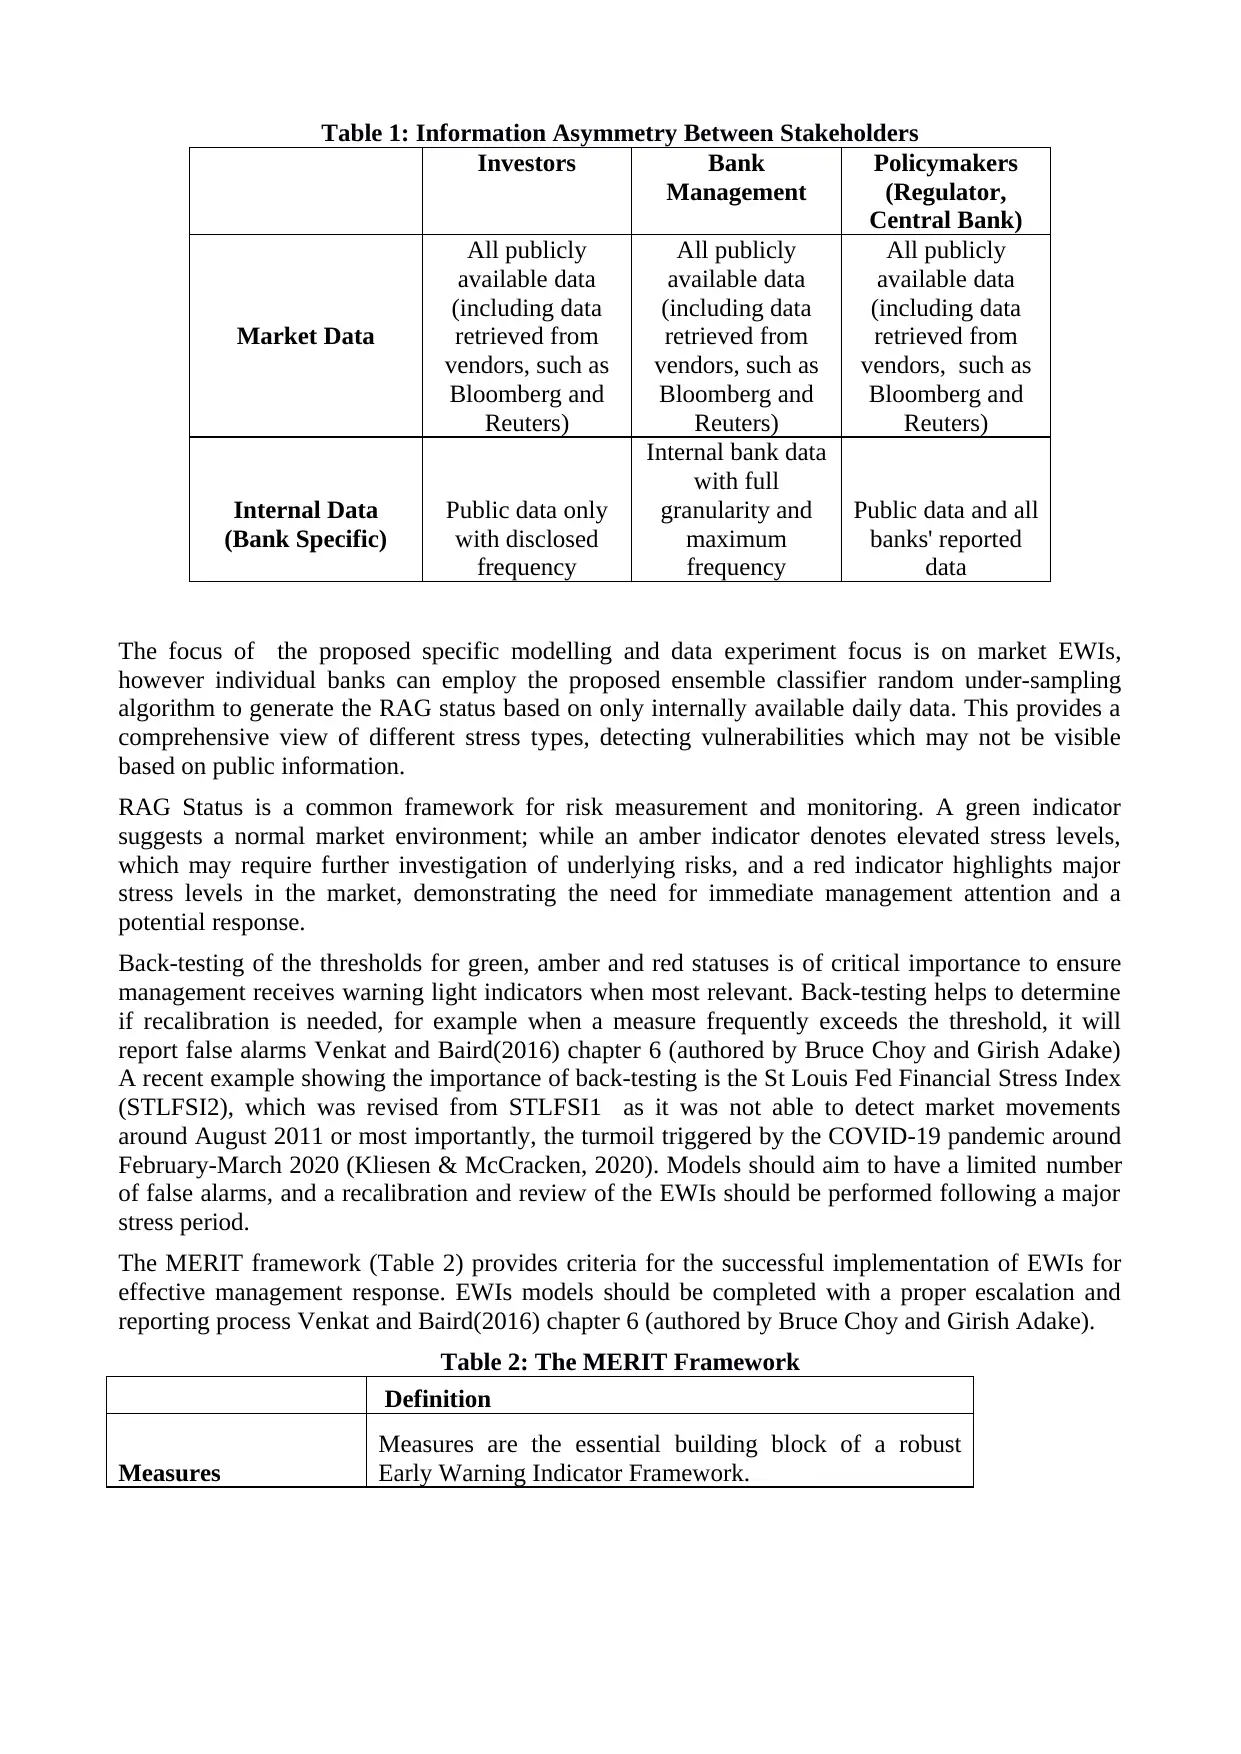
Table 1: Information Asymmetry Between Stakeholders
Investors Bank
Management
Policymakers
(Regulator,
Central Bank)
Market Data
All publicly
available data
(including data
retrieved from
vendors, such as
Bloomberg and
Reuters)
All publicly
available data
(including data
retrieved from
vendors, such as
Bloomberg and
Reuters)
All publicly
available data
(including data
retrieved from
vendors, such as
Bloomberg and
Reuters)
Internal Data
(Bank Specific)
Public data only
with disclosed
frequency
Internal bank data
with full
granularity and
maximum
frequency
Public data and all
banks' reported
data
The focus of the proposed specific modelling and data experiment focus is on market EWIs,
however individual banks can employ the proposed ensemble classifier random under-sampling
algorithm to generate the RAG status based on only internally available daily data. This provides a
comprehensive view of different stress types, detecting vulnerabilities which may not be visible
based on public information.
RAG Status is a common framework for risk measurement and monitoring. A green indicator
suggests a normal market environment; while an amber indicator denotes elevated stress levels,
which may require further investigation of underlying risks, and a red indicator highlights major
stress levels in the market, demonstrating the need for immediate management attention and a
potential response.
Back-testing of the thresholds for green, amber and red statuses is of critical importance to ensure
management receives warning light indicators when most relevant. Back-testing helps to determine
if recalibration is needed, for example when a measure frequently exceeds the threshold, it will
report false alarms Venkat and Baird(2016) chapter 6 (authored by Bruce Choy and Girish Adake)
A recent example showing the importance of back-testing is the St Louis Fed Financial Stress Index
(STLFSI2), which was revised from STLFSI1 as it was not able to detect market movements
around August 2011 or most importantly, the turmoil triggered by the COVID-19 pandemic around
February-March 2020 (Kliesen & McCracken, 2020). Models should aim to have a limited number
of false alarms, and a recalibration and review of the EWIs should be performed following a major
stress period.
The MERIT framework (Table 2) provides criteria for the successful implementation of EWIs for
effective management response. EWIs models should be completed with a proper escalation and
reporting process Venkat and Baird(2016) chapter 6 (authored by Bruce Choy and Girish Adake).
Table 2: The MERIT Framework
Definition
Measures
Measures are the essential building block of a robust
Early Warning Indicator Framework.
⊘ This is a preview!⊘
Do you want full access?
Subscribe today to unlock all pages.
Trusted by 1+ million students worldwide
Escalation
An appropriate escalation framework is essential to
ensure that the EWI framework is embedded in a
management information system. Overall status changes
to Amber or Red should be linked to internal escalation
frameworks for crisis management
Reporting
Timely reporting is required to ensure that escalation can
happen as required. Best practice is to have EWIs
dashboard daily monitored.
Integrated Systems
Appropriate systems and data are required to ensure that
the reporting can be conducted on a timely basis.
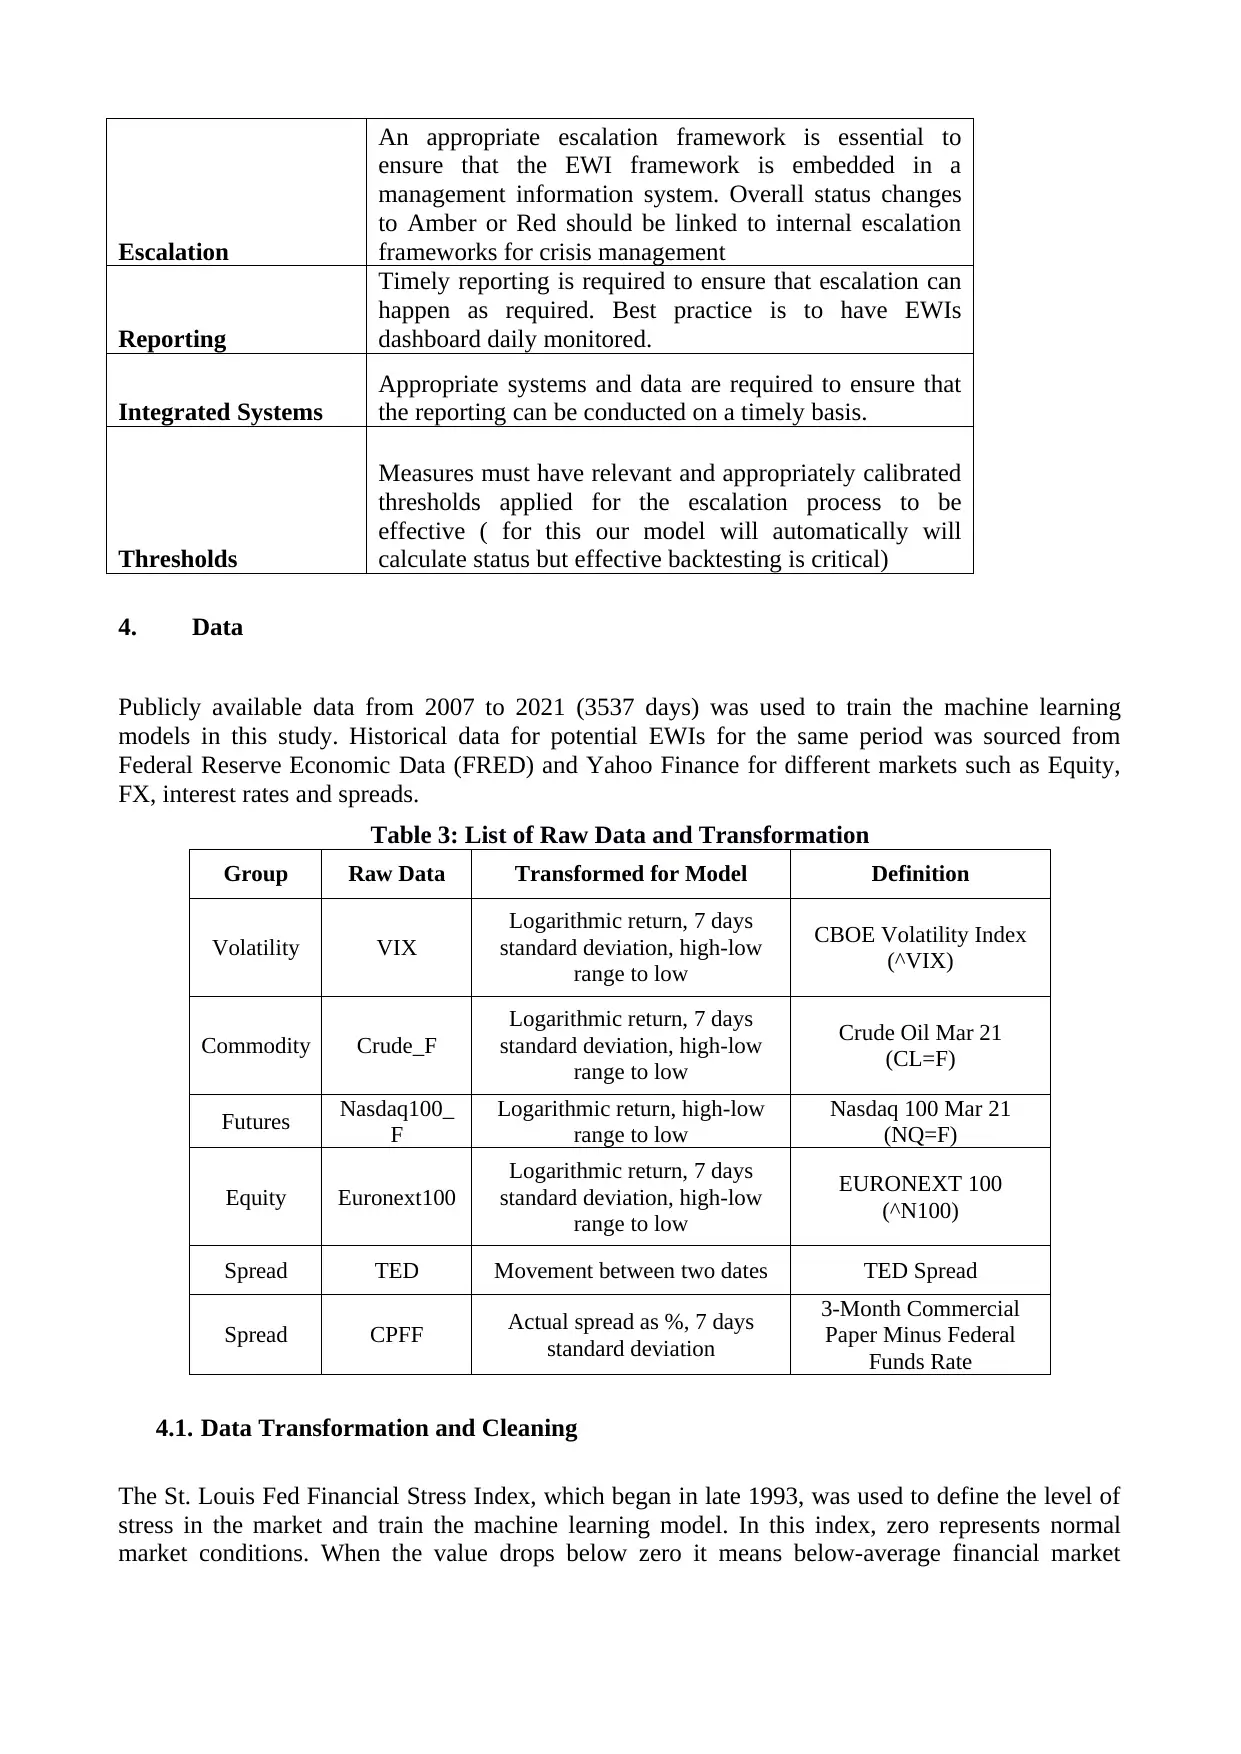
Thresholds
Measures must have relevant and appropriately calibrated
thresholds applied for the escalation process to be
effective ( for this our model will automatically will
calculate status but effective backtesting is critical)
4. Data
Publicly available data from 2007 to 2021 (3537 days) was used to train the machine learning
models in this study. Historical data for potential EWIs for the same period was sourced from
Federal Reserve Economic Data (FRED) and Yahoo Finance for different markets such as Equity,
FX, interest rates and spreads.
Table 3: List of Raw Data and Transformation
Group Raw Data Transformed for Model Definition
Volatility VIX
Logarithmic return, 7 days
standard deviation, high-low
range to low
CBOE Volatility Index
(^VIX)
Commodity Crude_F
Logarithmic return, 7 days
standard deviation, high-low
range to low
Crude Oil Mar 21
(CL=F)
Futures Nasdaq100_
F
Logarithmic return, high-low
range to low
Nasdaq 100 Mar 21
(NQ=F)
Equity Euronext100
Logarithmic return, 7 days
standard deviation, high-low
range to low
EURONEXT 100
(^N100)
Spread TED Movement between two dates TED Spread
Spread CPFF Actual spread as %, 7 days
standard deviation
3-Month Commercial
Paper Minus Federal
Funds Rate
4.1. Data Transformation and Cleaning
The St. Louis Fed Financial Stress Index, which began in late 1993, was used to define the level of
stress in the market and train the machine learning model. In this index, zero represents normal
market conditions. When the value drops below zero it means below-average financial market
An appropriate escalation framework is essential to
ensure that the EWI framework is embedded in a
management information system. Overall status changes
to Amber or Red should be linked to internal escalation
frameworks for crisis management
Reporting
Timely reporting is required to ensure that escalation can
happen as required. Best practice is to have EWIs
dashboard daily monitored.
Integrated Systems
Appropriate systems and data are required to ensure that
the reporting can be conducted on a timely basis.
Thresholds
Measures must have relevant and appropriately calibrated
thresholds applied for the escalation process to be
effective ( for this our model will automatically will
calculate status but effective backtesting is critical)
4. Data
Publicly available data from 2007 to 2021 (3537 days) was used to train the machine learning
models in this study. Historical data for potential EWIs for the same period was sourced from
Federal Reserve Economic Data (FRED) and Yahoo Finance for different markets such as Equity,
FX, interest rates and spreads.
Table 3: List of Raw Data and Transformation
Group Raw Data Transformed for Model Definition
Volatility VIX
Logarithmic return, 7 days
standard deviation, high-low
range to low
CBOE Volatility Index
(^VIX)
Commodity Crude_F
Logarithmic return, 7 days
standard deviation, high-low
range to low
Crude Oil Mar 21
(CL=F)
Futures Nasdaq100_
F
Logarithmic return, high-low
range to low
Nasdaq 100 Mar 21
(NQ=F)
Equity Euronext100
Logarithmic return, 7 days
standard deviation, high-low
range to low
EURONEXT 100
(^N100)
Spread TED Movement between two dates TED Spread
Spread CPFF Actual spread as %, 7 days
standard deviation
3-Month Commercial
Paper Minus Federal
Funds Rate
4.1. Data Transformation and Cleaning
The St. Louis Fed Financial Stress Index, which began in late 1993, was used to define the level of
stress in the market and train the machine learning model. In this index, zero represents normal
market conditions. When the value drops below zero it means below-average financial market
Paraphrase This Document
Need a fresh take? Get an instant paraphrase of this document with our AI Paraphraser

stress, whilst above zero is interpreted as above-average market stress (Federal Reserve Bank of St.
Louis, 2021).
In this study, referring to this general definition and based on historical major stress events like the
global financial crisis and recent COVID-19 we assumed 85% normal days (green), 10% moderate
stress days (amber) and 5% severe stress days (red). One limitation of the St Louis Fed Financial
Stress Index is that it provides weekly rather than daily data, therefore the same RAG status was
assumed for the whole week. Although it is recognised that some days may have been a different
level, this should have had a limited impact on the main aim of this study.
With a few exceptions, historical data exists without issue. Below are two issues addressed in the
data preparation, the impact of which was deemed to be limited:
- On 20 and 21 April 2021, crude oil futures prices fell below zero dollars which resulted in a
substantial outlier for the range for these two days compared to the previous day range used.
- CPFF was not available for a number of days during the 2008 financial crisis and COVID-
19 crisis. For these 78 days, the elevated spread level from the last available date was used.
The raw data in Table 3 was transformed as below fo use in the modelling. A seven-day rolling
standard deviation was calculated to capture the increasing volatility in the market and is
represented as a feature.
Table 4: Measures used in tranforming raw data for modelling
Measure Formula
High-low range
TED Spread change
Logarithmic return
Seven days rolling standard deviation
The high-low range was calculated to capture the intra-day variation for the variables referred to in
Table 3. The TED spread, defined as the difference between the three-month US Treasury bill and
the three-month USD Libor, was used as a movement in the model. In order to capture daily
movement of the variables in Table 3, the logarithmic return was calculated.
Visual inspection shows the STLFSI2 captures two recession periods and major financial crises. In
the below figure (Figure 1) it can be seen that STLFSI2 significantly increases during the 2008-
2009 global financial crisis and Covid-19 crisis around February-March 2020. This supports the
hypothesis that the model can be used as a benchmark to train machine learning model for RAG
status estimation. One limitation is that STLFSI2 is published weekly, therefore day t features were
used to predict the t+1 index level.
Figure 1: St. Louis Fed Financial Stress Index (STLFSI2)
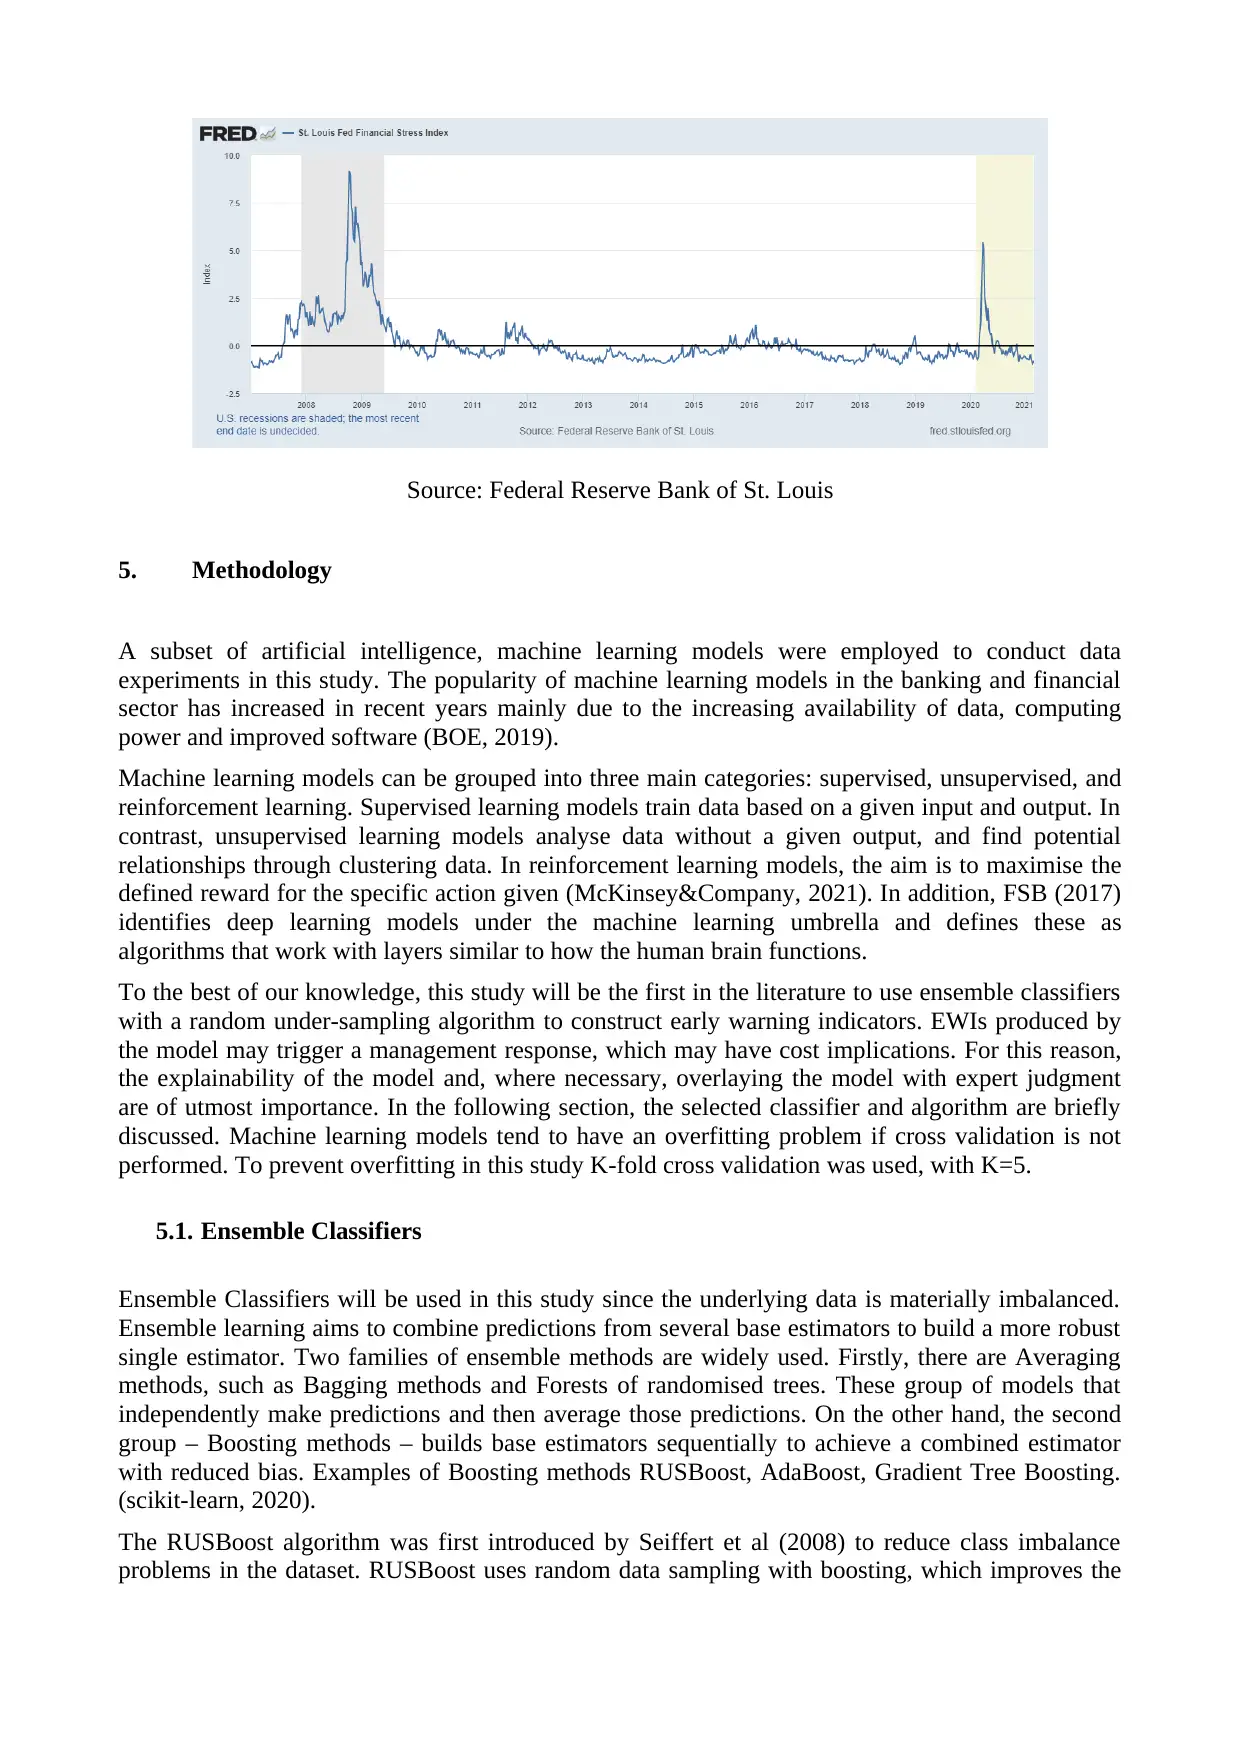
Source: Federal Reserve Bank of St. Louis
5. Methodology
A subset of artificial intelligence, machine learning models were employed to conduct data
experiments in this study. The popularity of machine learning models in the banking and financial
sector has increased in recent years mainly due to the increasing availability of data, computing
power and improved software (BOE, 2019).
Machine learning models can be grouped into three main categories: supervised, unsupervised, and
reinforcement learning. Supervised learning models train data based on a given input and output. In
contrast, unsupervised learning models analyse data without a given output, and find potential
relationships through clustering data. In reinforcement learning models, the aim is to maximise the
defined reward for the specific action given (McKinsey&Company, 2021). In addition, FSB (2017)
identifies deep learning models under the machine learning umbrella and defines these as
algorithms that work with layers similar to how the human brain functions.
To the best of our knowledge, this study will be the first in the literature to use ensemble classifiers
with a random under-sampling algorithm to construct early warning indicators. EWIs produced by
the model may trigger a management response, which may have cost implications. For this reason,
the explainability of the model and, where necessary, overlaying the model with expert judgment
are of utmost importance. In the following section, the selected classifier and algorithm are briefly
discussed. Machine learning models tend to have an overfitting problem if cross validation is not
performed. To prevent overfitting in this study K-fold cross validation was used, with K=5.
5.1. Ensemble Classifiers
Ensemble Classifiers will be used in this study since the underlying data is materially imbalanced.
Ensemble learning aims to combine predictions from several base estimators to build a more robust
single estimator. Two families of ensemble methods are widely used. Firstly, there are Averaging
methods, such as Bagging methods and Forests of randomised trees. These group of models that
independently make predictions and then average those predictions. On the other hand, the second
group – Boosting methods – builds base estimators sequentially to achieve a combined estimator
with reduced bias. Examples of Boosting methods RUSBoost, AdaBoost, Gradient Tree Boosting.
(scikit-learn, 2020).
The RUSBoost algorithm was first introduced by Seiffert et al (2008) to reduce class imbalance
problems in the dataset. RUSBoost uses random data sampling with boosting, which improves the
⊘ This is a preview!⊘
Do you want full access?
Subscribe today to unlock all pages.
Trusted by 1+ million students worldwide
classification performance of the training data. Financial stress or distress bank classification
problems have imbalanced data, wherein one class has far fewer members than others. For this
reason, the RUSBoost algorithm is used for the modelling in this study. For a comprehensive
overview of the RUSBoost algorithm, please refer to Seiffert et al (2010).
Matlab 2019a version is used for the implementation of the models which has eleven ensemble
learning algorithms. Out of these eleven methods, Random Undersampling Boosting (RUSBoost
method) is a better fit for imbalanced data and can be used for binary and multiclass classification.
Matlab’s random under-sampling algorithm takes the same number of observations from each class
of data, which is the same as the number of the minority class. Following sampling, adaptive
boosting is applied to construct the ensemble. For full details see Matlab documentation under
Ensemble Algorithms (MATLAB, Ensemble Algorithms, 2019).
The boosting procedure for RUSBoost applies adaptive boosting for multiclass classification in
calibrating weights and constructing ensembles. Adaptive boosting for multiclass classification in
MATLAB uses weighted pseudo-loss for N observation and K classes. Calculated pseudo-loss is
used as a measure of classification accuracy (MATLAB, Ensemble Algorithms, 2019).
- Each step represented by t, k represents class, N number of observations, K classes
- is a vector of predictor values for observation n,
- represents the true class value taking one of the
- represents the prediction of the learner for each step t
- is the confidence of learner prediction at step t, class k range from zeo to one,
- represents observation weights of class k in step t
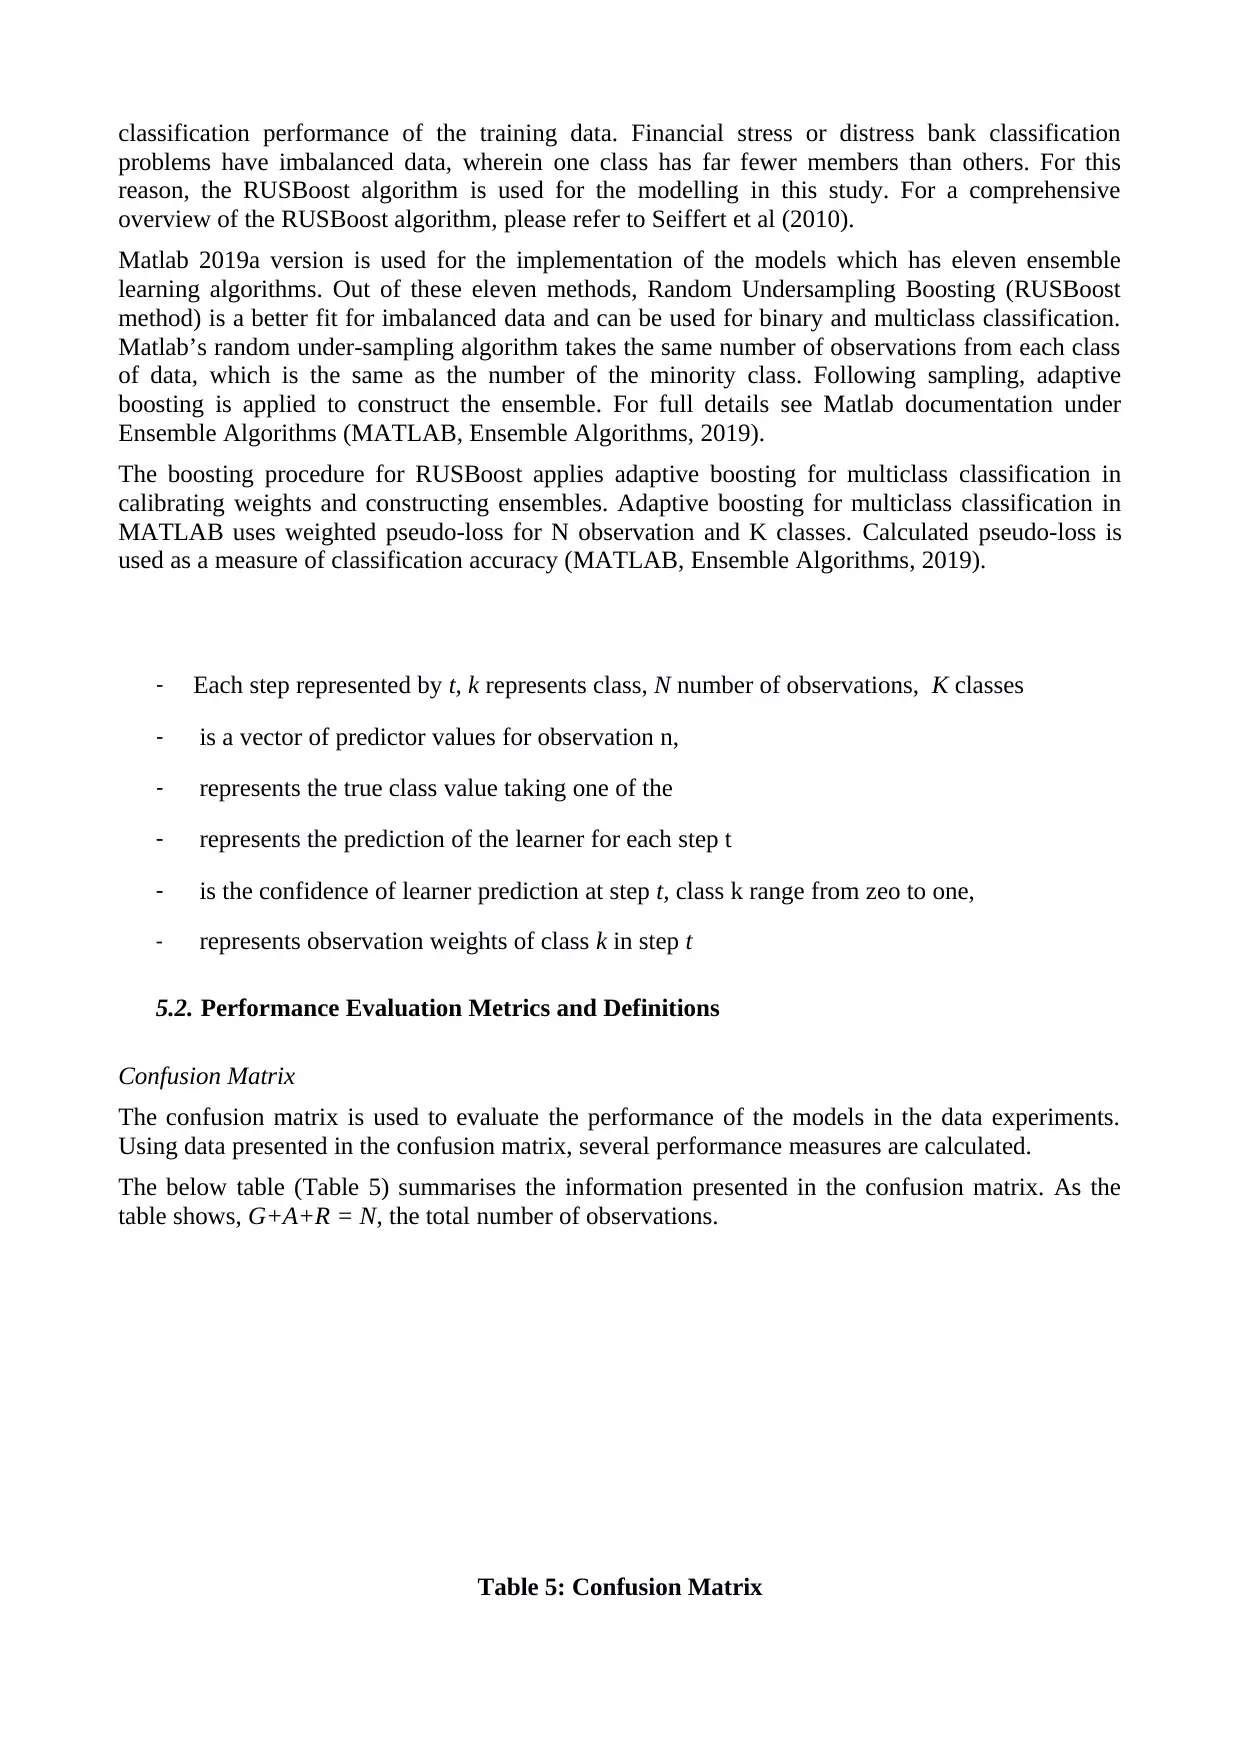
5.2. Performance Evaluation Metrics and Definitions
Confusion Matrix
The confusion matrix is used to evaluate the performance of the models in the data experiments.
Using data presented in the confusion matrix, several performance measures are calculated.
The below table (Table 5) summarises the information presented in the confusion matrix. As the
table shows, G+A+R = N, the total number of observations.
Table 5: Confusion Matrix
problems have imbalanced data, wherein one class has far fewer members than others. For this
reason, the RUSBoost algorithm is used for the modelling in this study. For a comprehensive
overview of the RUSBoost algorithm, please refer to Seiffert et al (2010).
Matlab 2019a version is used for the implementation of the models which has eleven ensemble
learning algorithms. Out of these eleven methods, Random Undersampling Boosting (RUSBoost
method) is a better fit for imbalanced data and can be used for binary and multiclass classification.
Matlab’s random under-sampling algorithm takes the same number of observations from each class
of data, which is the same as the number of the minority class. Following sampling, adaptive
boosting is applied to construct the ensemble. For full details see Matlab documentation under
Ensemble Algorithms (MATLAB, Ensemble Algorithms, 2019).
The boosting procedure for RUSBoost applies adaptive boosting for multiclass classification in
calibrating weights and constructing ensembles. Adaptive boosting for multiclass classification in
MATLAB uses weighted pseudo-loss for N observation and K classes. Calculated pseudo-loss is
used as a measure of classification accuracy (MATLAB, Ensemble Algorithms, 2019).
- Each step represented by t, k represents class, N number of observations, K classes
- is a vector of predictor values for observation n,
- represents the true class value taking one of the
- represents the prediction of the learner for each step t
- is the confidence of learner prediction at step t, class k range from zeo to one,
- represents observation weights of class k in step t
5.2. Performance Evaluation Metrics and Definitions
Confusion Matrix
The confusion matrix is used to evaluate the performance of the models in the data experiments.
Using data presented in the confusion matrix, several performance measures are calculated.
The below table (Table 5) summarises the information presented in the confusion matrix. As the
table shows, G+A+R = N, the total number of observations.
Table 5: Confusion Matrix
Paraphrase This Document
Need a fresh take? Get an instant paraphrase of this document with our AI Paraphraser
RAG Status Predicted
Class
RAG
Status
Actual
Class
Green Amber Red Total
Green True Green (TG) False Amber_1
(FA1)
False Red_1
(FR1) G
Amber False Green_1
(FG1) True Amber (TA) False Red_2
(FR2) A
Red False Green_2
(FG2)
False Amber_2
(FA2) True Red (TR) R
Total G* A* R* N
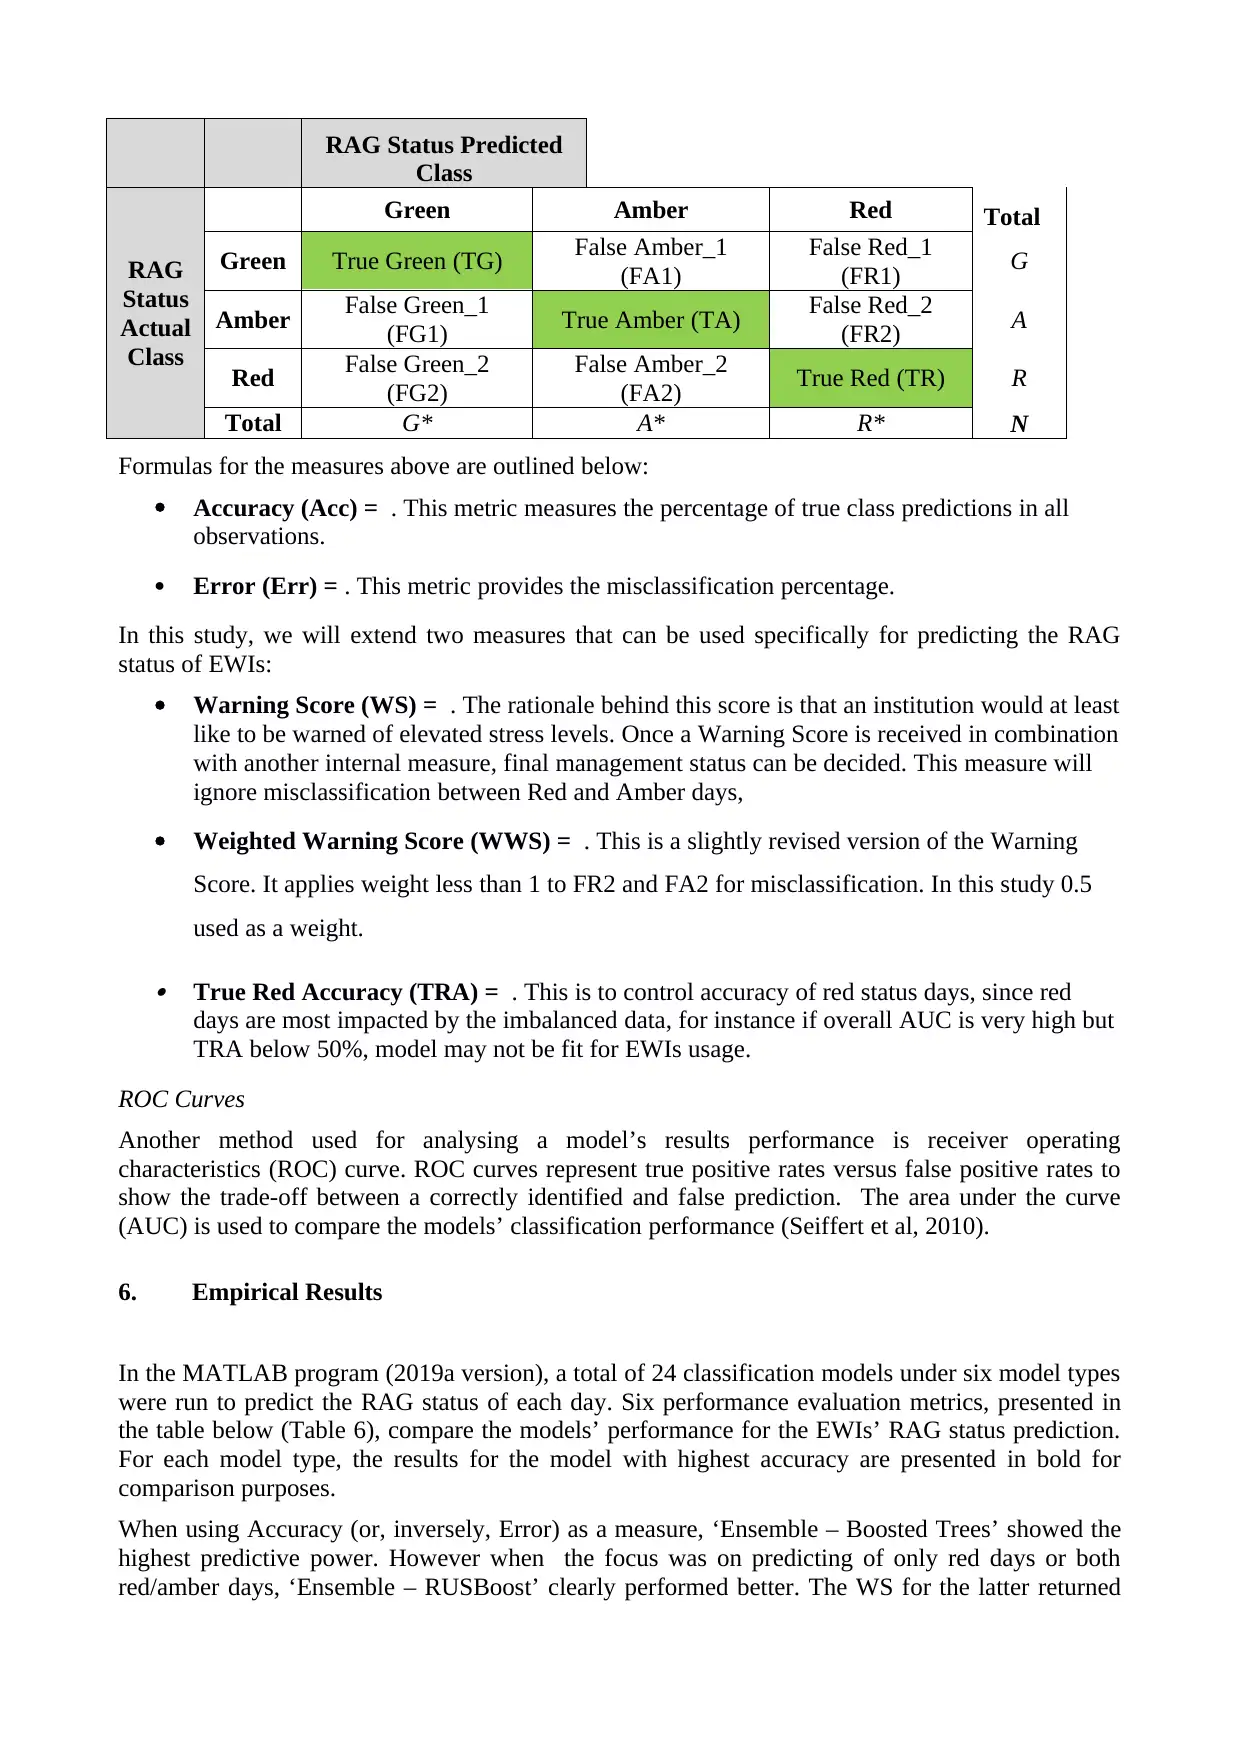
Formulas for the measures above are outlined below:
Accuracy (Acc) = . This metric measures the percentage of true class predictions in all
observations.
Error (Err) = . This metric provides the misclassification percentage.
In this study, we will extend two measures that can be used specifically for predicting the RAG
status of EWIs:
Warning Score (WS) = . The rationale behind this score is that an institution would at least
like to be warned of elevated stress levels. Once a Warning Score is received in combination
with another internal measure, final management status can be decided. This measure will
ignore misclassification between Red and Amber days,
Weighted Warning Score (WWS) = . This is a slightly revised version of the Warning
Score. It applies weight less than 1 to FR2 and FA2 for misclassification. In this study 0.5
used as a weight.
True Red Accuracy (TRA) = . This is to control accuracy of red status days, since red
days are most impacted by the imbalanced data, for instance if overall AUC is very high but
TRA below 50%, model may not be fit for EWIs usage.
ROC Curves
Another method used for analysing a model’s results performance is receiver operating
characteristics (ROC) curve. ROC curves represent true positive rates versus false positive rates to
show the trade-off between a correctly identified and false prediction. The area under the curve
(AUC) is used to compare the models’ classification performance (Seiffert et al, 2010).
6. Empirical Results
In the MATLAB program (2019a version), a total of 24 classification models under six model types
were run to predict the RAG status of each day. Six performance evaluation metrics, presented in
the table below (Table 6), compare the models’ performance for the EWIs’ RAG status prediction.
For each model type, the results for the model with highest accuracy are presented in bold for
comparison purposes.
When using Accuracy (or, inversely, Error) as a measure, ‘Ensemble – Boosted Trees’ showed the
highest predictive power. However when the focus was on predicting of only red days or both
red/amber days, ‘Ensemble – RUSBoost’ clearly performed better. The WS for the latter returned
Class
RAG
Status
Actual
Class
Green Amber Red Total
Green True Green (TG) False Amber_1
(FA1)
False Red_1
(FR1) G
Amber False Green_1
(FG1) True Amber (TA) False Red_2
(FR2) A
Red False Green_2
(FG2)
False Amber_2
(FA2) True Red (TR) R
Total G* A* R* N
Formulas for the measures above are outlined below:
Accuracy (Acc) = . This metric measures the percentage of true class predictions in all
observations.
Error (Err) = . This metric provides the misclassification percentage.
In this study, we will extend two measures that can be used specifically for predicting the RAG
status of EWIs:
Warning Score (WS) = . The rationale behind this score is that an institution would at least
like to be warned of elevated stress levels. Once a Warning Score is received in combination
with another internal measure, final management status can be decided. This measure will
ignore misclassification between Red and Amber days,
Weighted Warning Score (WWS) = . This is a slightly revised version of the Warning
Score. It applies weight less than 1 to FR2 and FA2 for misclassification. In this study 0.5
used as a weight.
True Red Accuracy (TRA) = . This is to control accuracy of red status days, since red
days are most impacted by the imbalanced data, for instance if overall AUC is very high but
TRA below 50%, model may not be fit for EWIs usage.
ROC Curves
Another method used for analysing a model’s results performance is receiver operating
characteristics (ROC) curve. ROC curves represent true positive rates versus false positive rates to
show the trade-off between a correctly identified and false prediction. The area under the curve
(AUC) is used to compare the models’ classification performance (Seiffert et al, 2010).
6. Empirical Results
In the MATLAB program (2019a version), a total of 24 classification models under six model types
were run to predict the RAG status of each day. Six performance evaluation metrics, presented in
the table below (Table 6), compare the models’ performance for the EWIs’ RAG status prediction.
For each model type, the results for the model with highest accuracy are presented in bold for
comparison purposes.
When using Accuracy (or, inversely, Error) as a measure, ‘Ensemble – Boosted Trees’ showed the
highest predictive power. However when the focus was on predicting of only red days or both
red/amber days, ‘Ensemble – RUSBoost’ clearly performed better. The WS for the latter returned
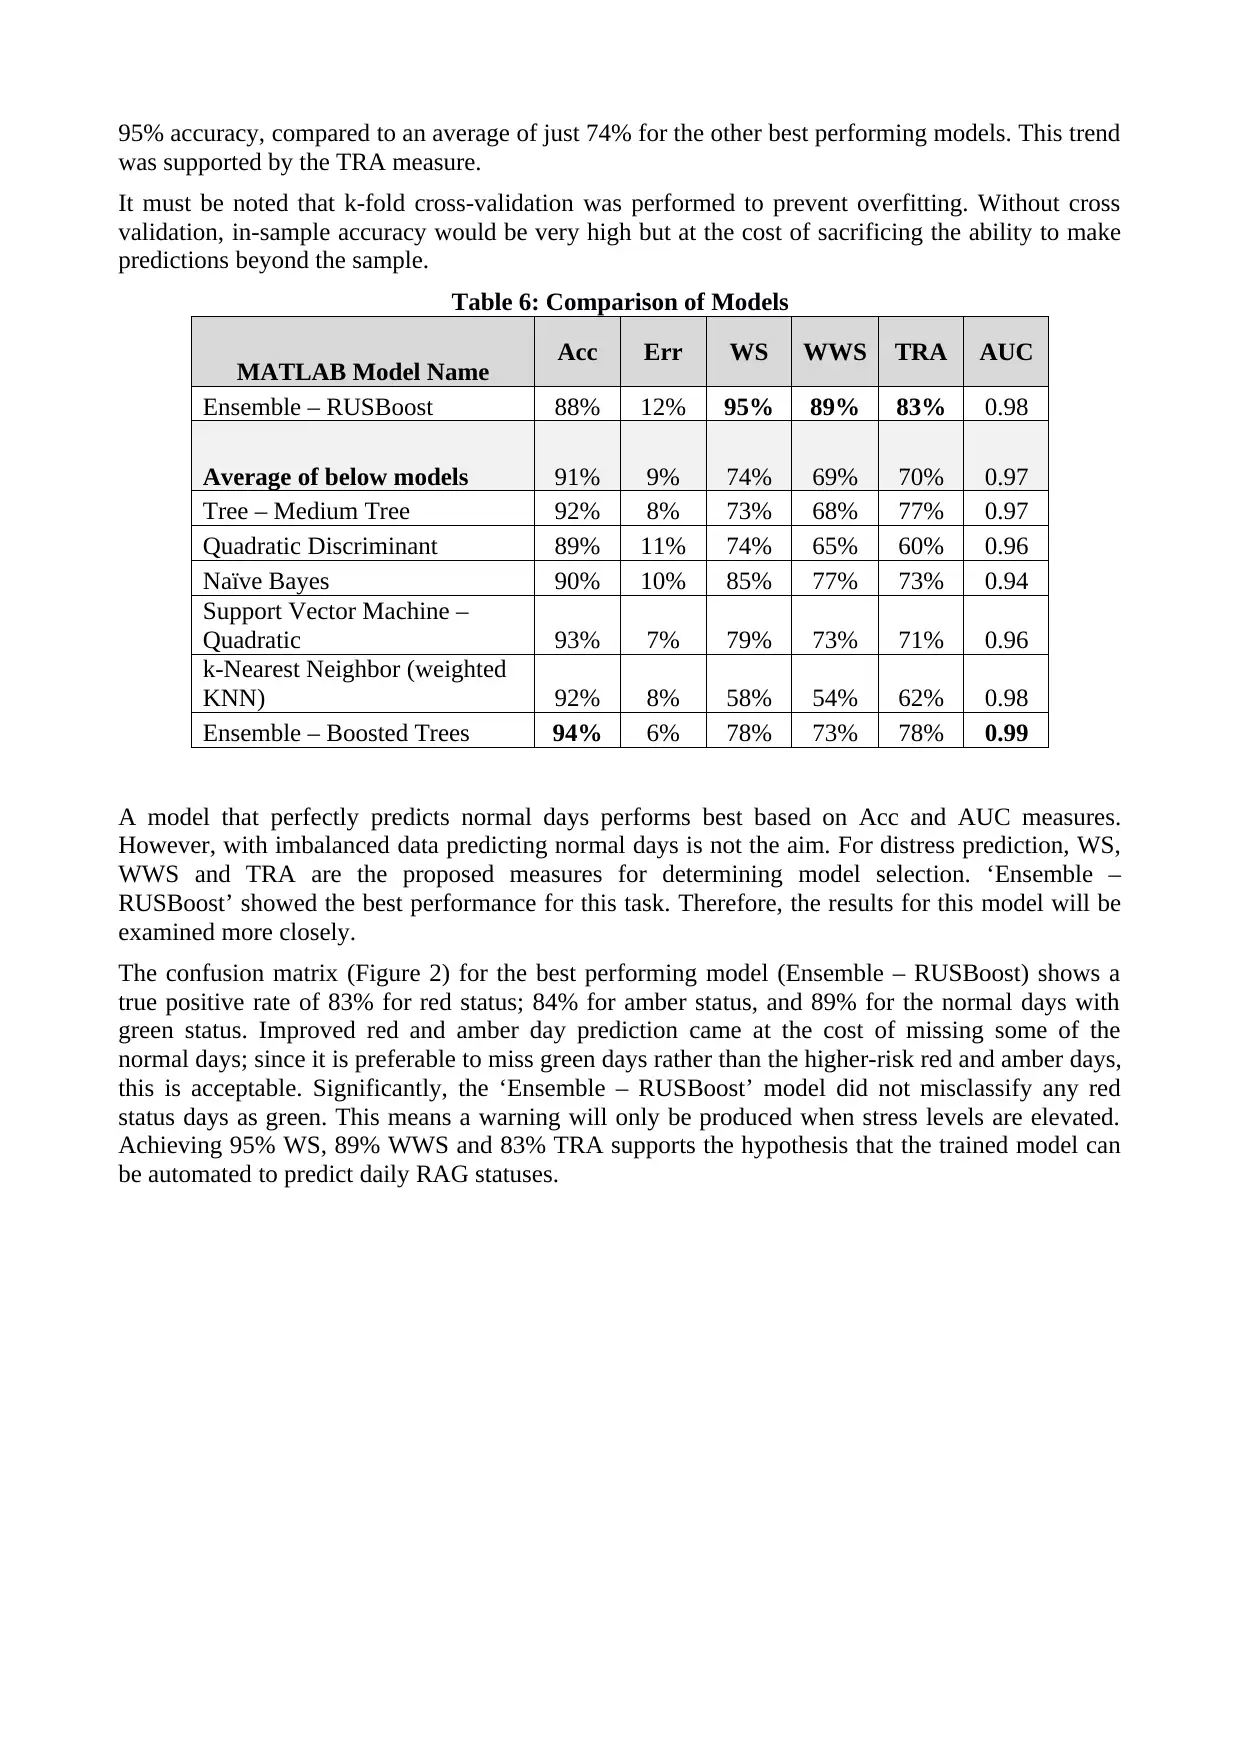
95% accuracy, compared to an average of just 74% for the other best performing models. This trend
was supported by the TRA measure.
It must be noted that k-fold cross-validation was performed to prevent overfitting. Without cross
validation, in-sample accuracy would be very high but at the cost of sacrificing the ability to make
predictions beyond the sample.
Table 6: Comparison of Models
MATLAB Model Name Acc Err WS WWS TRA AUC
Ensemble – RUSBoost 88% 12% 95% 89% 83% 0.98
Average of below models 91% 9% 74% 69% 70% 0.97
Tree – Medium Tree 92% 8% 73% 68% 77% 0.97
Quadratic Discriminant 89% 11% 74% 65% 60% 0.96
Naïve Bayes 90% 10% 85% 77% 73% 0.94
Support Vector Machine –
Quadratic 93% 7% 79% 73% 71% 0.96
k-Nearest Neighbor (weighted
KNN) 92% 8% 58% 54% 62% 0.98
Ensemble – Boosted Trees 94% 6% 78% 73% 78% 0.99
A model that perfectly predicts normal days performs best based on Acc and AUC measures.
However, with imbalanced data predicting normal days is not the aim. For distress prediction, WS,
WWS and TRA are the proposed measures for determining model selection. ‘Ensemble –
RUSBoost’ showed the best performance for this task. Therefore, the results for this model will be
examined more closely.
The confusion matrix (Figure 2) for the best performing model (Ensemble – RUSBoost) shows a
true positive rate of 83% for red status; 84% for amber status, and 89% for the normal days with
green status. Improved red and amber day prediction came at the cost of missing some of the
normal days; since it is preferable to miss green days rather than the higher-risk red and amber days,
this is acceptable. Significantly, the ‘Ensemble – RUSBoost’ model did not misclassify any red
status days as green. This means a warning will only be produced when stress levels are elevated.
Achieving 95% WS, 89% WWS and 83% TRA supports the hypothesis that the trained model can
be automated to predict daily RAG statuses.
⊘ This is a preview!⊘
Do you want full access?
Subscribe today to unlock all pages.
Trusted by 1+ million students worldwide
1 out of 16
Your All-in-One AI-Powered Toolkit for Academic Success.
+13062052269
info@desklib.com
Available 24*7 on WhatsApp / Email
![[object Object]](/_next/static/media/star-bottom.7253800d.svg)
Unlock your academic potential
Copyright © 2020–2025 A2Z Services. All Rights Reserved. Developed and managed by ZUCOL.