Microeconomics and Profit Maximization
VerifiedAdded on 2020/03/04
|13
|2040
|45
AI Summary
This assignment delves into microeconomics concepts to analyze a gardening company's profit maximization strategy. It examines their cost structure, including average variable cost, average total cost, and marginal cost. The analysis incorporates the concept of marginal revenue and applies it within the framework of a perfectly competitive market. Students are expected to determine the optimal production level for the company based on these microeconomic principles.
Contribute Materials
Your contribution can guide someone’s learning journey. Share your
documents today.
Running head: ECONOMIC ASSIGNMENT
Economic Assignment
Name of the Student
Name of the University
Author note
Economic Assignment
Name of the Student
Name of the University
Author note
Secure Best Marks with AI Grader
Need help grading? Try our AI Grader for instant feedback on your assignments.
1ECONOMIC ASSIGNMENT
Table of Contents
Answer 1..........................................................................................................................................2
Answer 2..........................................................................................................................................4
Answer 3..........................................................................................................................................7
Answer 4..........................................................................................................................................8
Answer 5........................................................................................................................................10
References......................................................................................................................................12
2ECONOMIC ASSIGNMENT
Answer 1
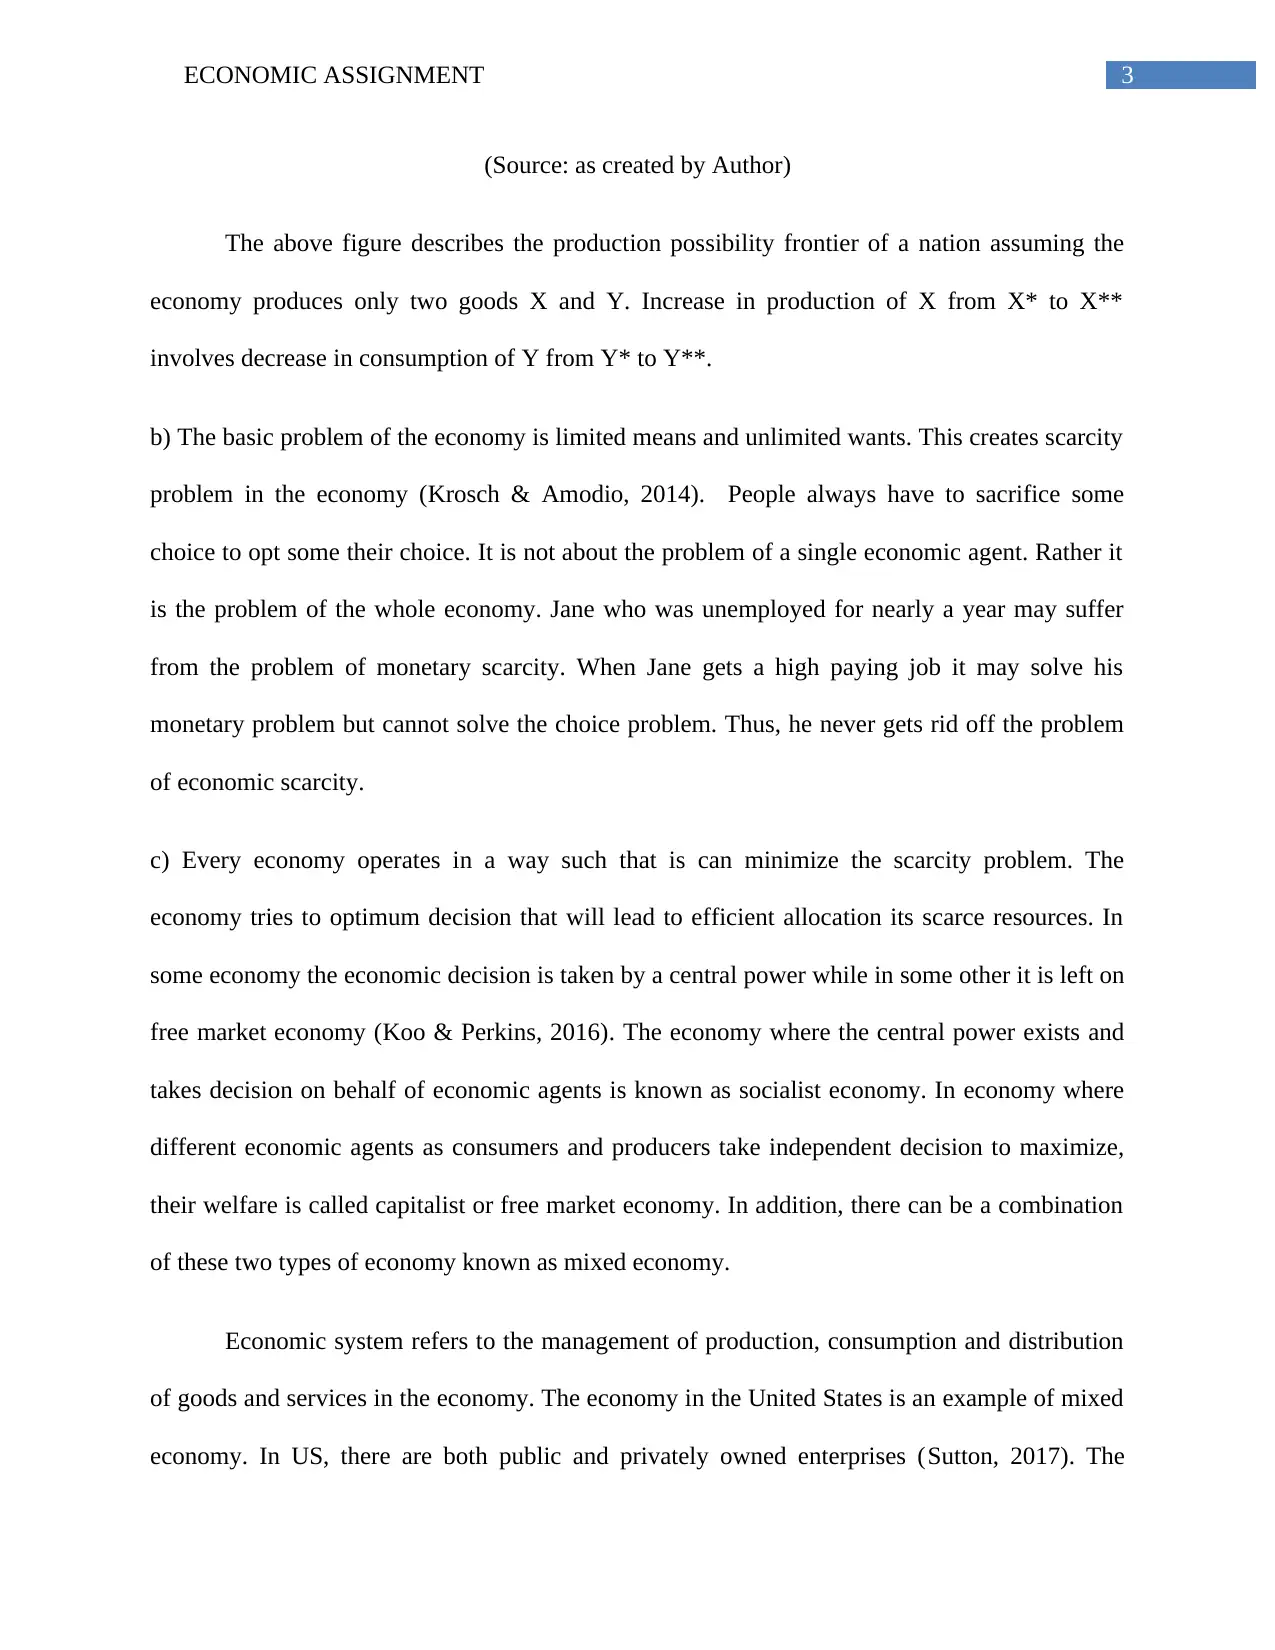
a)Production Possibility Curve (PPC) that captures output capacity of the nation is usually
concave in shape. The curve is drawn taken the axiom possible combination of output devoting
all the resources of the country. The amount of resources in an economy is constant. Therefore,
the country cannot produce unlimited quantity all goods. In fact, increase in output of any one
commodity involves the choice of sacrificing other commodity (Nicholson & Snyder, 2014).
This is termed as opportunity cost associated with the production choice. Now more the country
produce one good the more it needs to sacrifice other commodities. The presence of increasing
opportunity cost make the PPC bowed outward. On a straight line, the opportunity cost remains
constant, which is not actually the case.
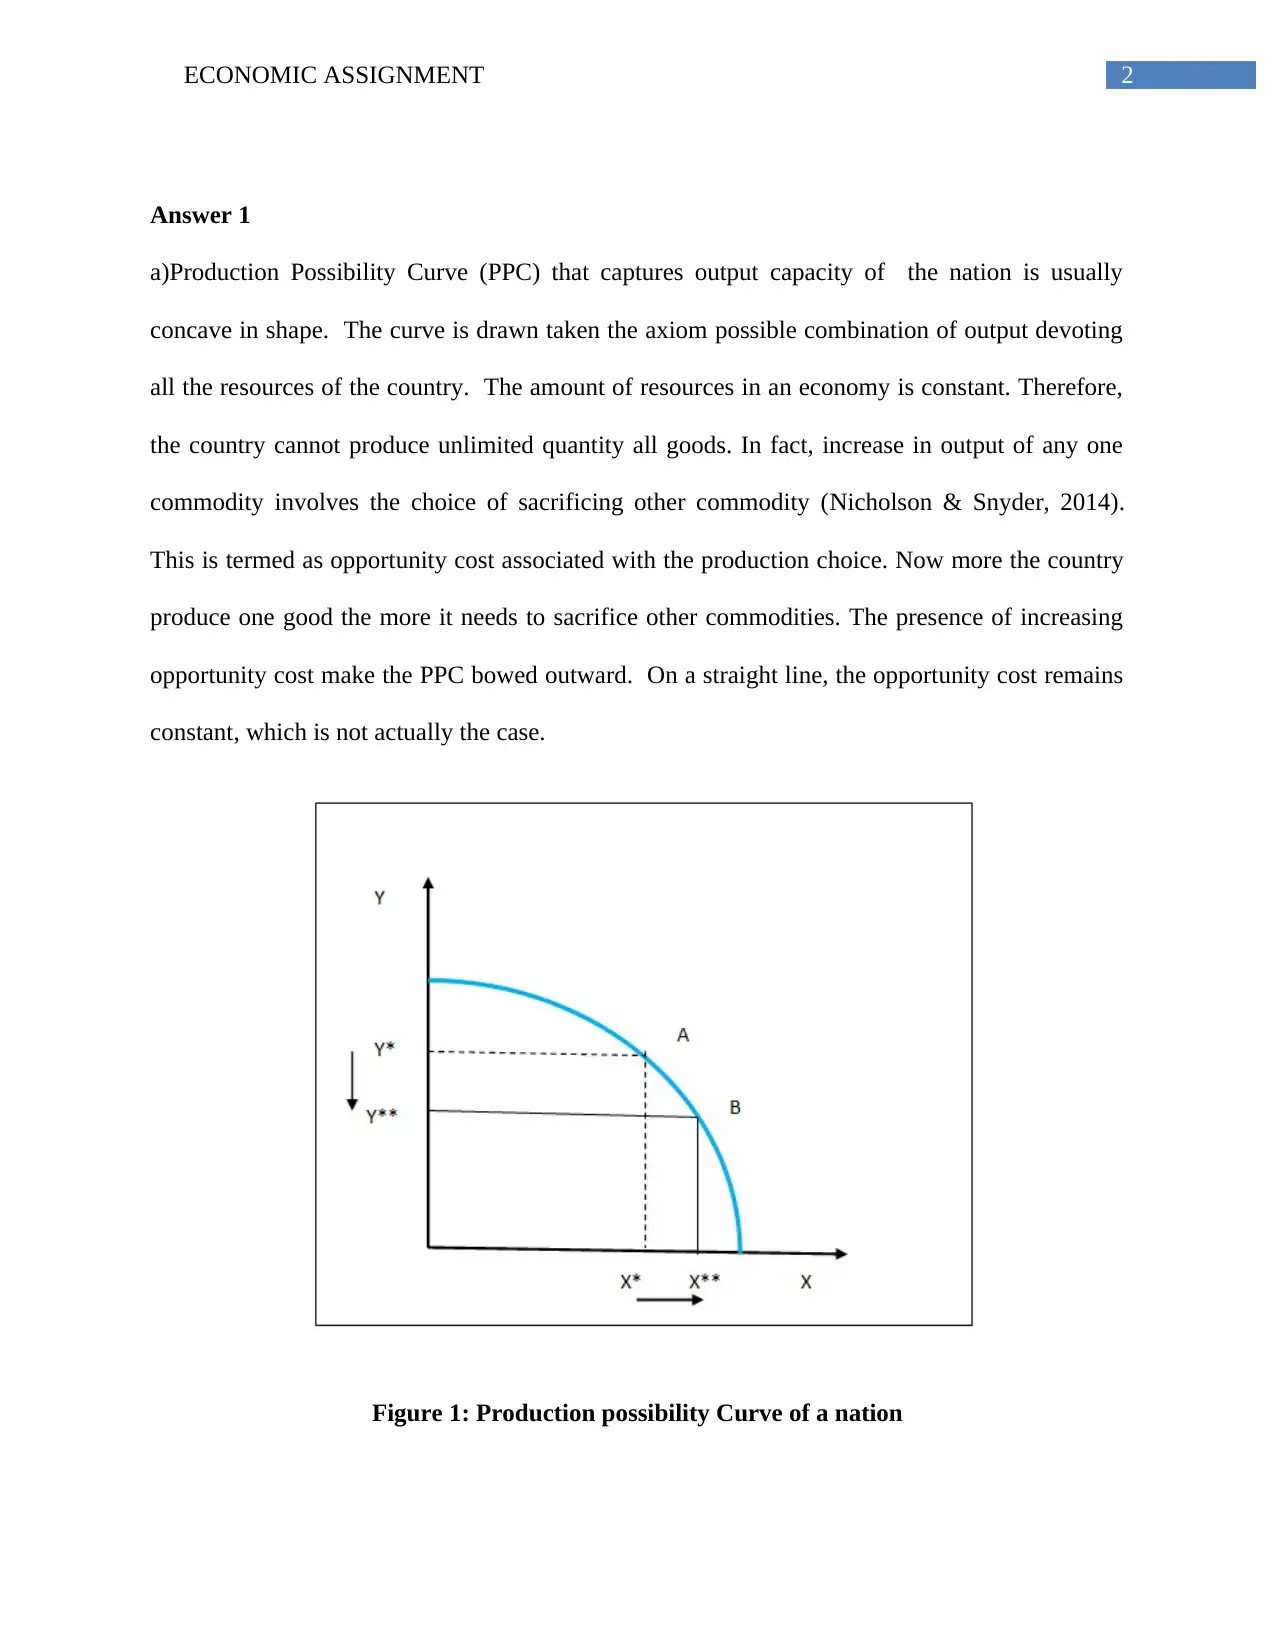
Figure 1: Production possibility Curve of a nation
Answer 1
a)Production Possibility Curve (PPC) that captures output capacity of the nation is usually
concave in shape. The curve is drawn taken the axiom possible combination of output devoting
all the resources of the country. The amount of resources in an economy is constant. Therefore,
the country cannot produce unlimited quantity all goods. In fact, increase in output of any one
commodity involves the choice of sacrificing other commodity (Nicholson & Snyder, 2014).
This is termed as opportunity cost associated with the production choice. Now more the country
produce one good the more it needs to sacrifice other commodities. The presence of increasing
opportunity cost make the PPC bowed outward. On a straight line, the opportunity cost remains
constant, which is not actually the case.
Figure 1: Production possibility Curve of a nation
3ECONOMIC ASSIGNMENT
(Source: as created by Author)
The above figure describes the production possibility frontier of a nation assuming the
economy produces only two goods X and Y. Increase in production of X from X* to X**
involves decrease in consumption of Y from Y* to Y**.
b) The basic problem of the economy is limited means and unlimited wants. This creates scarcity
problem in the economy (Krosch & Amodio, 2014). People always have to sacrifice some
choice to opt some their choice. It is not about the problem of a single economic agent. Rather it
is the problem of the whole economy. Jane who was unemployed for nearly a year may suffer
from the problem of monetary scarcity. When Jane gets a high paying job it may solve his
monetary problem but cannot solve the choice problem. Thus, he never gets rid off the problem
of economic scarcity.
c) Every economy operates in a way such that is can minimize the scarcity problem. The
economy tries to optimum decision that will lead to efficient allocation its scarce resources. In
some economy the economic decision is taken by a central power while in some other it is left on
free market economy (Koo & Perkins, 2016). The economy where the central power exists and
takes decision on behalf of economic agents is known as socialist economy. In economy where
different economic agents as consumers and producers take independent decision to maximize,
their welfare is called capitalist or free market economy. In addition, there can be a combination
of these two types of economy known as mixed economy.
Economic system refers to the management of production, consumption and distribution
of goods and services in the economy. The economy in the United States is an example of mixed
economy. In US, there are both public and privately owned enterprises (Sutton, 2017). The
Secure Best Marks with AI Grader
Need help grading? Try our AI Grader for instant feedback on your assignments.
4ECONOMIC ASSIGNMENT
government controls resource allocation in public sectors and controls the necessary production
of the economy. Food stamps are provided people to meet their need for food demand. In order
to fulfill the basic needs of the people with scarce resources government grants aid for house,
health and other benefits. For other sector, the economy relies on free market economy for
efficient resource allocation.
Answer 2
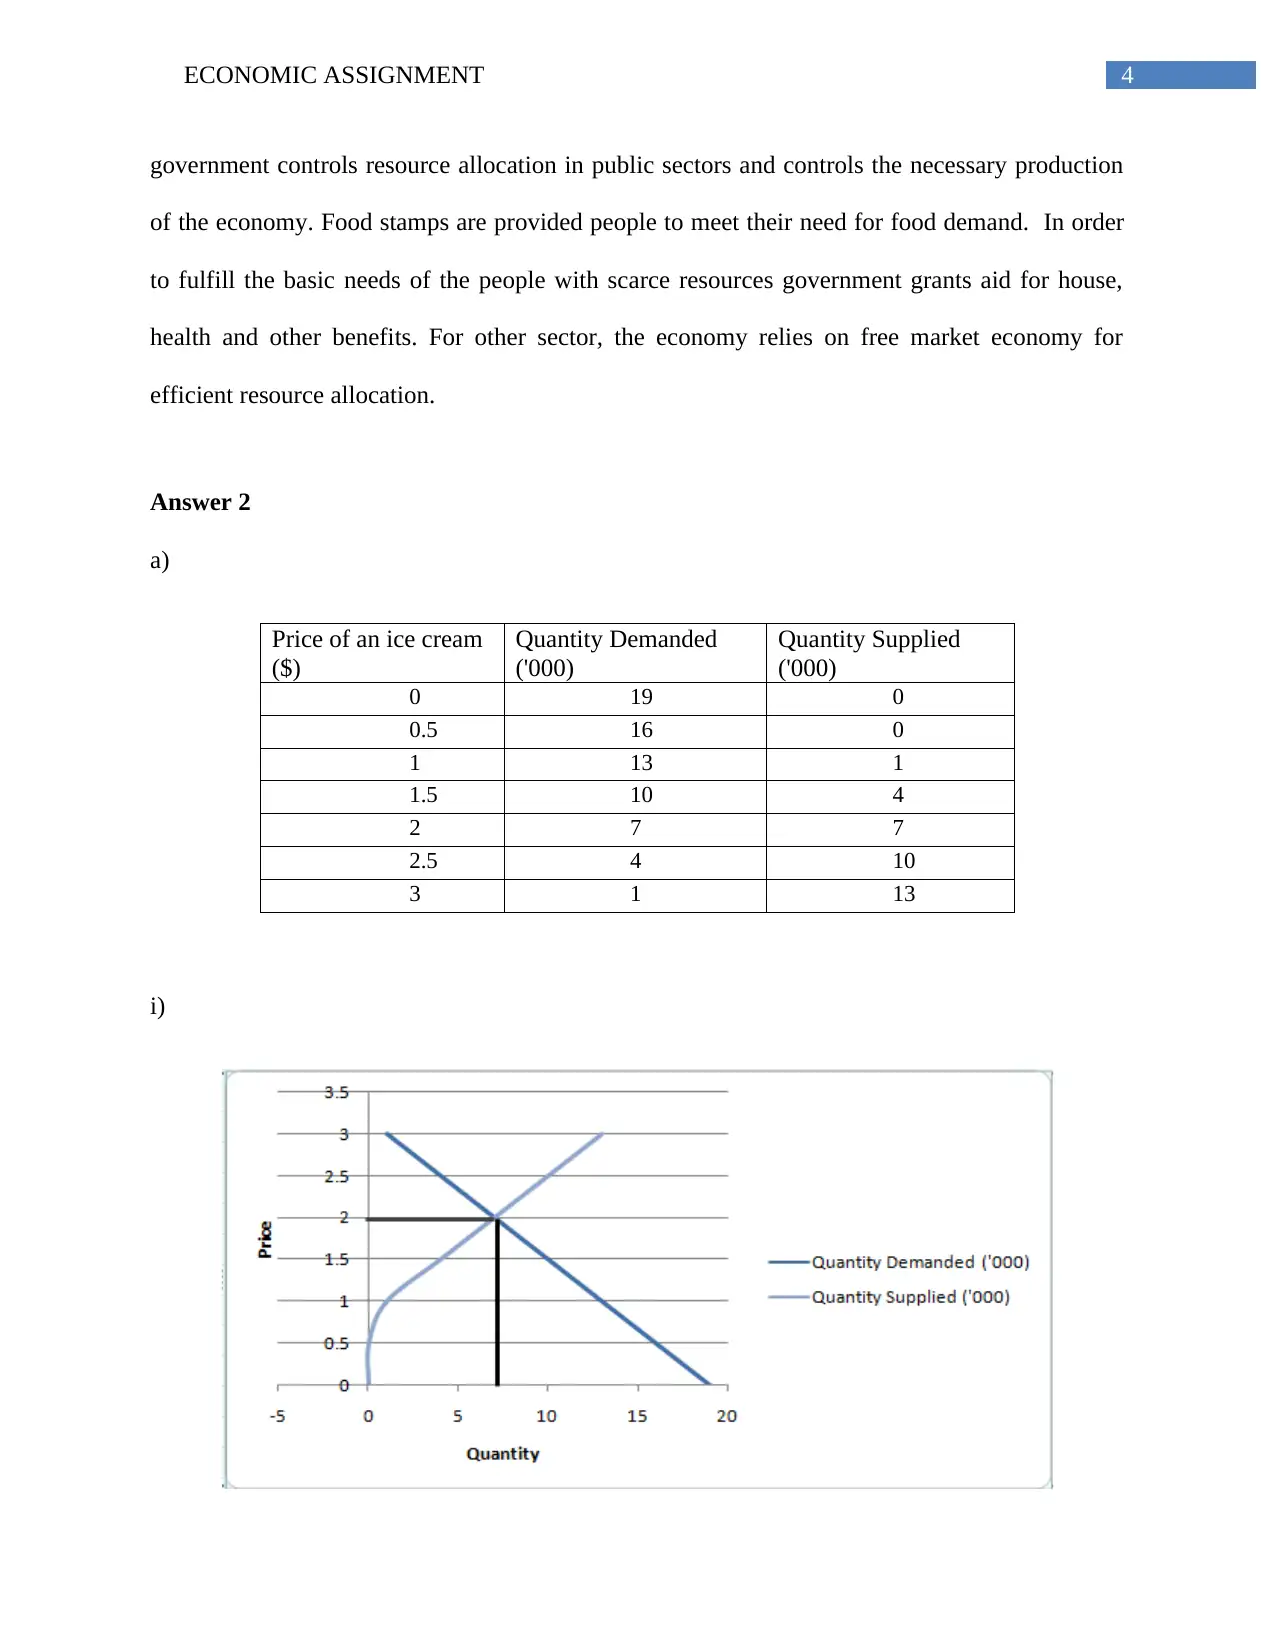
a)
Price of an ice cream
($)
Quantity Demanded
('000)
Quantity Supplied
('000)
0 19 0
0.5 16 0
1 13 1
1.5 10 4
2 7 7
2.5 4 10
3 1 13
i)
government controls resource allocation in public sectors and controls the necessary production
of the economy. Food stamps are provided people to meet their need for food demand. In order
to fulfill the basic needs of the people with scarce resources government grants aid for house,
health and other benefits. For other sector, the economy relies on free market economy for
efficient resource allocation.
Answer 2
a)
Price of an ice cream
($)
Quantity Demanded
('000)
Quantity Supplied
('000)
0 19 0
0.5 16 0
1 13 1
1.5 10 4
2 7 7
2.5 4 10
3 1 13
i)
5ECONOMIC ASSIGNMENT
Figure 2: Demand and Supply Schedule of ice cream
ii)Equilibrium price and quantity in the market is $2 and 7 ice cream respectively.
iii) Consumer surplus is the gain to the consumers. It is computed as a difference between
maximum willingness to pay for a good and the existing price of the commodity. There are two
price beyond the equilibrium where the consumers still demand ice cream reflecting a higher
willingness to pay. Therefore, Consumer surplus in the ice cream market is-
Consumer Surplus ( CS )= ( 2.5−2 )+ ( 3−2 )
¿ 0.5+1
¿ 1.5
Producer Surplus is the gain to the producers for participating in market activity. As like
consumer surplus it is obtained by king away the minimum price at which the producers ready to
supply a good from the market equilibrium price of the good (Carlton, & Perloff, 2015).. The
suppliers who are willing to supply the good at below the equilibrium price receive producer
surplus.
Producer Surplus ( PS )= ( 2−1.5 )+ (2−1 )
¿ 0.5+1
¿ 1.5
6ECONOMIC ASSIGNMENT
iv)
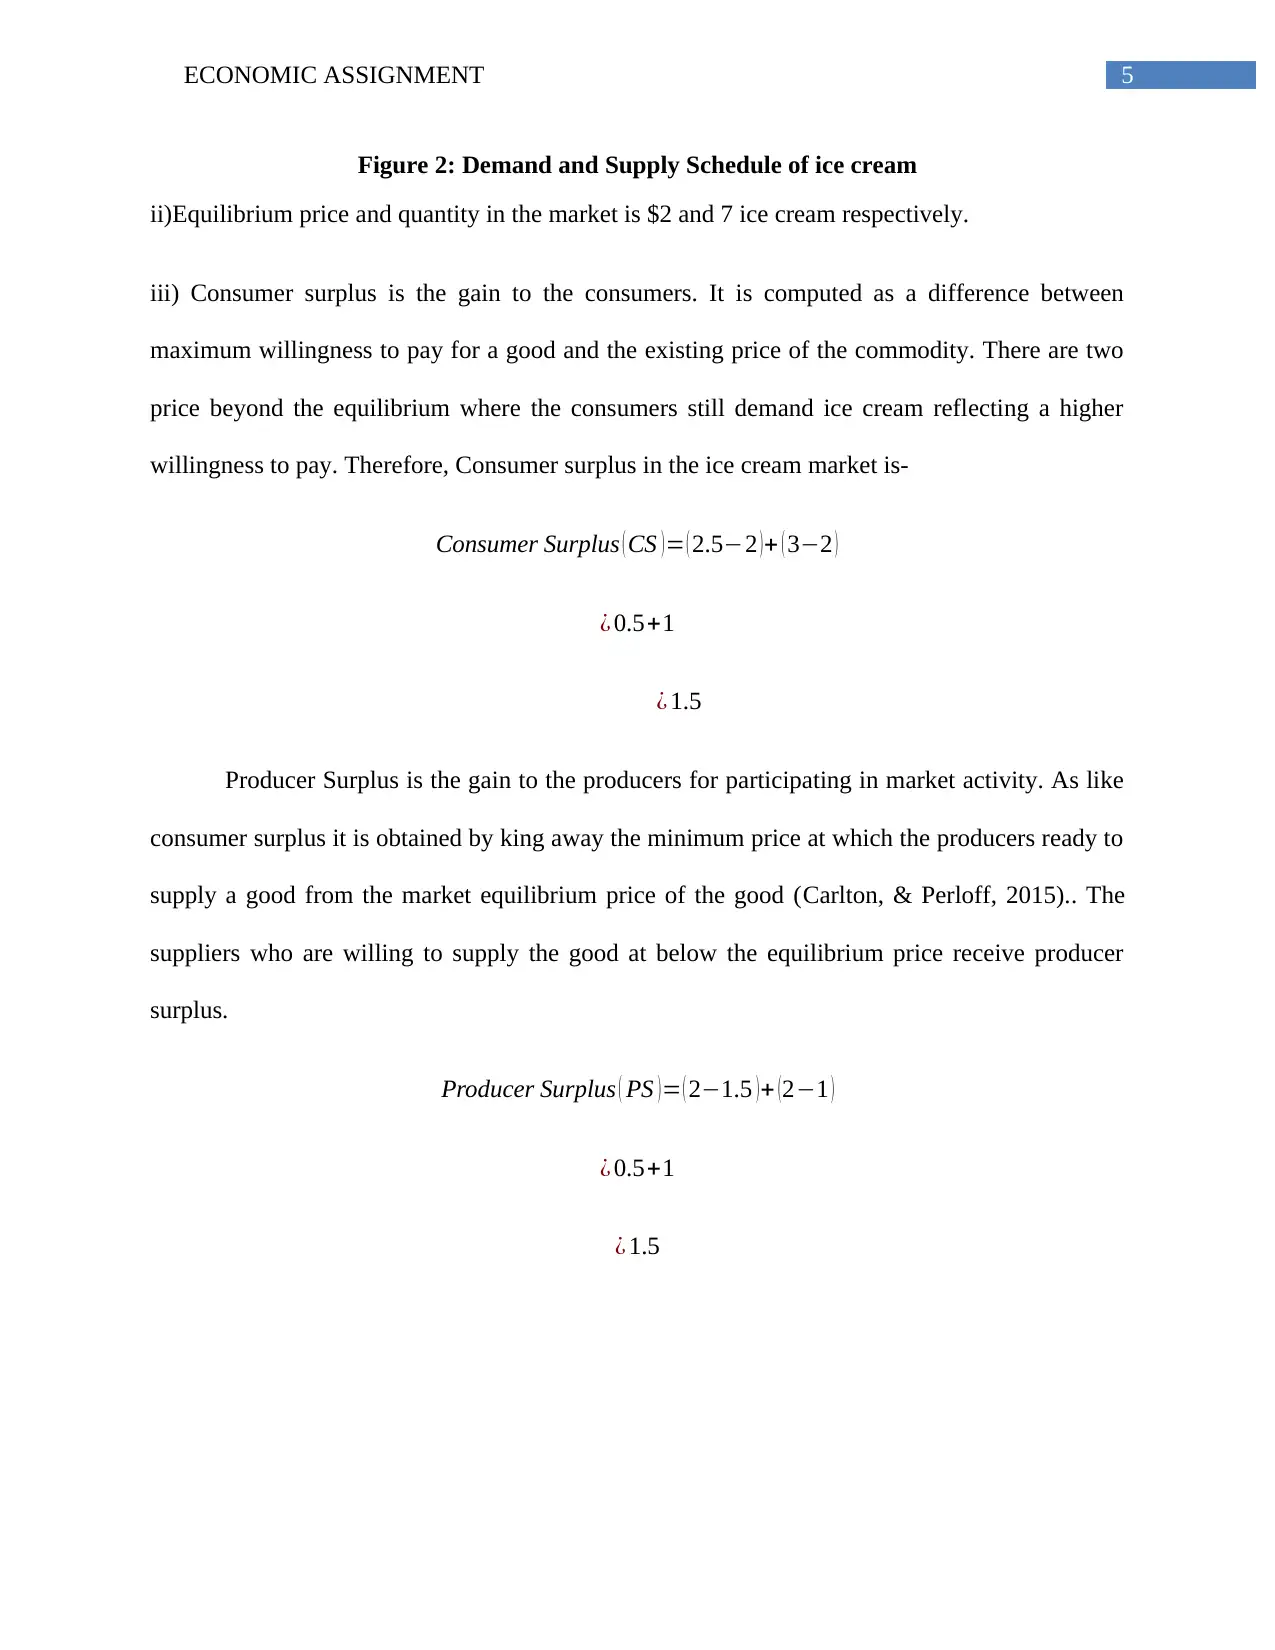
Figure 3: demand and supply for ice cream in winter
Demand for a commodity depends on a number of factors. Price is the major determinant
of demand, Change in price causes a shift point of quantity demanded on the demand curve. The
inward or outward shift of the demand curve happens for factors other than prices (Rios,
McConnell & Brue, 2013). One such factor is taste and preference for the concerned commodity.
In winter people has less preference for ice cream. This causes a decrease in demand as
presented by the inward shift of the demand curve. The equilibrium is obtained at the intersection
of new demand curve and old supply curve. In the new equilibrium both the price and quantity
demanded for ice cream will be reduced.
v) With a shift in the equilibrium point, surplus enjoyed by both the consumers and producers
will change. Consumer surplus depends on equilibrium price and willingness to pay. Both is
reduced in winter as compared to in summer. However, decrease in willingness is greater than
decrease in equilibrium price. Therefore, consumers in the ice cream market experience a
iv)
Figure 3: demand and supply for ice cream in winter
Demand for a commodity depends on a number of factors. Price is the major determinant
of demand, Change in price causes a shift point of quantity demanded on the demand curve. The
inward or outward shift of the demand curve happens for factors other than prices (Rios,
McConnell & Brue, 2013). One such factor is taste and preference for the concerned commodity.
In winter people has less preference for ice cream. This causes a decrease in demand as
presented by the inward shift of the demand curve. The equilibrium is obtained at the intersection
of new demand curve and old supply curve. In the new equilibrium both the price and quantity
demanded for ice cream will be reduced.
v) With a shift in the equilibrium point, surplus enjoyed by both the consumers and producers
will change. Consumer surplus depends on equilibrium price and willingness to pay. Both is
reduced in winter as compared to in summer. However, decrease in willingness is greater than
decrease in equilibrium price. Therefore, consumers in the ice cream market experience a
Paraphrase This Document
Need a fresh take? Get an instant paraphrase of this document with our AI Paraphraser
7ECONOMIC ASSIGNMENT
reduction in consumer surplus. A reduction in equilibrium price along with change in the
willingness to supply reduces producer surplus as well.
Answer 3
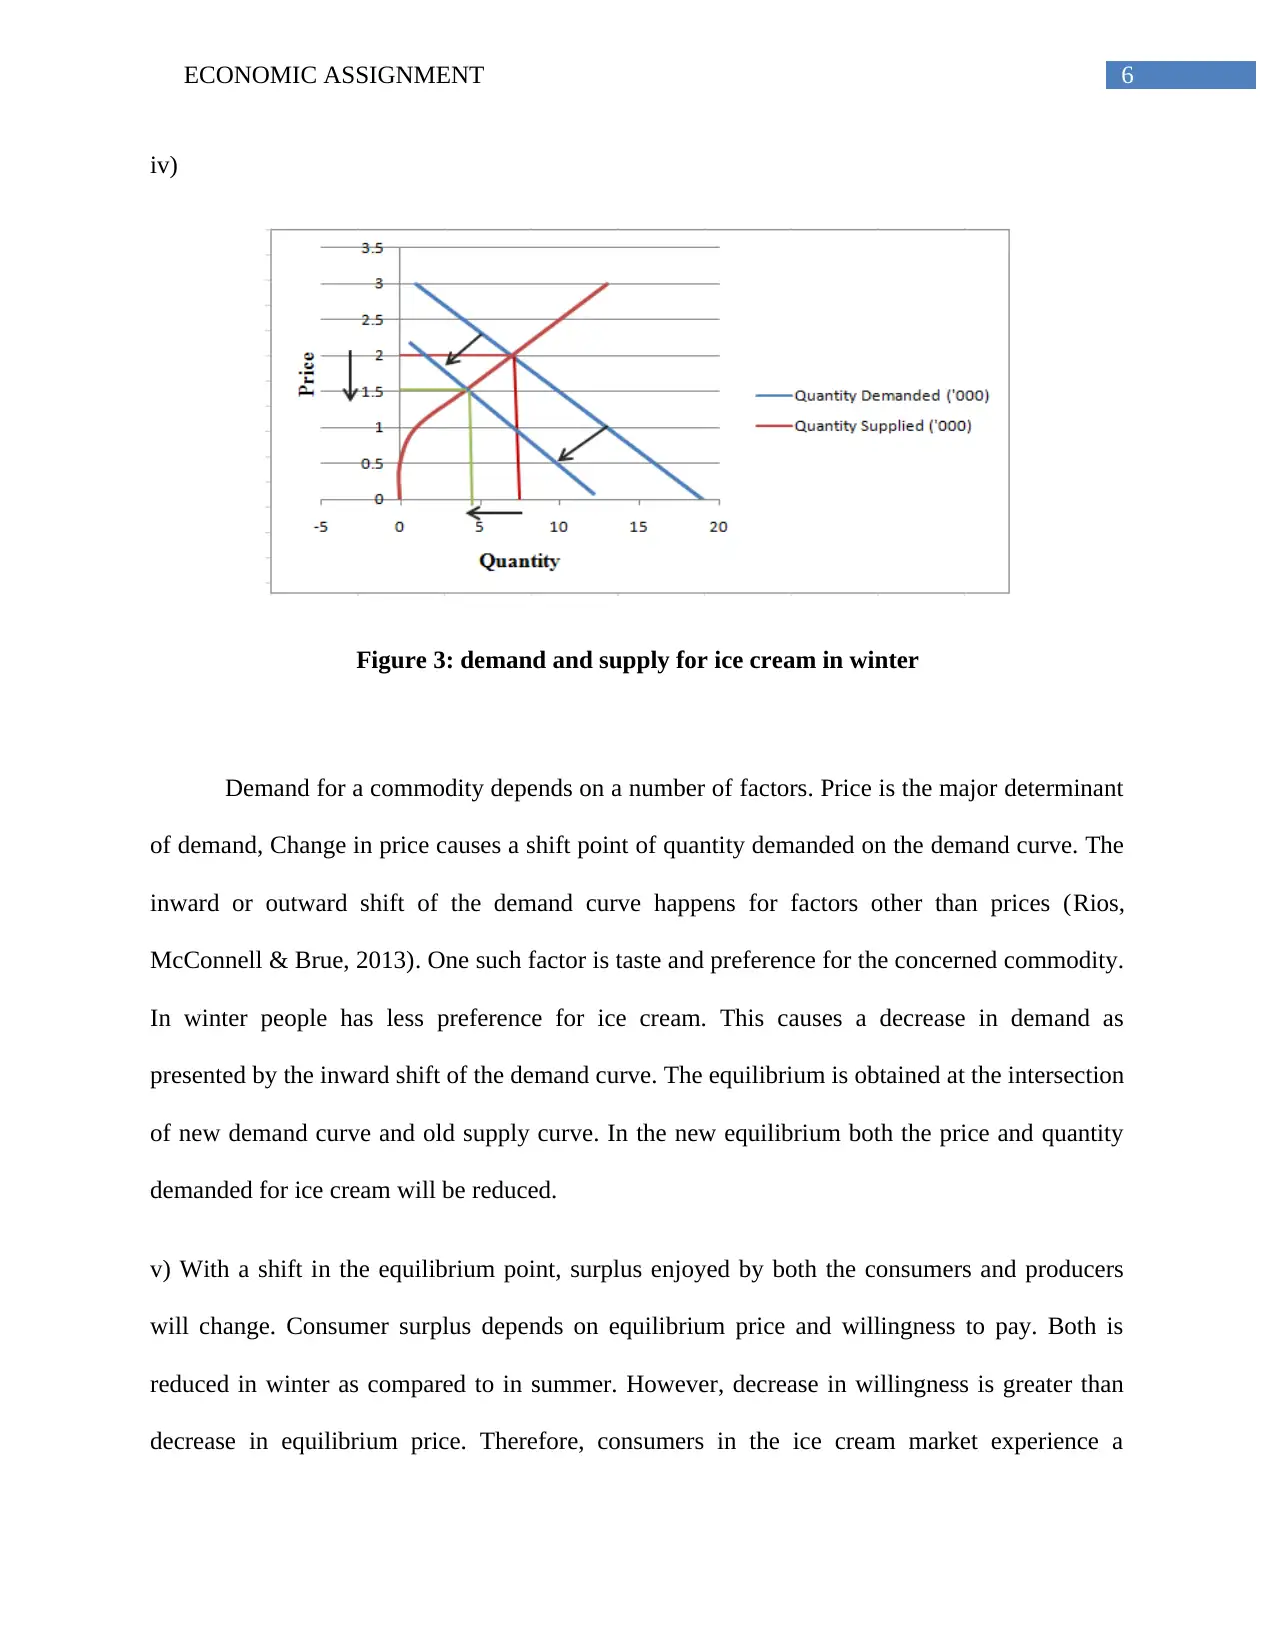
i)Price floor is a government interventionist measure to regulate price. In times of too low market
price government takes the support price policy (Case, Fair & Oster, 2014) The effect the policy
is explained in the following diagram.
Figure 4: Price floor policy in the market for milk
(Source: as created by the Author)
The demand and supply curve in the milk market is expressed by the curve DD and SS
respectively. Without any intervention price is P* and quantity sold in the market is Q*. Now
suppose government sets a price floor, which sets the market price at Pmin. At the increase price
reduction in consumer surplus. A reduction in equilibrium price along with change in the
willingness to supply reduces producer surplus as well.
Answer 3
i)Price floor is a government interventionist measure to regulate price. In times of too low market
price government takes the support price policy (Case, Fair & Oster, 2014) The effect the policy
is explained in the following diagram.
Figure 4: Price floor policy in the market for milk
(Source: as created by the Author)
The demand and supply curve in the milk market is expressed by the curve DD and SS
respectively. Without any intervention price is P* and quantity sold in the market is Q*. Now
suppose government sets a price floor, which sets the market price at Pmin. At the increase price
8ECONOMIC ASSIGNMENT
consumes decreases their demand whereas suppliers increase their supply. Consumers demanded
Qd amount of milk whereas in the market thee available supply is Qs.
ii)Price floor increase the price in the market. A higher price for the product increases revenue
earn from per unit of the product. This is likely to increase their income f it is possible to sell all
their product at the prevailing market price. Consumers in response to high price by shrinking
their demand as much as possible. Thus, fulfilling only the existing demand cannot assure the
farmers with an increased income.
iii) In order to assure the dairy farmers an increased income, government should purchase the
excess supplied quantity from the farmers. This costs heavily to the government. Government
can store this to the buffer stock. However, for non-durable goods like milk it is nit possible to
store for a long time. Thus, the government has to destroy it or sell it at a low price to elsewhere.
This ultimately causes a huge loss to the government. Therefore, it may not be a good decision to
purchase the entire surplus product. However, it increases income of the dairy farmers but
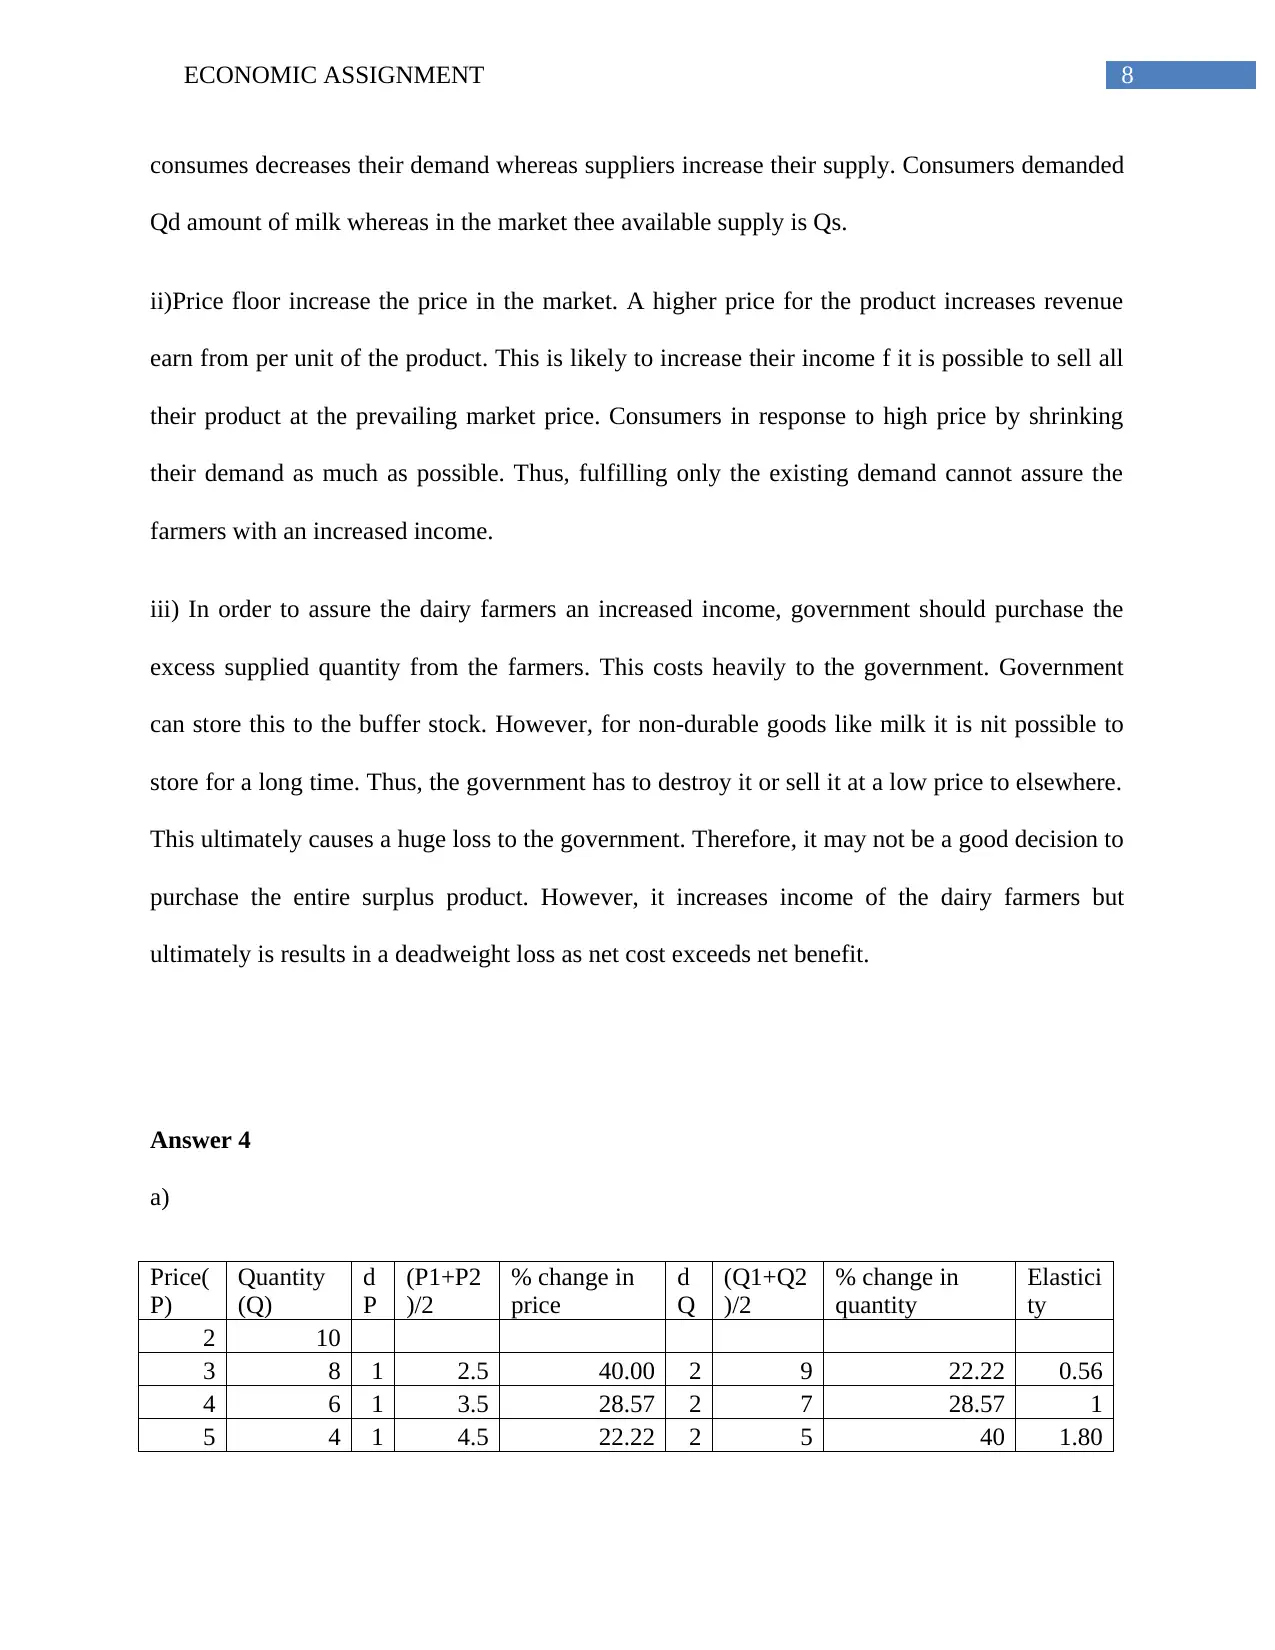
ultimately is results in a deadweight loss as net cost exceeds net benefit.
Answer 4
a)
Price(
P)
Quantity
(Q)
d
P
(P1+P2
)/2
% change in
price
d
Q
(Q1+Q2
)/2
% change in
quantity
Elastici
ty
2 10
3 8 1 2.5 40.00 2 9 22.22 0.56
4 6 1 3.5 28.57 2 7 28.57 1
5 4 1 4.5 22.22 2 5 40 1.80
consumes decreases their demand whereas suppliers increase their supply. Consumers demanded
Qd amount of milk whereas in the market thee available supply is Qs.
ii)Price floor increase the price in the market. A higher price for the product increases revenue
earn from per unit of the product. This is likely to increase their income f it is possible to sell all
their product at the prevailing market price. Consumers in response to high price by shrinking
their demand as much as possible. Thus, fulfilling only the existing demand cannot assure the
farmers with an increased income.
iii) In order to assure the dairy farmers an increased income, government should purchase the
excess supplied quantity from the farmers. This costs heavily to the government. Government
can store this to the buffer stock. However, for non-durable goods like milk it is nit possible to
store for a long time. Thus, the government has to destroy it or sell it at a low price to elsewhere.
This ultimately causes a huge loss to the government. Therefore, it may not be a good decision to
purchase the entire surplus product. However, it increases income of the dairy farmers but
ultimately is results in a deadweight loss as net cost exceeds net benefit.
Answer 4
a)
Price(
P)
Quantity
(Q)
d
P
(P1+P2
)/2
% change in
price
d
Q
(Q1+Q2
)/2
% change in
quantity
Elastici
ty
2 10
3 8 1 2.5 40.00 2 9 22.22 0.56
4 6 1 3.5 28.57 2 7 28.57 1
5 4 1 4.5 22.22 2 5 40 1.80
9ECONOMIC ASSIGNMENT
Price
($)
Quantity
demanded
Total
revenue
($)
Percent
change in
price
Percentage
change in
quantity
demanded
Elasticity Assessment of
Elasticity
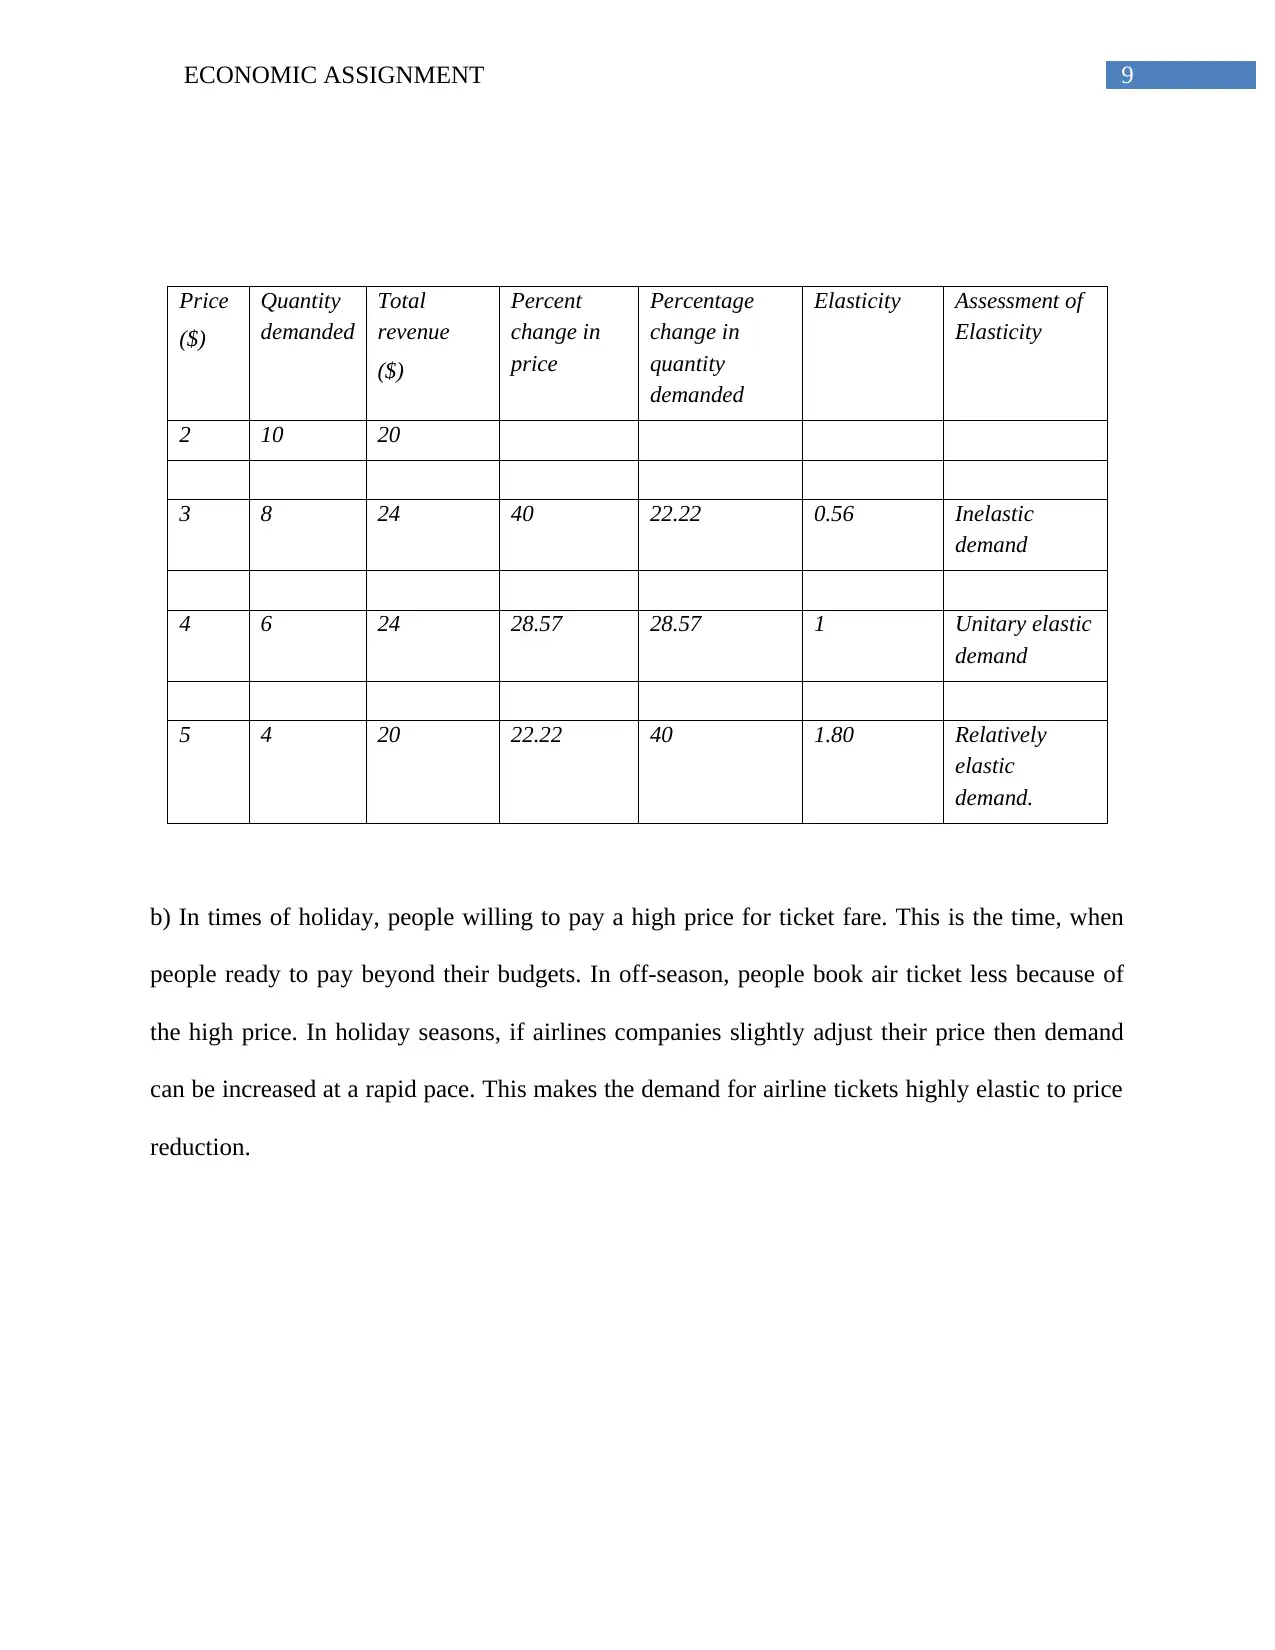
2 10 20
3 8 24 40 22.22 0.56 Inelastic
demand
4 6 24 28.57 28.57 1 Unitary elastic
demand
5 4 20 22.22 40 1.80 Relatively
elastic
demand.
b) In times of holiday, people willing to pay a high price for ticket fare. This is the time, when
people ready to pay beyond their budgets. In off-season, people book air ticket less because of
the high price. In holiday seasons, if airlines companies slightly adjust their price then demand
can be increased at a rapid pace. This makes the demand for airline tickets highly elastic to price
reduction.
Price
($)
Quantity
demanded
Total
revenue
($)
Percent
change in
price
Percentage
change in
quantity
demanded
Elasticity Assessment of
Elasticity
2 10 20
3 8 24 40 22.22 0.56 Inelastic
demand
4 6 24 28.57 28.57 1 Unitary elastic
demand
5 4 20 22.22 40 1.80 Relatively
elastic
demand.
b) In times of holiday, people willing to pay a high price for ticket fare. This is the time, when
people ready to pay beyond their budgets. In off-season, people book air ticket less because of
the high price. In holiday seasons, if airlines companies slightly adjust their price then demand
can be increased at a rapid pace. This makes the demand for airline tickets highly elastic to price
reduction.
Secure Best Marks with AI Grader
Need help grading? Try our AI Grader for instant feedback on your assignments.
10ECONOMIC ASSIGNMENT
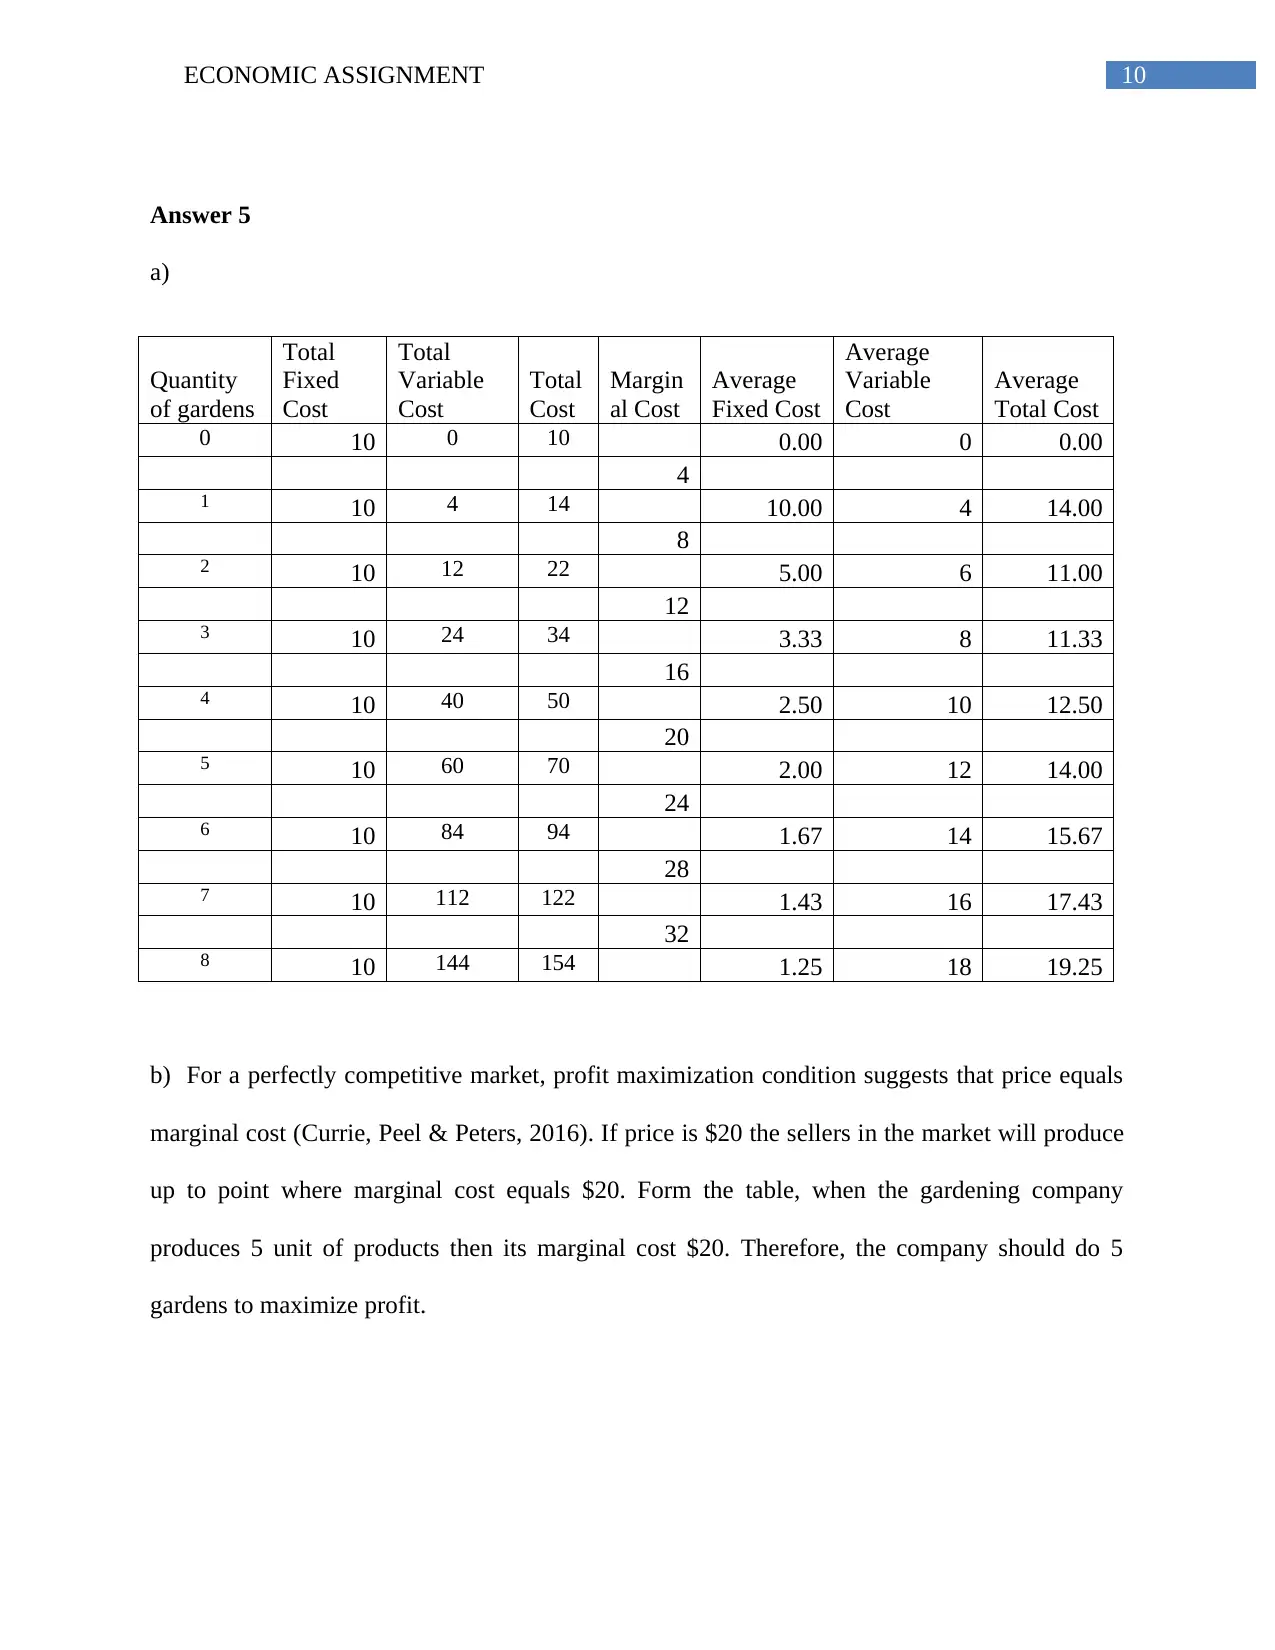
Answer 5
a)
Quantity
of gardens
Total
Fixed
Cost
Total
Variable
Cost
Total
Cost
Margin
al Cost
Average
Fixed Cost
Average
Variable
Cost
Average
Total Cost
0 10 0 10 0.00 0 0.00
4
1 10 4 14 10.00 4 14.00
8
2 10 12 22 5.00 6 11.00
12
3 10 24 34 3.33 8 11.33
16
4 10 40 50 2.50 10 12.50
20
5 10 60 70 2.00 12 14.00
24
6 10 84 94 1.67 14 15.67
28
7 10 112 122 1.43 16 17.43
32
8 10 144 154 1.25 18 19.25
b) For a perfectly competitive market, profit maximization condition suggests that price equals
marginal cost (Currie, Peel & Peters, 2016). If price is $20 the sellers in the market will produce
up to point where marginal cost equals $20. Form the table, when the gardening company
produces 5 unit of products then its marginal cost $20. Therefore, the company should do 5
gardens to maximize profit.
11ECONOMIC ASSIGNMENT
0 1 2 3 4 5 6 7 8 9
0
5
10
15
20
25
30
35
average variable cost
Average toital cost
Marginal cost
Output
Cost
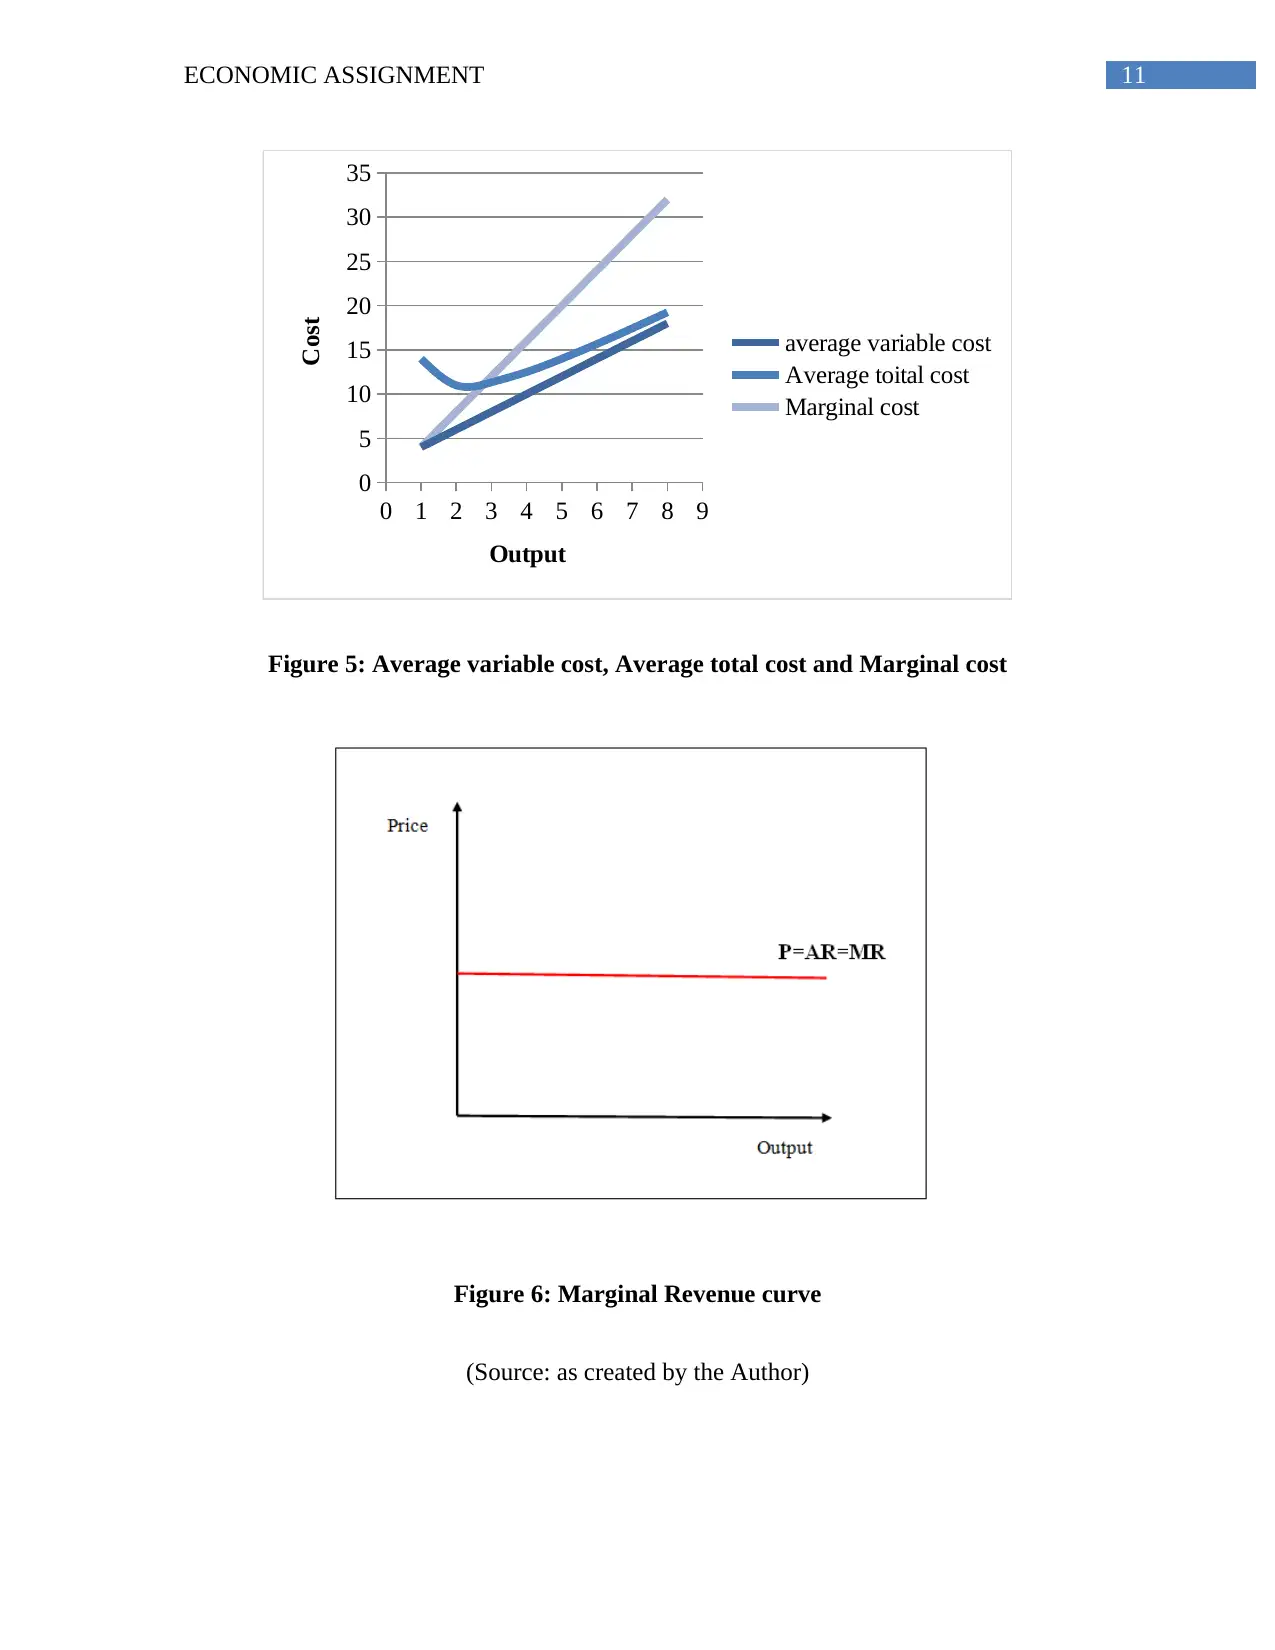
Figure 5: Average variable cost, Average total cost and Marginal cost
Figure 6: Marginal Revenue curve
(Source: as created by the Author)
0 1 2 3 4 5 6 7 8 9
0
5
10
15
20
25
30
35
average variable cost
Average toital cost
Marginal cost
Output
Cost
Figure 5: Average variable cost, Average total cost and Marginal cost
Figure 6: Marginal Revenue curve
(Source: as created by the Author)
12ECONOMIC ASSIGNMENT
References
Carlton, D. W., & Perloff, J. M. (2015). Modern industrial organization. Pearson Higher Ed.
Case, K.E., Fair, R.C. & Oster, S. (2014). Principles of economics. Pearson Higher Ed.
Currie, D., Peel, D., & Peters, W. (Eds.). (2016). Microeconomic Analysis (Routledge Revivals):
Essays in Microeconomics and Economic Development. Routledge.
Koo, B. H., & Perkins, D. H. (Eds.). (2016). Social capability and long-term economic growth.
Springer.
Krosch, A. R., & Amodio, D. M. (2014). Economic scarcity alters the perception of
race. Proceedings of the National Academy of Sciences, 111(25), 9079-9084.
Nicholson, W., & Snyder, C. M. (2014). Intermediate microeconomics and its application.
Cengage Learning.
Rios, M. C., McConnell, C. R., & Brue, S. L. (2013). Economics: Principles, problems, and
policies. McGraw-Hill.
Sutton, C. (2017). Introduction. In Britain’s Cold War in Cyprus and Hong Kong (pp. 1-14).
Springer International Publishing.
1 out of 13
Related Documents


Your All-in-One AI-Powered Toolkit for Academic Success.
+13062052269
info@desklib.com
Available 24*7 on WhatsApp / Email
![[object Object]](/_next/static/media/star-bottom.7253800d.svg)
Unlock your academic potential
© 2024 | Zucol Services PVT LTD | All rights reserved.