Economics 565 Assignment 2: Oaxaca Decomposition and Poverty Analysis

Verified

Added on  2022/08/12

|6
|904
|16
Homework Assignment
AI Summary
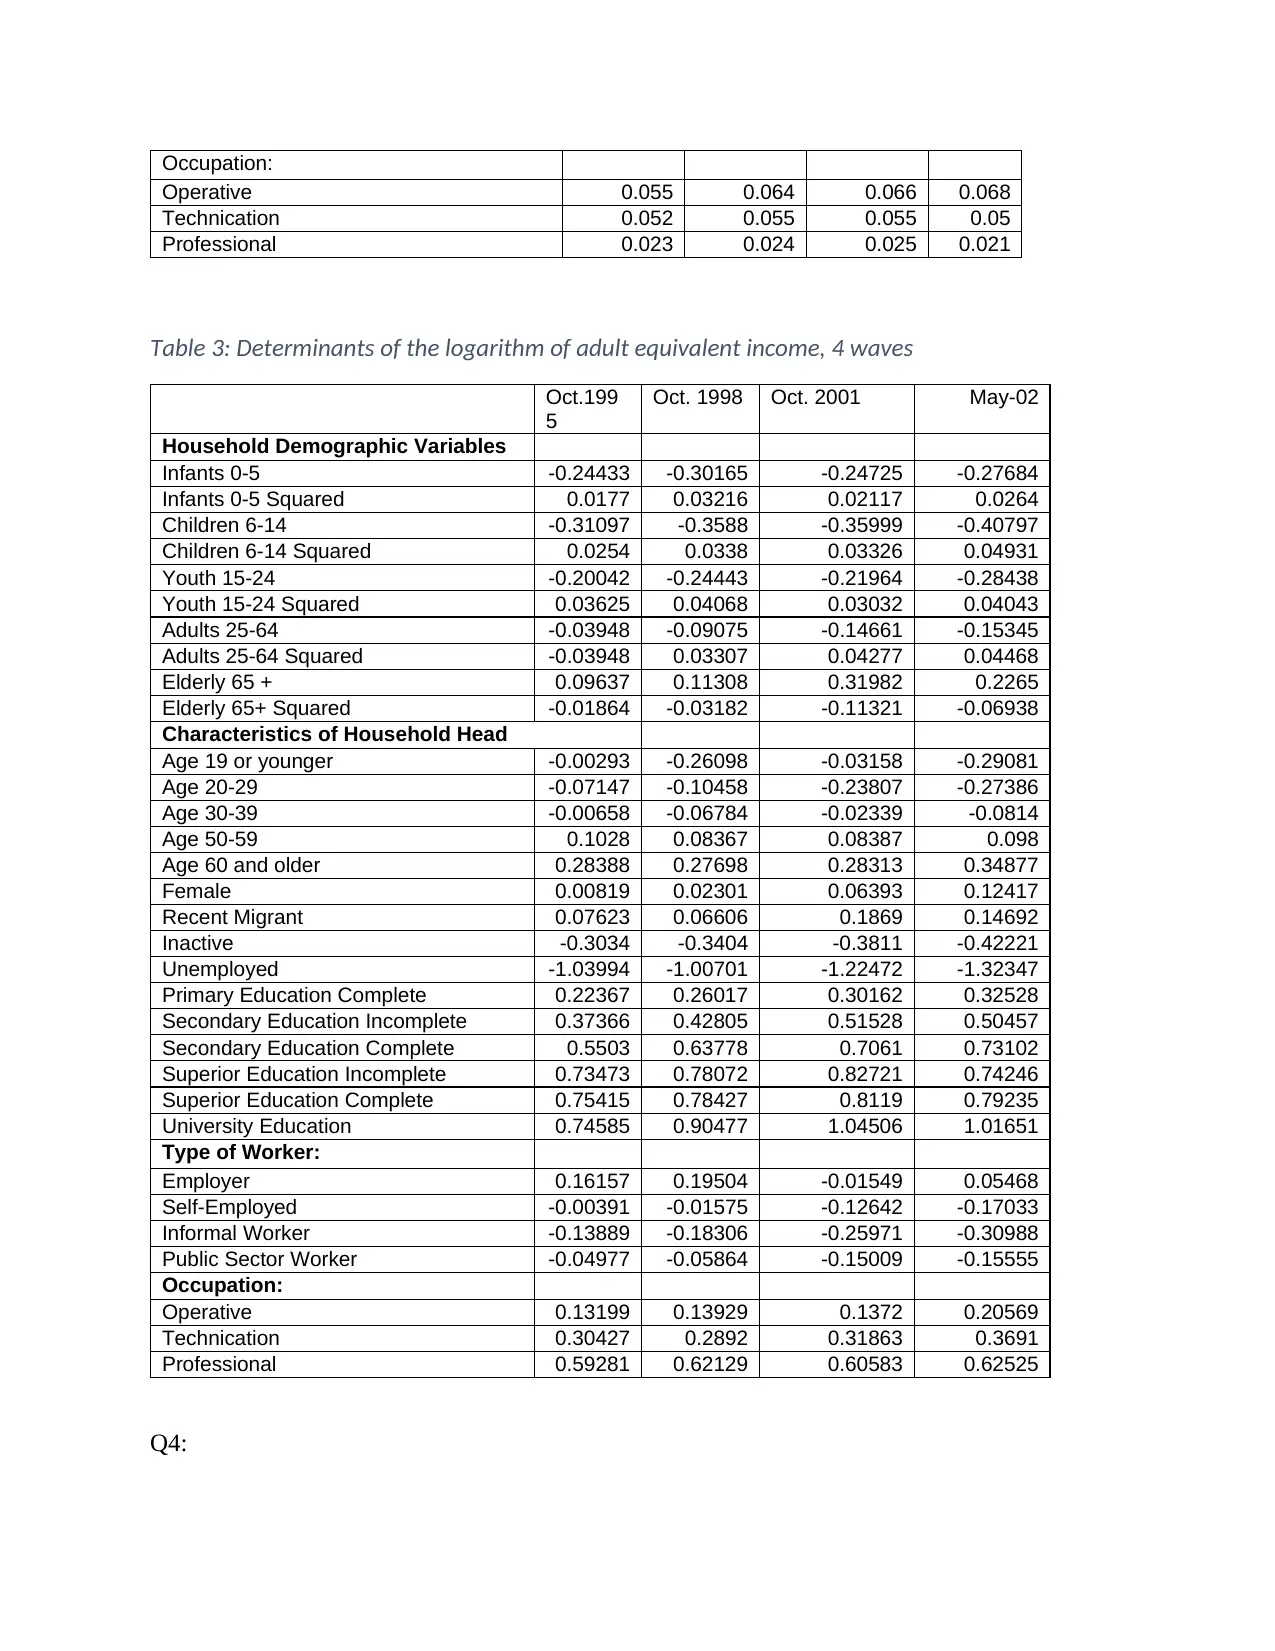
This econometrics assignment analyzes the effects of economic crises on poverty in urban Argentina using Oaxaca decomposition. The assignment evaluates the periods of October 1995-October 1998 and October 1998 October 2001, focusing on the impact of the crisis that began in 1998 and peaked in December 2001-January 2002. The solution addresses data issues, separates variables into household composition, head demographics, education, and labor market characteristics, and performs the Oaxaca decomposition. The analysis includes tables showing the means of variables, determinants of income changes, and the main determinants of income changes during the two periods. The solution emphasizes the role of household head employment status in predicting income levels and finds consistency with prior research on the crisis period.
Document Page
Econometrics
Student Name:
Instructor Name:
Course Number:
27th February 2020
tabler-icon-diamond-filled.svg

Paraphrase This Document

Need a fresh take? Get an instant paraphrase of this document with our AI Paraphraser
Document Page
Q1:
The problems with the data presented include;
1. The presented data is missing several important parameters that are necessary for making
a conclusive remark on the model. Among the missing parameters are;
ï‚· P-values to show the significant attributes
ï‚· The R-squared values to help show what proportion of the dependent variable is
explained by the independent variables.
ï‚· The F-statistics for the overall model significance.
ï‚· Standard errors for the independent variables
Q2:
Separating the Variables
Table 1: Separating the variables
Household Demographic Variables
Infants 0-5
Infants 0-5 Squared
Children 6-14
Children 6-14 Squared
Youth 15-24
Youth 15-24 Squared
Adults 25-64
Adults 25-64 Squared
Elderly 65 +
Elderly 65+ Squared
Characteristics of Household Head
Age 19 or younger
Age 20-29
Age 30-39
Age 50-59
Age 60 and older
Female
Recent Migrant
Inactive
Unemployed
Primary Education Complete
Document Page
Secondary Education Incomplete
Secondary Education Complete
Superior Education Incomplete
Superior Education Complete
University Education
Type of Worker:
Employer
Self-Employed
Informal Worker
Public Sector Worker
Occupation:
Operative
Technication
Professional
Characteristics of Spouse of Head
No Spouse
Inactive
Unemployed
Primary Education Complete
Secondary Education Complete
Secondary Education Incomplete
Superior Education Complete
Superior Education Incomplete
University Education
Type of Worker:
Employer
Self-Employed
Informal Worker
Public Sector Worker
Occupation:
Operative
Technication
Professional
Q3:
Oaxaca decomposition
This section presents the Oaxaca decomposition with the interaction aggregating to the groups in
part 2 above.
Table 2: Means of Variables used in the regression analysis
Oct.1995 Oct. 1998 Oct. 2001 May-02
Log Normalized Income 0.599 0.634 0.452 0.029
Normalized Income 2.863 3.033 2.771 1.975
Document Page
Household Demographic Variables
Infants 0-5 0.389 0.368 0.364 0.368
Infants 0-5 Squared 0.708 0.653 0.618 0.627
Children 6-14 0.587 0.571 0.579 0.572
Children 6-14 Squared 1.287 1.233 1.281 1.269
Youth 15-24 0.632 0.627 0.642 0.64
Youth 15-24 Squared 1.275 1.264 1.324 1.31
Adults 25-64 1.547 1.529 1.529 1.534
Adults 25-64 Squared 3.27 3.213 3.26 3.304
Elderly 65 + 0.357 0.348 0.345 0.346
Elderly 65+ Squared 0.532 0.52 0.512 0.517
Characteristics of Household Head
Age 19 or younger 0.005 0.005 0.006 0.006
Age 20-29 0.102 0.109 0.108 0.118
Age 30-39 0.21 0.195 0.196 0.192
Age 50-59 0.176 0.185 0.188 0.189
Age 60 and older 0.299 0.293 0.289 0.289
Female 0.246 0.266 0.287 0.287
Recent Migrant 0.061 0.056 0.055 0.053
Inactive 0.298 0.284 0.288 0.289
Unemployed 0.076 0.06 0.1 0.124
Primary Education Complete 0.34 0.313 0.315 0.311
Secondary Education Incomplete 0.258 0.174 0.162 0.163
Secondary Education Complete 0.152 0.152 0.17 0.173
Superior Education Incomplete 0.008 0.009 0.011 0.014
Superior Education Complete 0.028 0.027 0.034 0.035
University Education 0.137 0.156 0.159 0.162
Type of Worker:
Employer 0.039 0.036 0.032 0.024
Self-Employed 0.158 0.161 0.159 0.15
Informal Worker 0.242 0.256 0.256 0.251
Public Sector Worker 0.101 0.107 0.107 0.115
Occupation:
Operative 0.283 0.336 0.307 0.294
Technication 0.142 0.111 0.109 0.101
Professional 0.067 0.069 0.061 0.058
Characteristics of Spouse of Head
No Spouse 0.326 0.354 0.37 0.372
Inactive 0.414 0.387 0.361 0.367
Unemployed 0.044 0.029 0.039 0.041
Primary Education Complete 0.238 0.219 0.207 0.208
Secondary Education Complete 0.127 0.115 0.118 0.122
Secondary Education Incomplete 0.099 0.113 0.104 0.099
Superior Education Complete 0.033 0.033 0.041 0.041
Superior Education Incomplete 0.008 0.009 0.01 0.011
University Education 0.062 0.072 0.077 0.074
Type of Worker:
Employer 0.007 0.007 0.007 0.005
Self-Employed 0.055 0.058 0.051 0.049
Informal Worker 0.104 0.107 0.103 0.103
Public Sector Worker 0.049 0.054 0.056 0.057
tabler-icon-diamond-filled.svg

Paraphrase This Document

Need a fresh take? Get an instant paraphrase of this document with our AI Paraphraser
Document Page
Occupation:
Operative 0.055 0.064 0.066 0.068
Technication 0.052 0.055 0.055 0.05
Professional 0.023 0.024 0.025 0.021
Table 3: Determinants of the logarithm of adult equivalent income, 4 waves
Oct.199
5
Oct. 1998 Oct. 2001 May-02
Household Demographic Variables
Infants 0-5 -0.24433 -0.30165 -0.24725 -0.27684
Infants 0-5 Squared 0.0177 0.03216 0.02117 0.0264
Children 6-14 -0.31097 -0.3588 -0.35999 -0.40797
Children 6-14 Squared 0.0254 0.0338 0.03326 0.04931
Youth 15-24 -0.20042 -0.24443 -0.21964 -0.28438
Youth 15-24 Squared 0.03625 0.04068 0.03032 0.04043
Adults 25-64 -0.03948 -0.09075 -0.14661 -0.15345
Adults 25-64 Squared -0.03948 0.03307 0.04277 0.04468
Elderly 65 + 0.09637 0.11308 0.31982 0.2265
Elderly 65+ Squared -0.01864 -0.03182 -0.11321 -0.06938
Characteristics of Household Head
Age 19 or younger -0.00293 -0.26098 -0.03158 -0.29081
Age 20-29 -0.07147 -0.10458 -0.23807 -0.27386
Age 30-39 -0.00658 -0.06784 -0.02339 -0.0814
Age 50-59 0.1028 0.08367 0.08387 0.098
Age 60 and older 0.28388 0.27698 0.28313 0.34877
Female 0.00819 0.02301 0.06393 0.12417
Recent Migrant 0.07623 0.06606 0.1869 0.14692
Inactive -0.3034 -0.3404 -0.3811 -0.42221
Unemployed -1.03994 -1.00701 -1.22472 -1.32347
Primary Education Complete 0.22367 0.26017 0.30162 0.32528
Secondary Education Incomplete 0.37366 0.42805 0.51528 0.50457
Secondary Education Complete 0.5503 0.63778 0.7061 0.73102
Superior Education Incomplete 0.73473 0.78072 0.82721 0.74246
Superior Education Complete 0.75415 0.78427 0.8119 0.79235
University Education 0.74585 0.90477 1.04506 1.01651
Type of Worker:
Employer 0.16157 0.19504 -0.01549 0.05468
Self-Employed -0.00391 -0.01575 -0.12642 -0.17033
Informal Worker -0.13889 -0.18306 -0.25971 -0.30988
Public Sector Worker -0.04977 -0.05864 -0.15009 -0.15555
Occupation:
Operative 0.13199 0.13929 0.1372 0.20569
Technication 0.30427 0.2892 0.31863 0.3691
Professional 0.59281 0.62129 0.60583 0.62525
Q4:
Document Page
From the above table, the main determinants of income changes during the two periods seems to
be household head attributes especially whether the person is employed or unemployed. This
play a critical role in predicting the income level.
Q5:
It can clearly be seen that the findings from part 4) consistent with the conclusions in the article
by Cruces and Wodon about the crisis period 2001-2002.
chevron_up_icon
1 out of 6
circle_padding
hide_on_mobile
zoom_out_icon
[object Object]