Econometrics Project: Analyzing Pizza Hut Sales Prediction and Demand
VerifiedAdded on 2022/11/26
|10
|1393
|415
Project
AI Summary
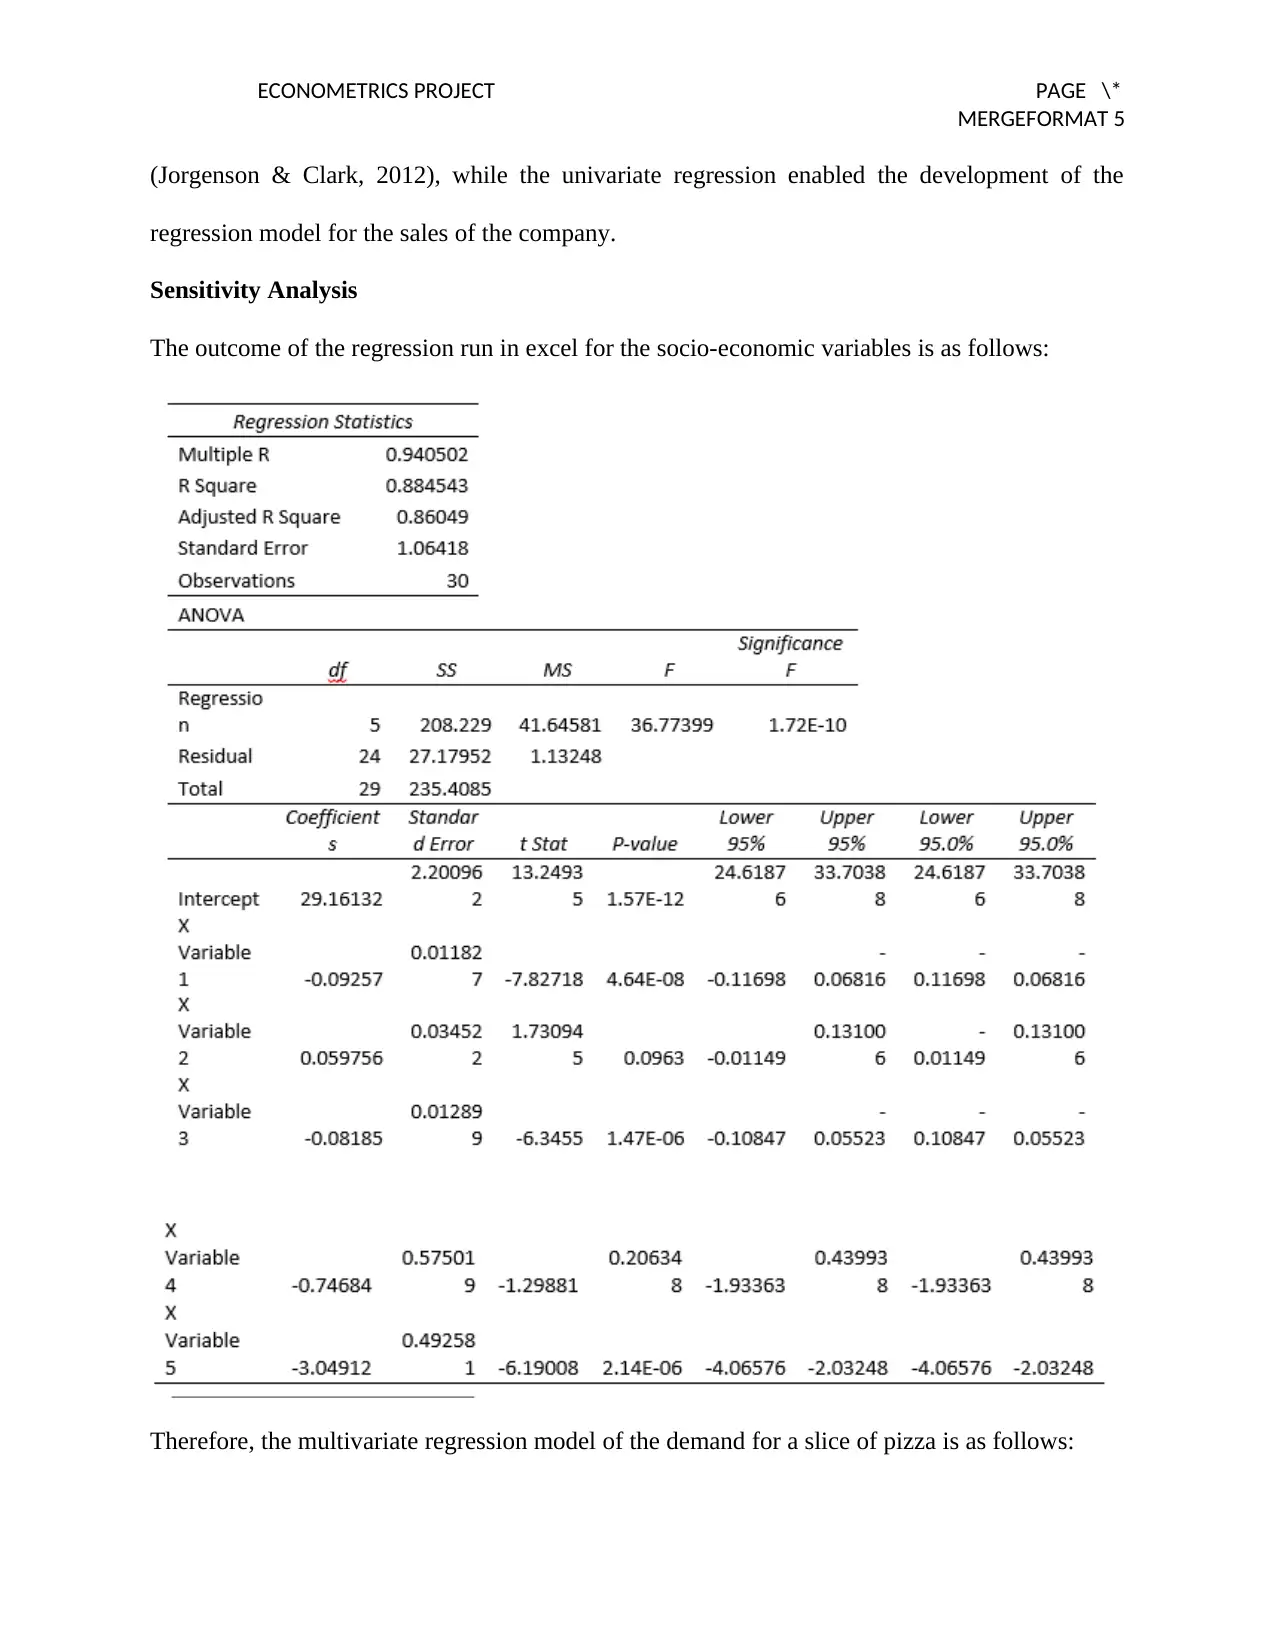
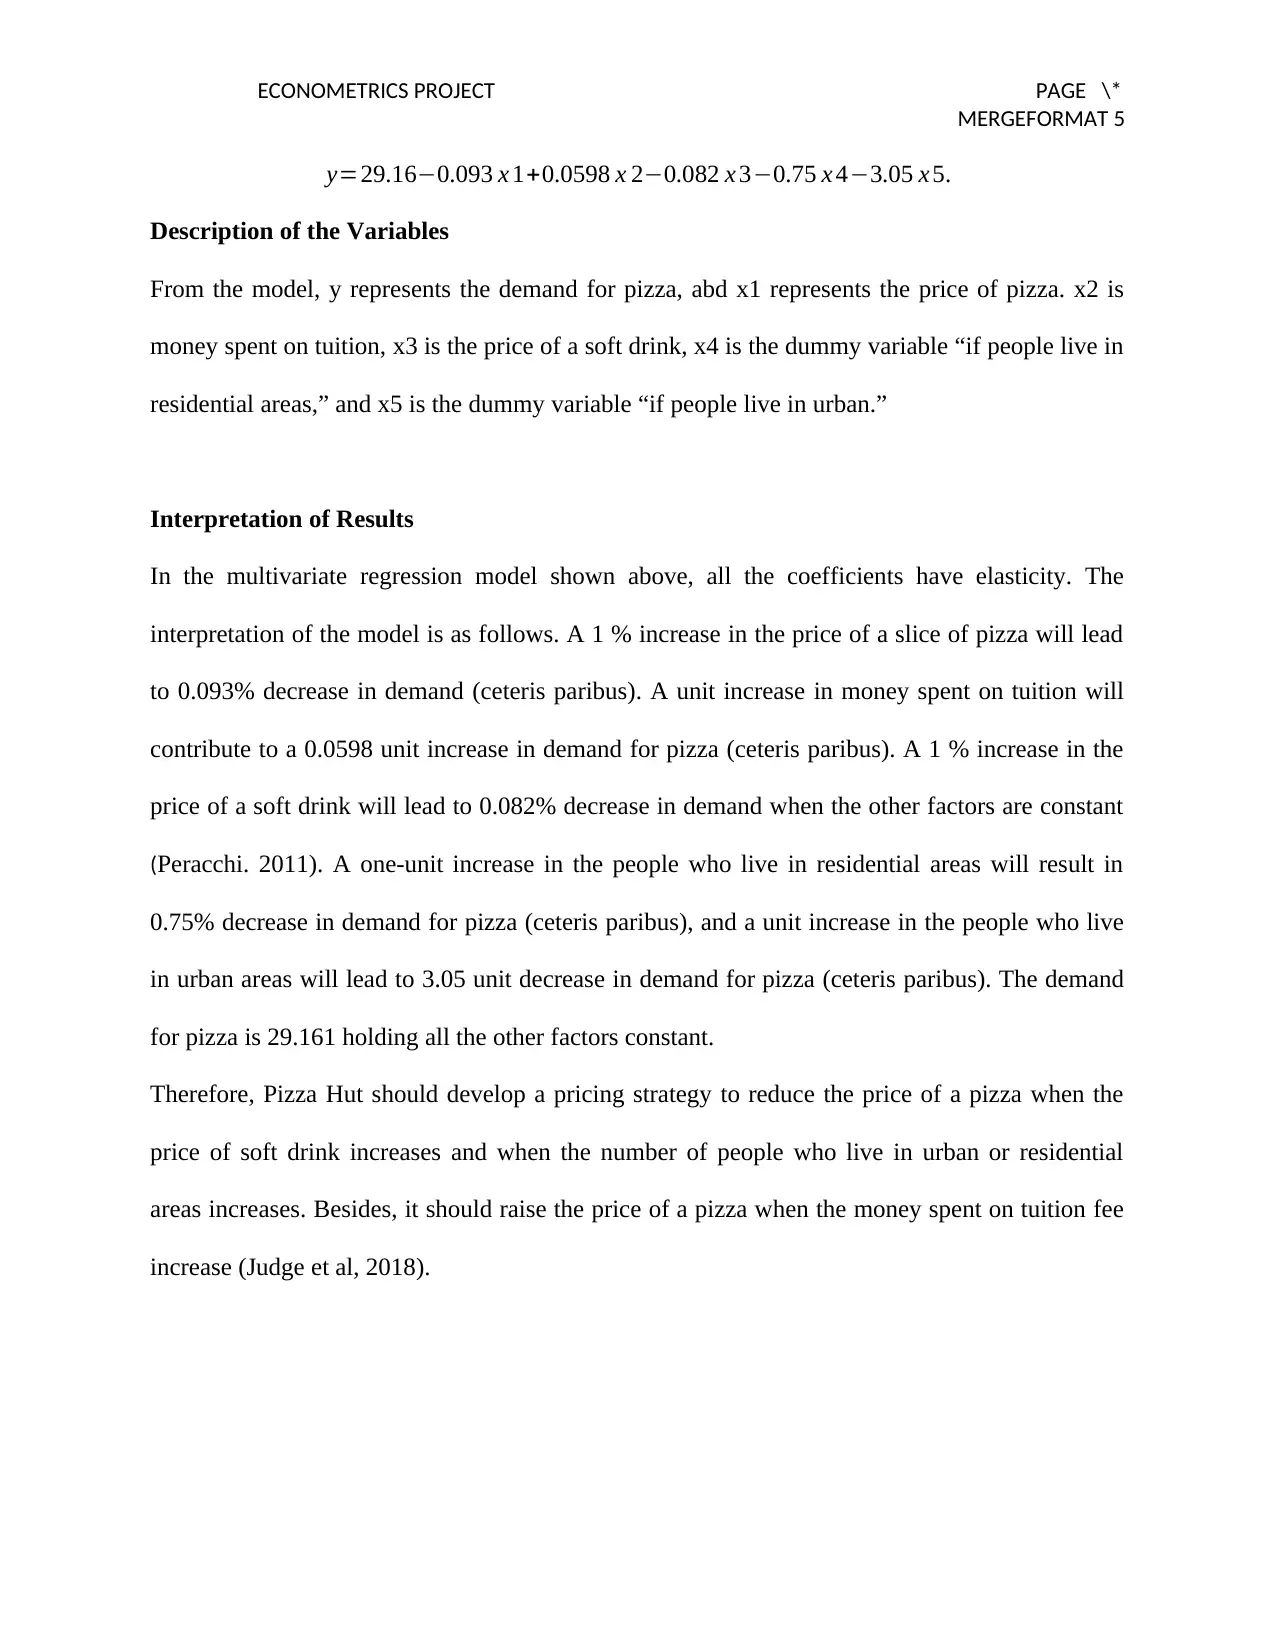
This econometrics project analyzes the sales and demand of Pizza Hut using econometric methods. The study employs both multivariate and univariate regression models to assess the impact of various socio-economic variables on pizza demand. Key factors investigated include the price of pizza, tuition fees, the price of soft drinks, and residential versus urban locations. The project presents a regression model derived from these variables and interprets the elasticity of each factor. The results indicate how changes in price, tuition, and location influence the demand for pizza. The project also examines the company's sales over time. The analysis uses data from various sources, including Bloomberg and Statista, to provide a comprehensive understanding of the Pizza Hut's market dynamics and offers insights for strategic pricing and marketing decisions.

Running head: ECONOMETRICS PROJECT PAGE \*
MERGEFORMAT 1
Econometrics Project
Student’s Name
Institutional Affiliation
MERGEFORMAT 1
Econometrics Project
Student’s Name
Institutional Affiliation
Paraphrase This Document
Need a fresh take? Get an instant paraphrase of this document with our AI Paraphraser

ECONOMETRICS PROJECT PAGE \*
MERGEFORMAT 5
Executive Summary
Econometrics is the application of mathematical and statistical theories in economics. It
enhances forecasting the future trends and hypothesis testing (Theil. 2013). It incorporates
economic models, analyzes them through statistical trials, and makes a comparison of the results
of the real-life examples (Kennedy, 2013). For instance, it is possible to generate a sales
prediction for a firm using econometric methods. The quantity demand depends on the average
price of a pizza per slice and the tuition fee Pizza Hut will spend on offering college degrees. It
will also rely on the mean price per soft drink, and if individuals are in residential or urban areas.
This paper analyzes the sales prediction made for a Pizza Hut using econometric methods. It also
analyzes the multivariate model constructed from the variables that affect the demand for a slice
of pizza.
Model Specification
The demand for a slice of pizza is affected by socio-economic variables such as the average price
per slice and soft drink. It is also affected by the tuition fee spent by the Pizza Hut to educate
undergraduates and the areas where people live such as residential and urban areas x (Hox et al.
2017). From the economics point of view, an increase in price per slice of pizza and soft drink
will decrease the demand for pizza and vice versa, because the increase in the price of a good
reduces the quantity demanded. Besides, money spent on tuition by Pizza Hut do not have a huge
effect on the demand for pizza. However, it may either increase demand or decrease demand.
Conversely, people living in urban areas will consume more pizza than the individuals living in
residential areas, because urban areas are highly populated. The average quantity demanded is

ECONOMETRICS PROJECT PAGE \*
MERGEFORMAT 5
treated as a dependent variable (Y). Other variables, which include price per pizza slice, tuition,
the price of a soft drink, and the residence are treated as independent variables (X variables).
The variables used in generating the sales forecast for Pizza Hut were the sales dealt with as the
independent variable (X), and the period “quarter” treated as the depended variable (Y). It is
clear that in every time, the sales of the firm may either increase or decrease.
Description of Pizza Hut
Pizza Hut started in 1958 in USA at a place called Witchitta, when two Brothers Frank and Dan
Carney started it. The company was the beginning of the largest Pizza in the globe, and in the
year 1973, Pizza Hut moved to the United Kingdom. What began as a single place for Pizza is
currently having above seven hundred Delivery outlets and Restaurants up and down the United
Kingdom (Mike & Slocum. 2013). The company is the best when it comes to providing quality
Pizza. The company initiated Cheesy Bites and Stuffed Crust and brought Deep Pan to the
United Kingdom. The company is still leading when it comes to the sale of quality Pizza
Model development
The multivariate regression model developed from the socio-economic variables was formulated
in Ms excel. The data on the quantity demanded, the price of pizza and soft drink, tuition, and the
place where people live “rural and residential areas” were obtained from a Pizza Hut. The
variable, “if people live in residential areas, or if people live in urban areas” were treated as
dummy variables.
The data on sales for the firm was obtained from Bloomberg. The multivariate regression on
Excel enabled the development of the regression model for the socio-economic model
⊘ This is a preview!⊘
Do you want full access?
Subscribe today to unlock all pages.

Trusted by 1+ million students worldwide

ECONOMETRICS PROJECT PAGE \*
MERGEFORMAT 5
(Jorgenson & Clark, 2012), while the univariate regression enabled the development of the
regression model for the sales of the company.
Sensitivity Analysis
The outcome of the regression run in excel for the socio-economic variables is as follows:
Therefore, the multivariate regression model of the demand for a slice of pizza is as follows:
Paraphrase This Document
Need a fresh take? Get an instant paraphrase of this document with our AI Paraphraser

ECONOMETRICS PROJECT PAGE \*
MERGEFORMAT 5
y=29.16−0.093 x 1+0.0598 x 2−0.082 x 3−0.75 x 4−3.05 x 5.
Description of the Variables
From the model, y represents the demand for pizza, abd x1 represents the price of pizza. x2 is
money spent on tuition, x3 is the price of a soft drink, x4 is the dummy variable “if people live in
residential areas,” and x5 is the dummy variable “if people live in urban.”
Interpretation of Results
In the multivariate regression model shown above, all the coefficients have elasticity. The
interpretation of the model is as follows. A 1 % increase in the price of a slice of pizza will lead
to 0.093% decrease in demand (ceteris paribus). A unit increase in money spent on tuition will
contribute to a 0.0598 unit increase in demand for pizza (ceteris paribus). A 1 % increase in the
price of a soft drink will lead to 0.082% decrease in demand when the other factors are constant
(Peracchi. 2011). A one-unit increase in the people who live in residential areas will result in
0.75% decrease in demand for pizza (ceteris paribus), and a unit increase in the people who live
in urban areas will lead to 3.05 unit decrease in demand for pizza (ceteris paribus). The demand
for pizza is 29.161 holding all the other factors constant.
Therefore, Pizza Hut should develop a pricing strategy to reduce the price of a pizza when the
price of soft drink increases and when the number of people who live in urban or residential
areas increases. Besides, it should raise the price of a pizza when the money spent on tuition fee
increase (Judge et al, 2018).

ECONOMETRICS PROJECT PAGE \*
MERGEFORMAT 5
http://www.annualreports.com/HostedData/AnnualReportArchive/y/NYSE_YUM_2008.pdf
MERGEFORMAT 5
http://www.annualreports.com/HostedData/AnnualReportArchive/y/NYSE_YUM_2008.pdf
⊘ This is a preview!⊘
Do you want full access?
Subscribe today to unlock all pages.

Trusted by 1+ million students worldwide

ECONOMETRICS PROJECT PAGE \*
MERGEFORMAT 5
https://www.statista.com/statistics/205797/pizza-hut-sales-per-system-unit-since-2006/
The outcome of the regression run in excel for the firm’s sales is as follows.
MERGEFORMAT 5
https://www.statista.com/statistics/205797/pizza-hut-sales-per-system-unit-since-2006/
The outcome of the regression run in excel for the firm’s sales is as follows.
Paraphrase This Document
Need a fresh take? Get an instant paraphrase of this document with our AI Paraphraser

ECONOMETRICS PROJECT PAGE \*
MERGEFORMAT 5
MERGEFORMAT 5

ECONOMETRICS PROJECT PAGE \*
MERGEFORMAT 5
The univariate regression model is y=−21.7335+0.03264 x , where y is the quarter and x is the
value of sales. Henceforth, holding sales constant, the time period in quarter will decrease by
21.7335. Besides, an increase in sales by one unit will lead to a 0.0326 increase in quarterly
period. The elasticity of sales with respect to time is estimated as follows.
∑
sales ,time
¿ dtime
dsales × sales
time . If time is 25 quarter and sales are 1255, elasticity of sales will be
∑
sales ,time
¿ 0.0326 × 1255
25 =1.637 . When performing focus, we can predict the value of y for any
given value of x (Hox et al. 2017).
⊘ This is a preview!⊘
Do you want full access?
Subscribe today to unlock all pages.

Trusted by 1+ million students worldwide

ECONOMETRICS PROJECT PAGE \*
MERGEFORMAT 5
References
Hox, J. J., Moerbeek, M., & Van de Schoot, R. (2017). Multilevel analysis: Techniques and
applications. Routledge.
Jorgenson, A. K., & Clark, B. (2012). Are the economy and the environment decoupling? A
comparative international study, 1960–2005. American Journal of Sociology, 118(1), 1-
44.
Judge, G. G., Hill, R. C., Griffiths, W. E., Lütkepohl, H., & Lee, T. C. (2018). Introduction to the
Theory and Practice of Econometrics.
Kennedy, P. (2013). A guide to econometrics. Malden (Mass.): Blackwell Publishing.
Mike, B., & Slocum, J. W. (2013). Changing Culture at Pizza Hut and Yum! Brands,
Inc. Organizational Dynamics, 32, 319-330.
Peracchi, F. (2012). Econometrics review course: Microeconometrics.
Theil, H. (2013). Principles of econometrics (Vol. 4). New York: Wiley.
Sales per unit of Pizza Hut in the U.S. 2006-2017 | Statista. (2019). Retrieved from
https://www.statista.com/statistics/205797/pizza-hut-sales-per-system-unit-since-2006/
http://www.annualreports.com/HostedData/AnnualReportArchive/y/NYSE_YUM_2008.pdf
https://www.statista.com/statistics/205797/pizza-hut-sales-per-system-unit-since-2006/
1 out of 10
Your All-in-One AI-Powered Toolkit for Academic Success.
+13062052269
info@desklib.com
Available 24*7 on WhatsApp / Email
Unlock your academic potential
Copyright © 2020–2026 A2Z Services. All Rights Reserved. Developed and managed by ZUCOL.