Ask a question from expert
Econometrics Assignment Solution
18 Pages1742 Words129 Views
Added on 2020-10-05
Econometrics Assignment Solution
Added on 2020-10-05
BookmarkShareRelated Documents
ECONOMETRICS
TABLE OF CONTENTSQUESTION 1: RENTALASSESSMENT.......................................................................................1a. Regressing Rental and IC.............................................................................................................1b. Exhibit heteroscedasticity.......................................................................................................2c. Normal distribution of Rental and INC...................................................................................3d. Residuals in model are normally distributed...........................................................................4e. Model misspecification...........................................................................................................6QUESTION 2: RENTALASSESSMENT.......................................................................................7a. Regressing logwage on logiq..................................................................................................7b. Exhibit heteroscedasticity.......................................................................................................8c. Normally distributed of LOGRENTAL and LOGINC...........................................................9d. Normally distributed of residuals.........................................................................................10e. Model specification...............................................................................................................11QUESTION 3: EXAM SUCCESS................................................................................................11a. Regressing exam score on class hours along with estimating and interpreting coefficient. .11b. Testing hypothesis that exam score is not related to home hours.........................................12c. Regressing exam score on class hours and home work.........................................................12d. Amount of variation in Exam score across students by home work and class hours............13e. Estimate of coefficient is different in (a) and (c)..................................................................13f. Advice to students to attend class and home work................................................................13g. Variables must be included in regression..............................................................................14QUESTION 4: MARKET ASSESSMENT...................................................................................14a. Regressing Log price and Friday...........................................................................................14b. Predicted values purports for represent.................................................................................14c. Estimate response of consumer demand to change in log price............................................14d. Is equation identified.............................................................................................................15
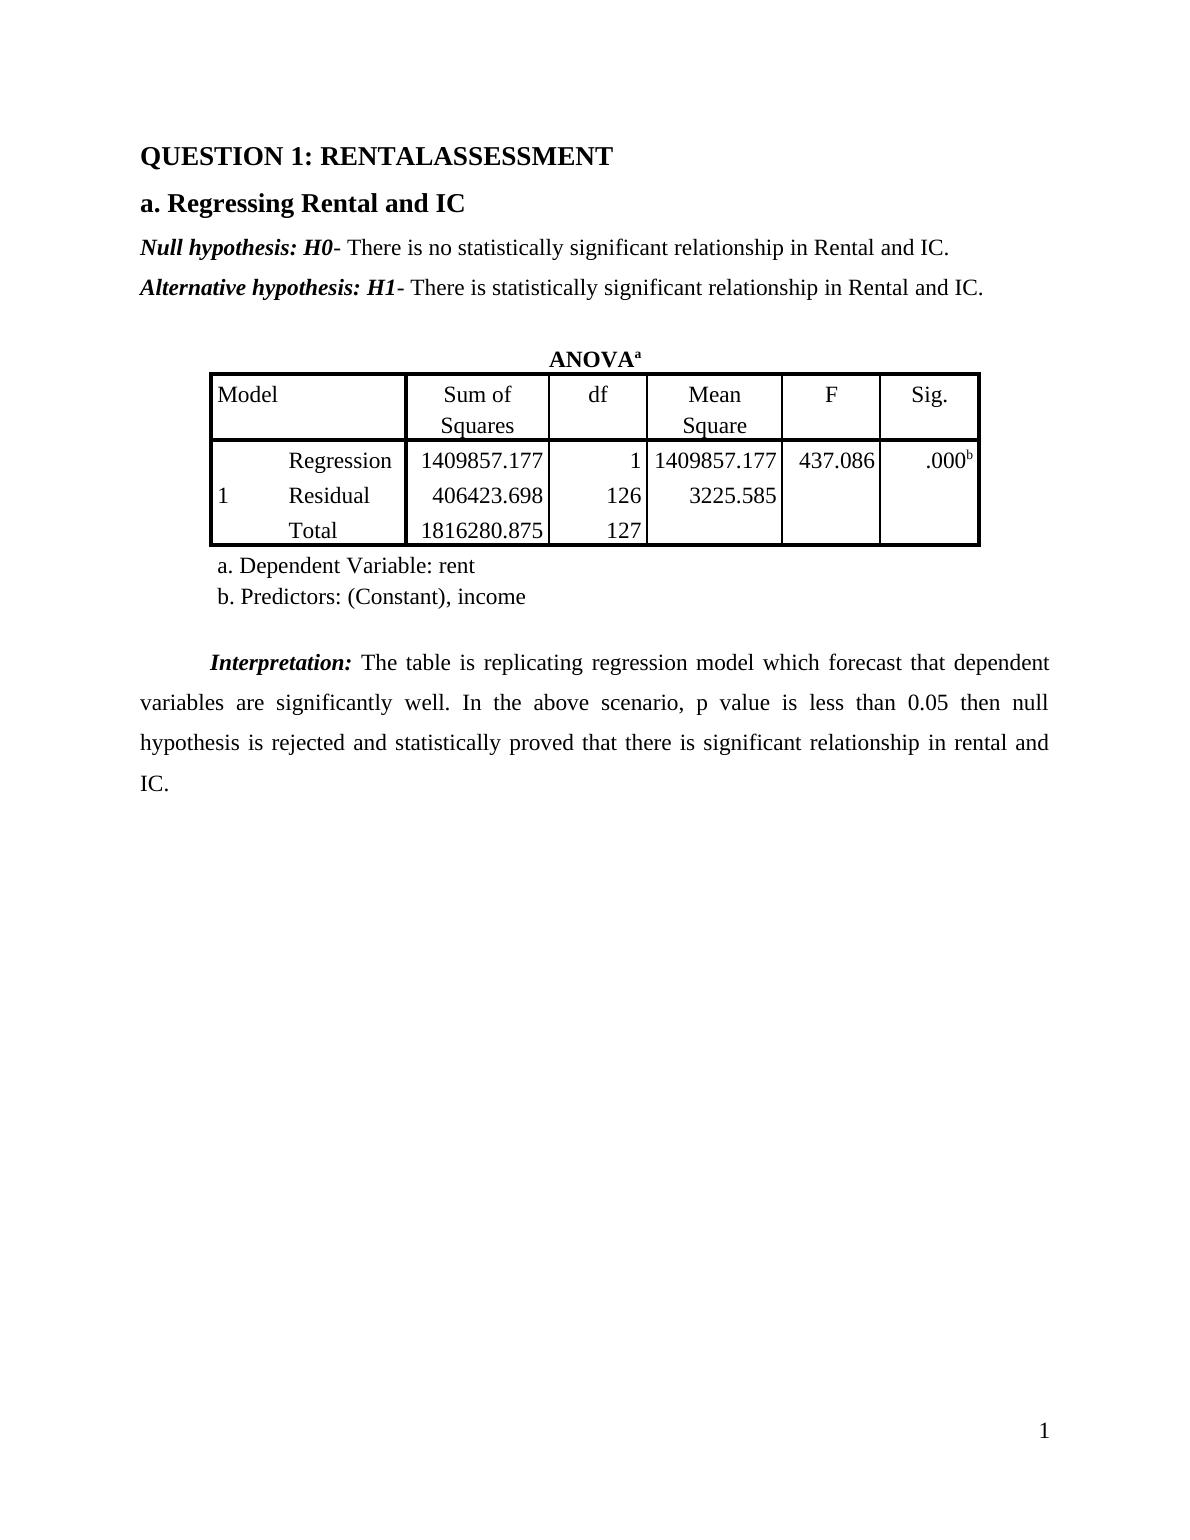
QUESTION 1: RENTALASSESSMENTa. Regressing Rental and ICNull hypothesis: H0- There is no statistically significant relationship in Rental and IC.Alternative hypothesis: H1- There is statistically significant relationship in Rental and IC.ANOVAaModelSum ofSquaresdfMeanSquareFSig.1Regression1409857.17711409857.177437.086.000bResidual406423.6981263225.585Total1816280.875127a. Dependent Variable: rentb. Predictors: (Constant), incomeInterpretation: The table is replicating regression model which forecast that dependentvariables are significantly well. In the above scenario, p value is less than 0.05 then nullhypothesis is rejected and statistically proved that there is significant relationship in rental andIC.1
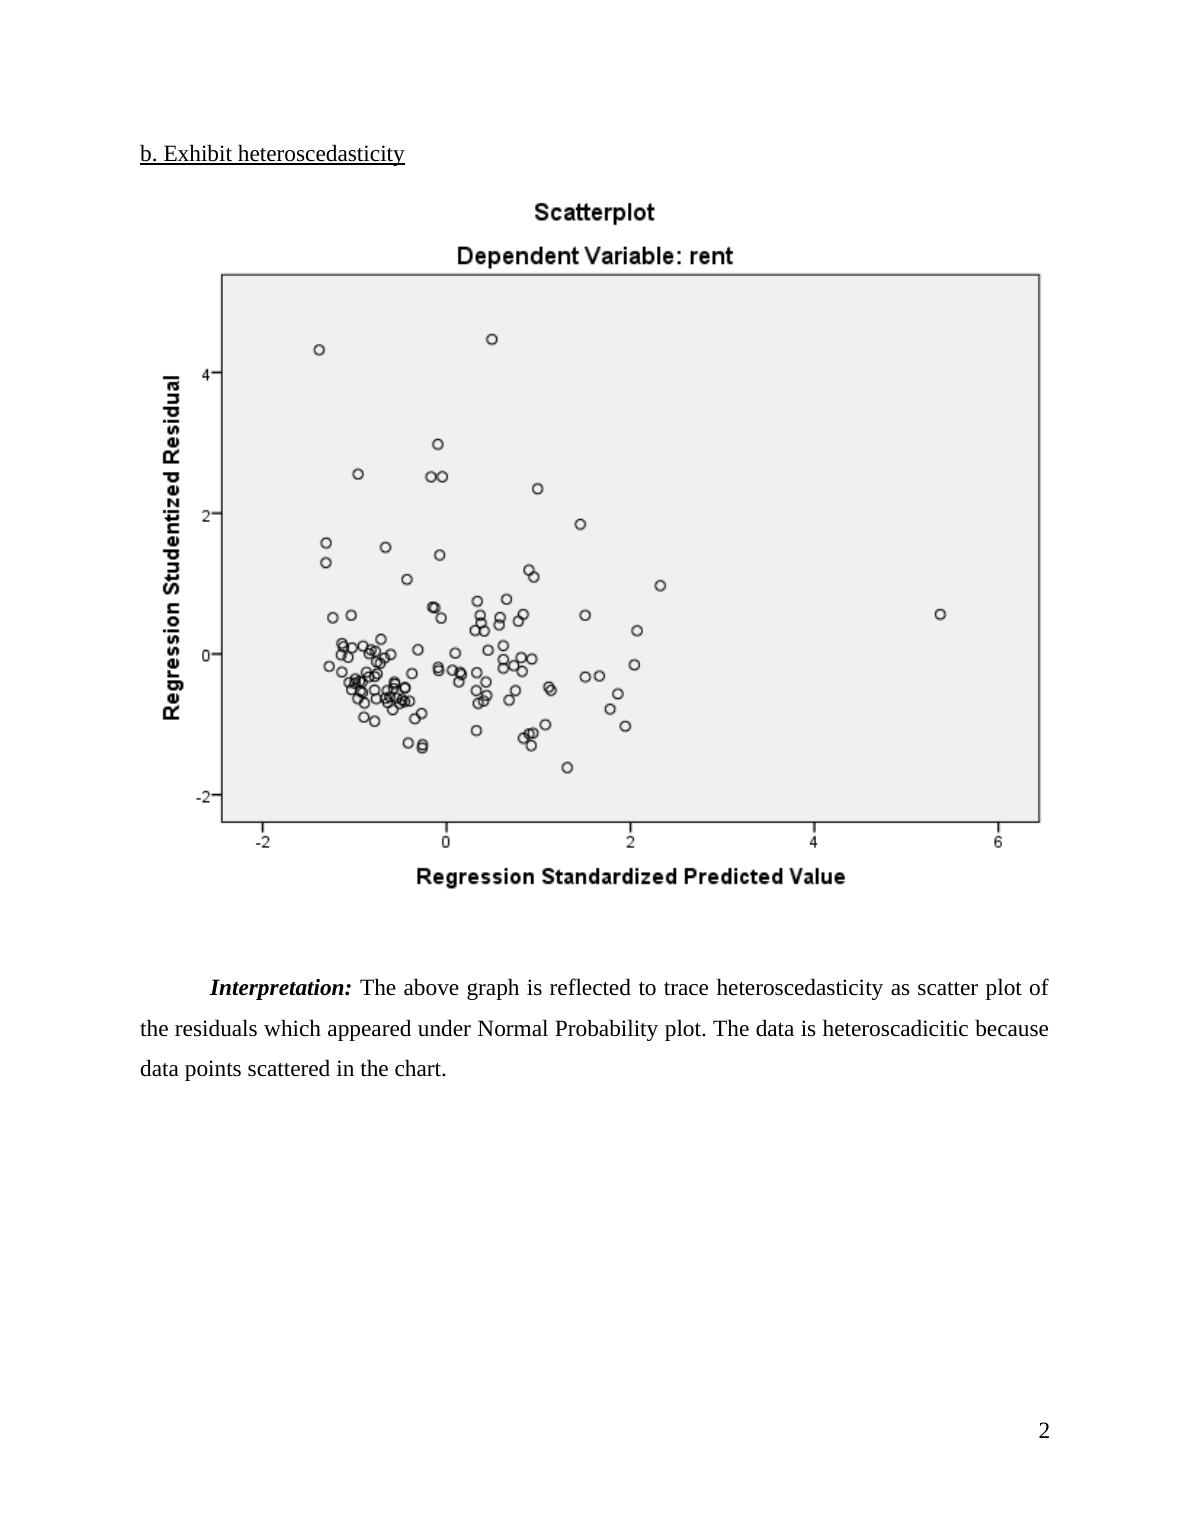
b. Exhibit heteroscedasticityInterpretation: The above graph is reflected to trace heteroscedasticity as scatter plot ofthe residuals which appeared under Normal Probability plot. The data is heteroscadicitic becausedata points scattered in the chart.2
End of preview
Want to access all the pages? Upload your documents or become a member.
Related Documents
Assignment definition and meaning | Assignmentlg...
|8
|1142
|21
Data Analysis: Assignmentlg...
|16
|2057
|325
Statistical Project Assignment for ECON7300lg...
|10
|1167
|463
Tutor-marked Exercise 4: Computer Sectionlg...
|33
|801
|100
Developing Strong Knowledge of Statistical Toolslg...
|23
|4103
|26
Quantitative Finance & Financial Markets: Assignmentlg...
|22
|3881
|34