Economic Analysis of Solar PV Uptake in New Zealand: A Regional Study
VerifiedAdded on 2020/05/11
|15
|4208
|57
Report
AI Summary
This report presents an economic analysis of grid-connected residential solar photovoltaic (PV) systems in three New Zealand cities: Southland, Tasman, and Northland. The study evaluates the economic viability of solar PV, considering factors such as initial investment, operation and maintenance costs, system lifespan, discount rates, and Levelized Cost of Energy (LCOE). The analysis includes scenarios with and without battery systems and examines various PV system sizes. The report calculates Net Present Value (NPV) and LCOE to assess the financial benefits of solar PV, including carbon dioxide reduction, grid benefits, and sensitivity analyses based on future PV prices. The findings offer insights into the economic feasibility of solar PV adoption across different regions of New Zealand.
Economic analysis of Solar PV Uptake in
New-Zealand
1
New-Zealand
1
Paraphrase This Document
Need a fresh take? Get an instant paraphrase of this document with our AI Paraphraser
Executive Summary
This report is based on a detailed economic analysis of grid connected, residential
solar photo voltaic systems in three different cities in New Zealand. The cities chosen for
carrying out such a study are Southland, Tasman and Northland as they are located in the
southern, northern and central parts of New Zealand and all of them have different values of
irradiance and the hours of sunlight in these places are also different. The analysis have been
made by both considering and not considering battery systems. Three different sizes of Photo
voltaic systems have been considered. The economic parameters that have been considered
for making the analyses are the initial investment or capital cost required to setup a solar PV
system, operation and maintenance cost of the systems considered, total life of operation of
the system, discount rates given to such system and Levelized Cost of Energy(LCOE)
calculation. Some of the other economic benefits obtained by using solar PV systems like
carbon dioxide reduction are also discussed in the report. Sensitivity analysis on the basis of
future PV system prices and carbon dioxide reduction benefits, grid benefits and so on are
also evaluated in the report.
2

Table of Contents
Sl. No. Contents Pg. No.
1 Executive Summary 2
2 Abstract 4
3 Introduction 4
4 Economic Parameters Evaluated 5
5 Assumptions 7
6 Calculations 8
7 Discussion 9
8 Other Economic Benefits 10
9 Conclusion 11
10 References 12
3
Sl. No. Contents Pg. No.
1 Executive Summary 2
2 Abstract 4
3 Introduction 4
4 Economic Parameters Evaluated 5
5 Assumptions 7
6 Calculations 8
7 Discussion 9
8 Other Economic Benefits 10
9 Conclusion 11
10 References 12
3
⊘ This is a preview!⊘
Do you want full access?
Subscribe today to unlock all pages.
Trusted by 1+ million students worldwide
Abstract
Responding to the overall troubles of keeping up essentialness security while
combatting natural change, the New Zealand government has issued a goal of creating 90%
of the country's energy needs from supportable sources by 2025. With a considerable amount
of New Zealand's age starting at now gave by hydro, geothermal and wind, questions stay in
regards to whether this goal should be refined by more by and large grasping solar Photo
Voltaic (PV) into the essentialness mix.
Following from past GREEN Grid investigate into the take-up of solar PV in New
Zealand, this paper considers the monetary issues of PV age at a grouping of scales: private
roof; business rooftop; and ground-mount utility. For each scale, set apart down cash streams
were used to overview system costs and budgetary returns, and levelized cost of essentialness
used to differentiate and distinctive wellsprings of age.
This project evaluates the economics involved in setting up and maintaining a solar
PV system. It helps in evaluating the profit or loss generated by setting up a solar PV system.
The project also evaluates other economic benefits of setting a solar PV system. The detailed
results are presented in the paper.
Introduction
Solar generation makes up only 0.1% of our total manageable power source. Price
diminishments in solar Photo Voltaic (PV) equipment have made it all the more outstanding
with contract holders and associations, disregarding the path that for most it remains costlier
than system gave control (Electricity Authority, 2017).
Solar PV is seen as a 'troublesome development' as it challenges the customary model
of energy game plan. Close by other dangerous developments, (for instance, advanced
metering, savvy contraptions, moved batteries) it's presumably going to add to changes in
essentialness exhibit design, imperativeness approach and assessing structures later on
(Wood, Miller and Claridge, 2013).
On account of private age, there is a noteworthy distinction in the estimation of
vitality which is privately expended versus that which is framework traded. Therefore, the
4
Paraphrase This Document
Need a fresh take? Get an instant paraphrase of this document with our AI Paraphraser
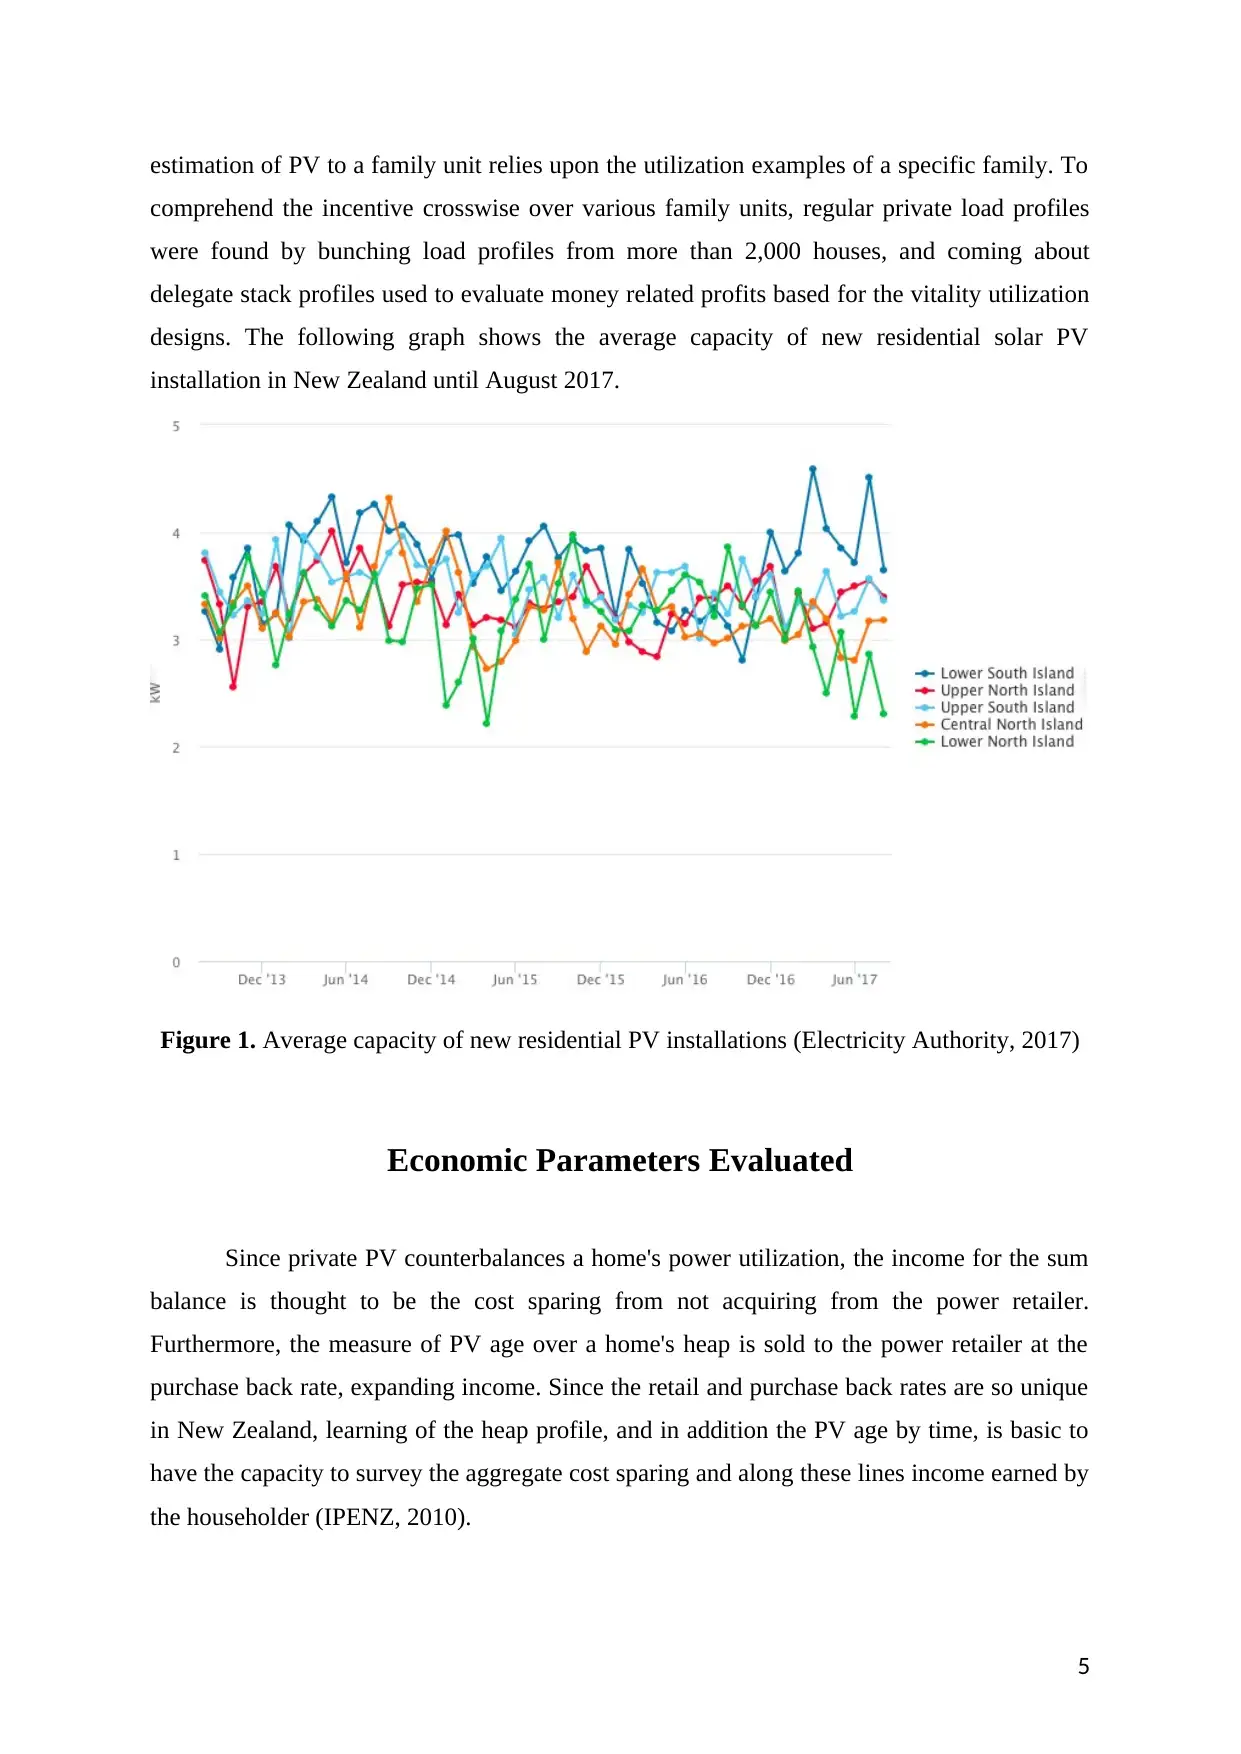
estimation of PV to a family unit relies upon the utilization examples of a specific family. To
comprehend the incentive crosswise over various family units, regular private load profiles
were found by bunching load profiles from more than 2,000 houses, and coming about
delegate stack profiles used to evaluate money related profits based for the vitality utilization
designs. The following graph shows the average capacity of new residential solar PV
installation in New Zealand until August 2017.
Figure 1. Average capacity of new residential PV installations (Electricity Authority, 2017)
Economic Parameters Evaluated
Since private PV counterbalances a home's power utilization, the income for the sum
balance is thought to be the cost sparing from not acquiring from the power retailer.
Furthermore, the measure of PV age over a home's heap is sold to the power retailer at the
purchase back rate, expanding income. Since the retail and purchase back rates are so unique
in New Zealand, learning of the heap profile, and in addition the PV age by time, is basic to
have the capacity to survey the aggregate cost sparing and along these lines income earned by
the householder (IPENZ, 2010).
5
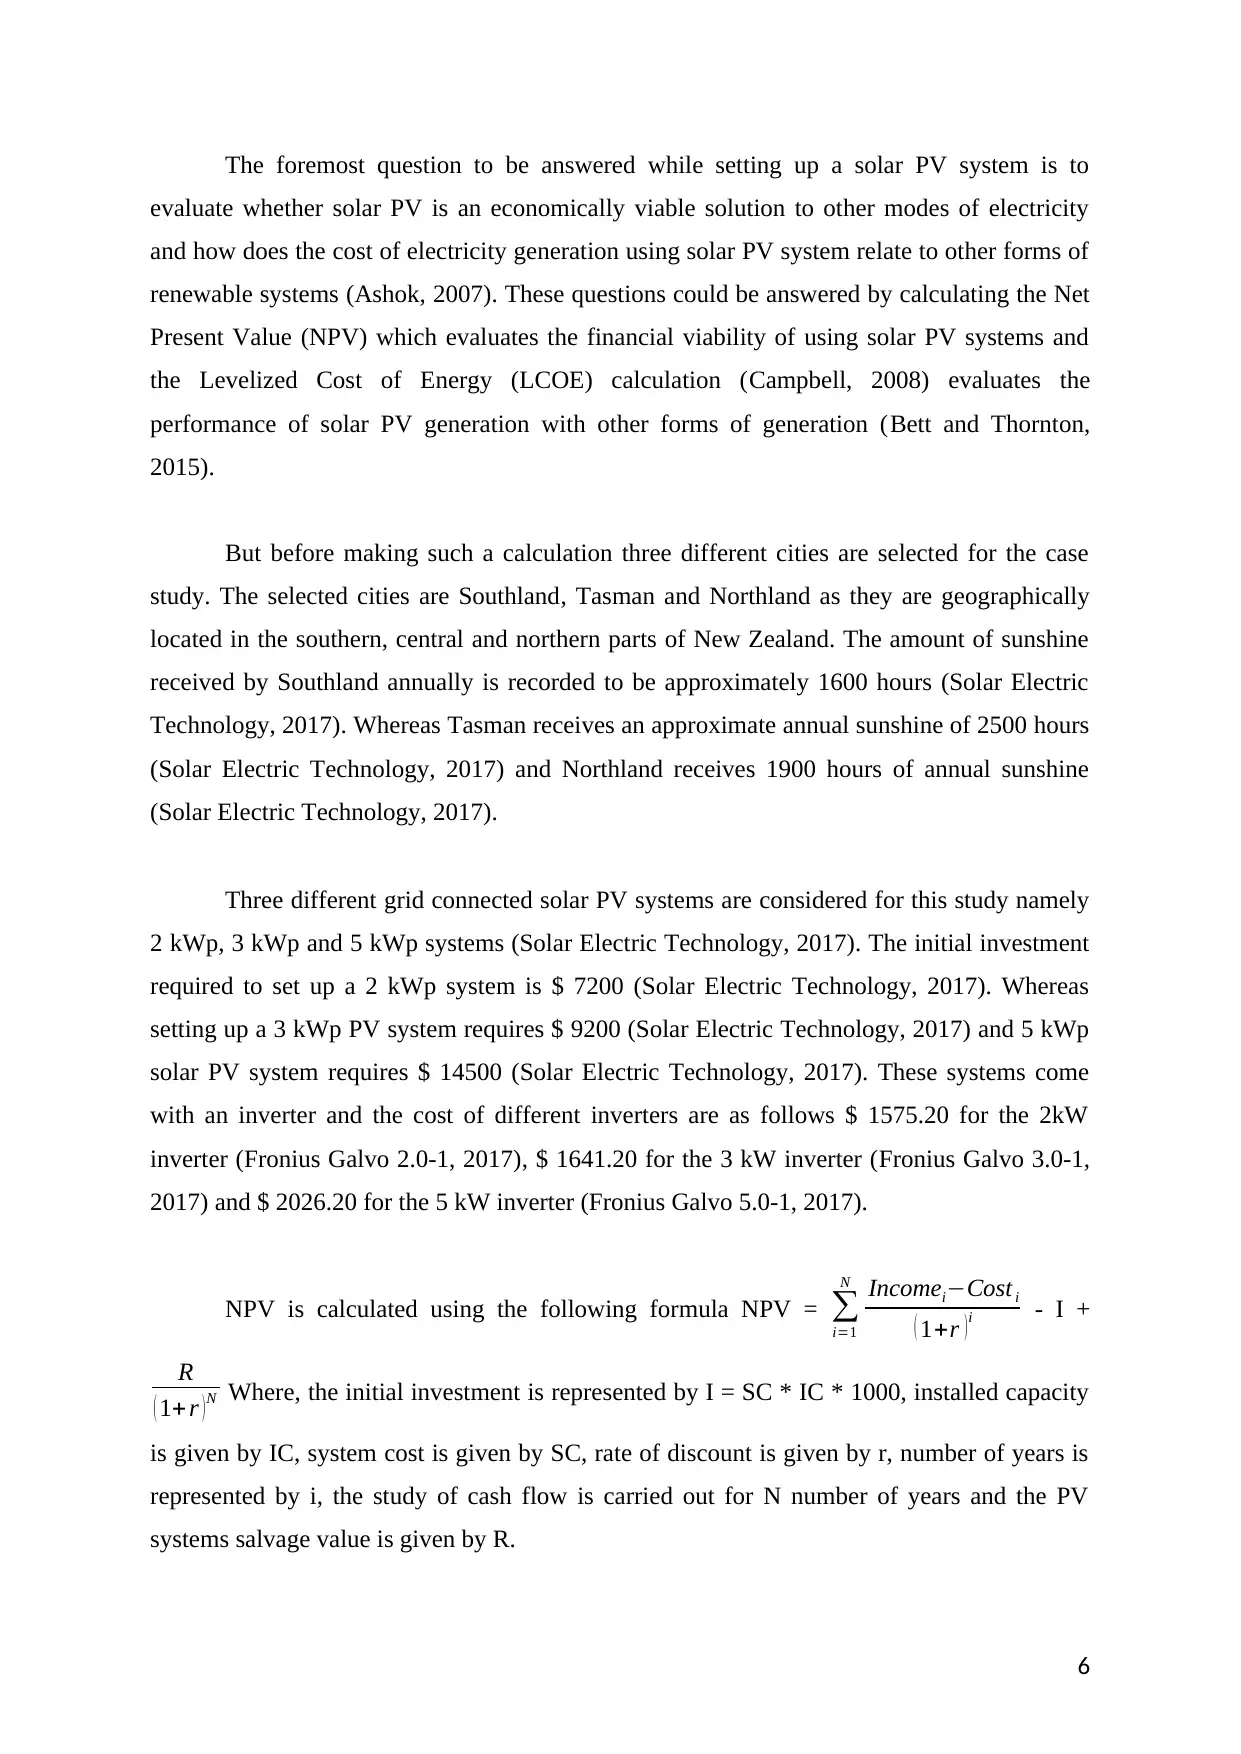
The foremost question to be answered while setting up a solar PV system is to
evaluate whether solar PV is an economically viable solution to other modes of electricity
and how does the cost of electricity generation using solar PV system relate to other forms of
renewable systems (Ashok, 2007). These questions could be answered by calculating the Net
Present Value (NPV) which evaluates the financial viability of using solar PV systems and
the Levelized Cost of Energy (LCOE) calculation (Campbell, 2008) evaluates the
performance of solar PV generation with other forms of generation (Bett and Thornton,
2015).
But before making such a calculation three different cities are selected for the case
study. The selected cities are Southland, Tasman and Northland as they are geographically
located in the southern, central and northern parts of New Zealand. The amount of sunshine
received by Southland annually is recorded to be approximately 1600 hours (Solar Electric
Technology, 2017). Whereas Tasman receives an approximate annual sunshine of 2500 hours
(Solar Electric Technology, 2017) and Northland receives 1900 hours of annual sunshine
(Solar Electric Technology, 2017).
Three different grid connected solar PV systems are considered for this study namely
2 kWp, 3 kWp and 5 kWp systems (Solar Electric Technology, 2017). The initial investment
required to set up a 2 kWp system is $ 7200 (Solar Electric Technology, 2017). Whereas
setting up a 3 kWp PV system requires $ 9200 (Solar Electric Technology, 2017) and 5 kWp
solar PV system requires $ 14500 (Solar Electric Technology, 2017). These systems come
with an inverter and the cost of different inverters are as follows $ 1575.20 for the 2kW
inverter (Fronius Galvo 2.0-1, 2017), $ 1641.20 for the 3 kW inverter (Fronius Galvo 3.0-1,
2017) and $ 2026.20 for the 5 kW inverter (Fronius Galvo 5.0-1, 2017).
NPV is calculated using the following formula NPV = ∑
i=1
N Incomei−Cost i
( 1+r ) i - I +
R
( 1+ r ) N Where, the initial investment is represented by I = SC * IC * 1000, installed capacity
is given by IC, system cost is given by SC, rate of discount is given by r, number of years is
represented by i, the study of cash flow is carried out for N number of years and the PV
systems salvage value is given by R.
6
⊘ This is a preview!⊘
Do you want full access?
Subscribe today to unlock all pages.
Trusted by 1+ million students worldwide
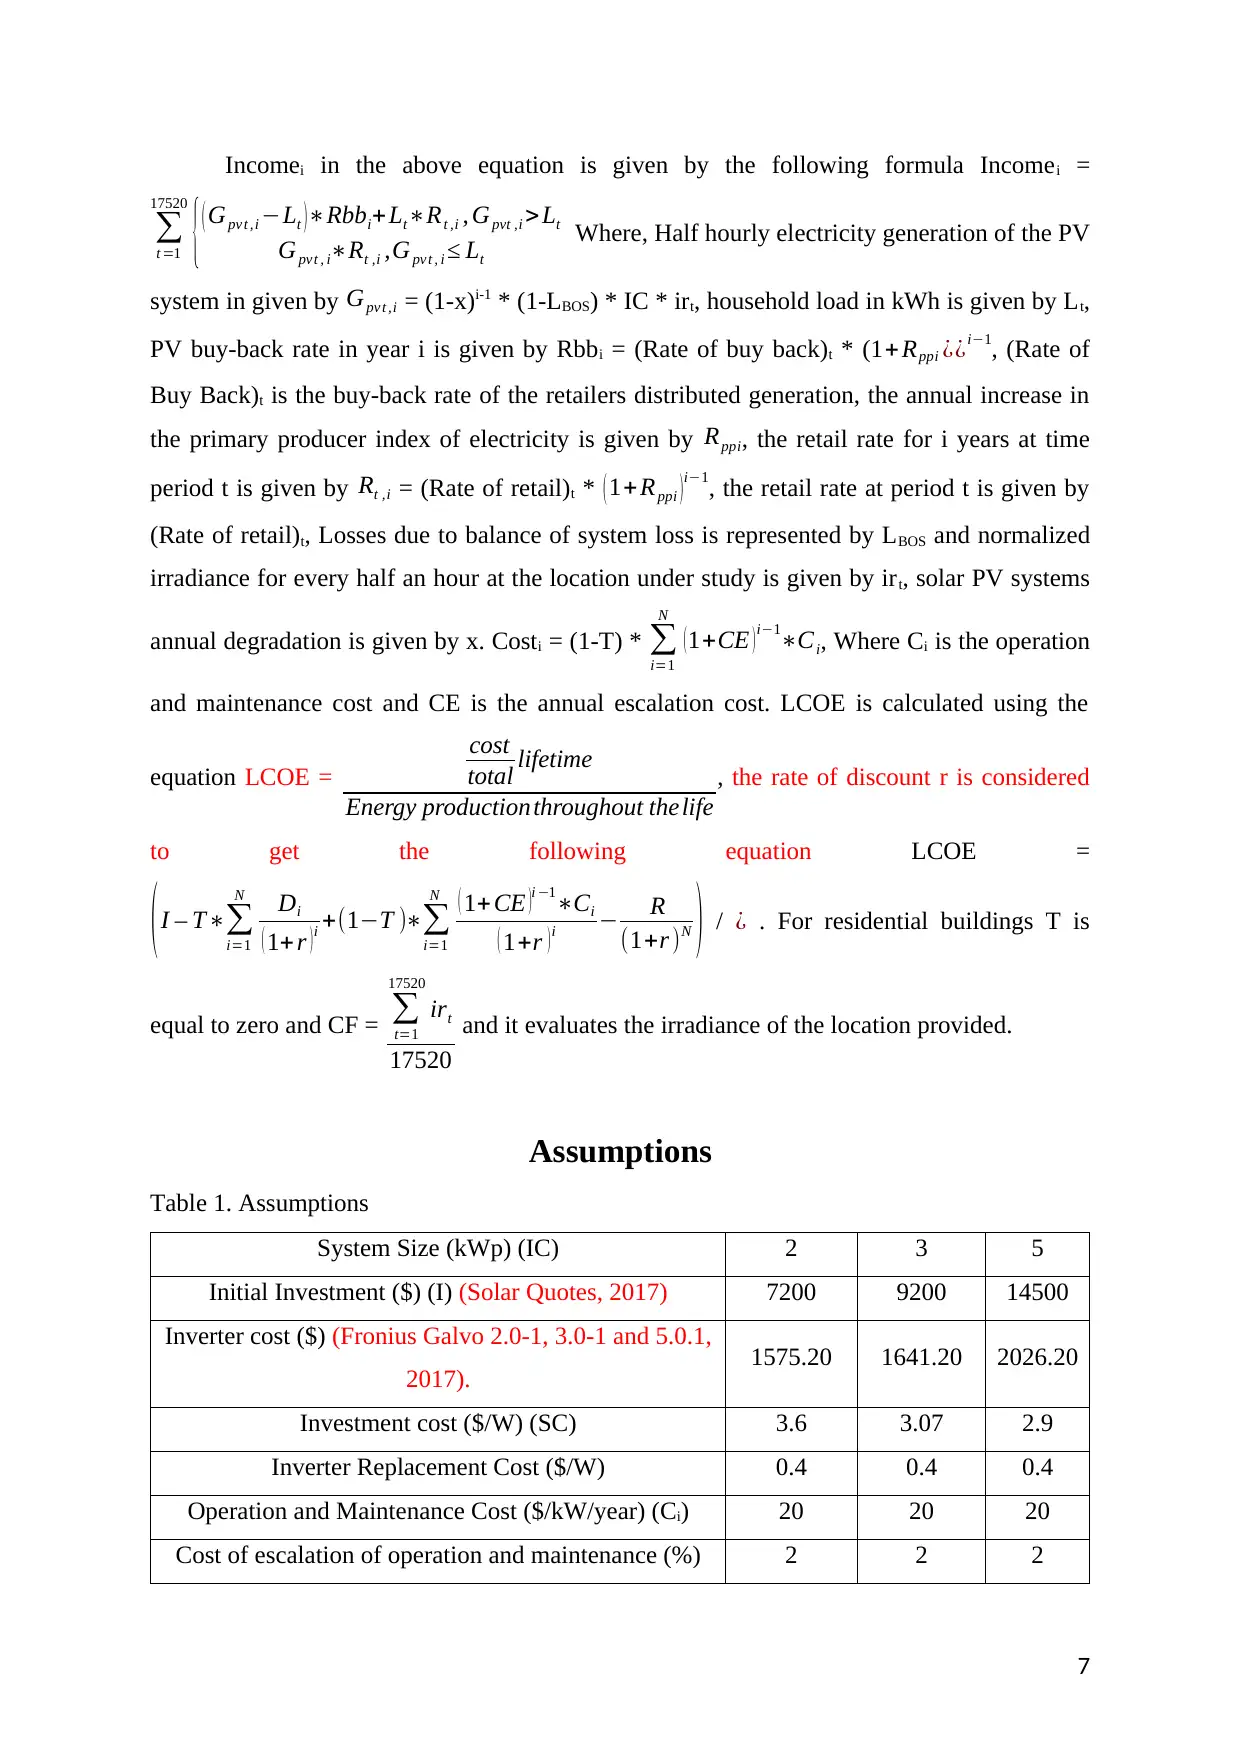
Incomei in the above equation is given by the following formula Incomei =
∑
t =1
17520
{( Gpv t ,i −Lt )∗Rbbi+Lt∗Rt ,i , Gpvt ,i >Lt
Gpvt , i∗Rt ,i ,Gpv t , i ≤ Lt
Where, Half hourly electricity generation of the PV
system in given by Gpv t ,i = (1-x)i-1 * (1-LBOS) * IC * irt, household load in kWh is given by Lt,
PV buy-back rate in year i is given by Rbbi = (Rate of buy back)t * (1+ Rppi ¿¿i−1, (Rate of
Buy Back)t is the buy-back rate of the retailers distributed generation, the annual increase in
the primary producer index of electricity is given by Rppi, the retail rate for i years at time
period t is given by Rt ,i = (Rate of retail)t * ( 1+Rppi )i−1, the retail rate at period t is given by
(Rate of retail)t, Losses due to balance of system loss is represented by LBOS and normalized
irradiance for every half an hour at the location under study is given by irt, solar PV systems
annual degradation is given by x. Costi = (1-T) * ∑
i=1
N
(1+CE )i−1∗Ci, Where Ci is the operation
and maintenance cost and CE is the annual escalation cost. LCOE is calculated using the
equation LCOE =
cost
total lifetime
Energy productionthroughout thelife
, the rate of discount r is considered
to get the following equation LCOE =
(I – T∗∑
i=1
N Di
( 1+ r )i +(1−T )∗∑
i=1
N ( 1+CE )i −1∗Ci
( 1+r )i − R
(1+r )N ) / ¿ . For residential buildings T is
equal to zero and CF = ∑
t=1
17520
irt
17520
and it evaluates the irradiance of the location provided.
Assumptions
Table 1. Assumptions
System Size (kWp) (IC) 2 3 5
Initial Investment ($) (I) (Solar Quotes, 2017) 7200 9200 14500
Inverter cost ($) (Fronius Galvo 2.0-1, 3.0-1 and 5.0.1,
2017). 1575.20 1641.20 2026.20
Investment cost ($/W) (SC) 3.6 3.07 2.9
Inverter Replacement Cost ($/W) 0.4 0.4 0.4
Operation and Maintenance Cost ($/kW/year) (Ci) 20 20 20
Cost of escalation of operation and maintenance (%) 2 2 2
7
Paraphrase This Document
Need a fresh take? Get an instant paraphrase of this document with our AI Paraphraser
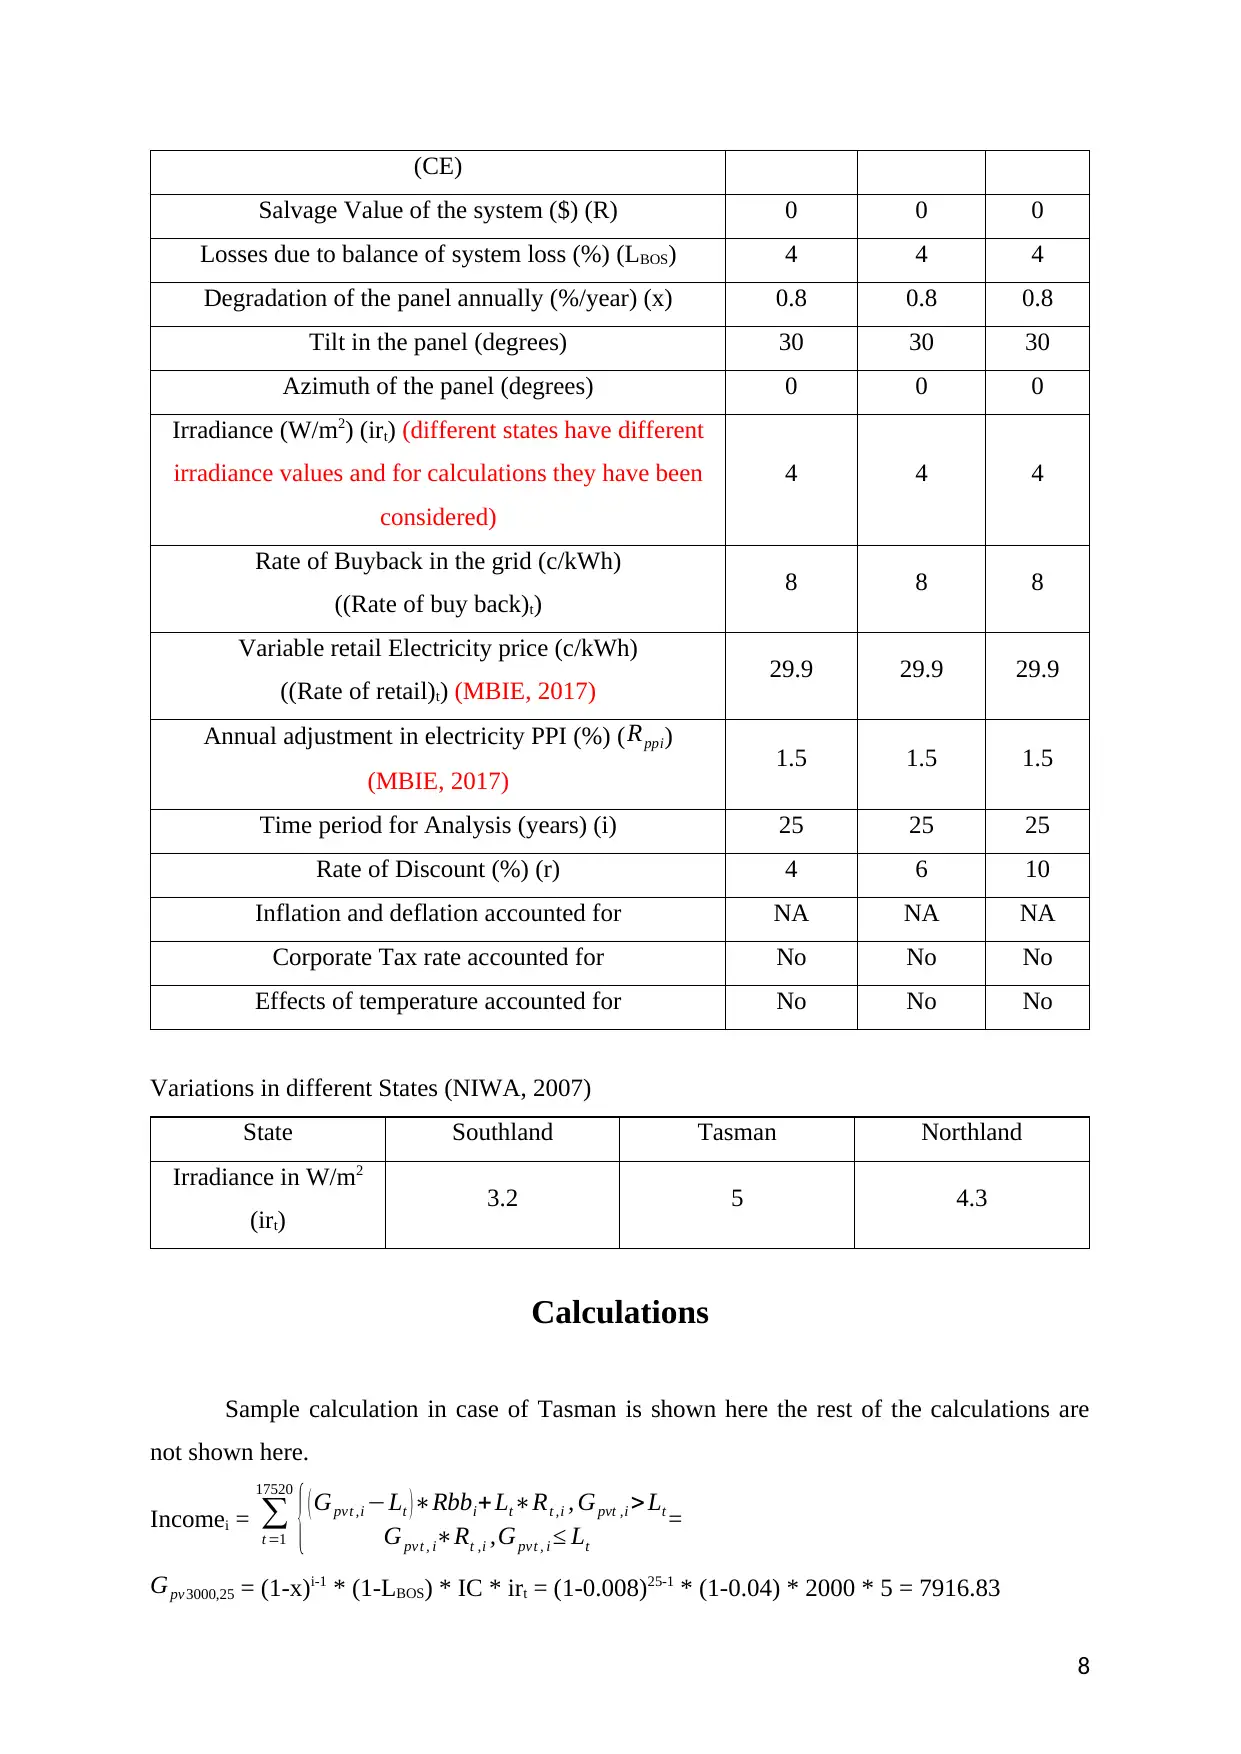
(CE)
Salvage Value of the system ($) (R) 0 0 0
Losses due to balance of system loss (%) (LBOS) 4 4 4
Degradation of the panel annually (%/year) (x) 0.8 0.8 0.8
Tilt in the panel (degrees) 30 30 30
Azimuth of the panel (degrees) 0 0 0
Irradiance (W/m2) (irt) (different states have different
irradiance values and for calculations they have been
considered)
4 4 4
Rate of Buyback in the grid (c/kWh)
((Rate of buy back)t) 8 8 8
Variable retail Electricity price (c/kWh)
((Rate of retail)t) (MBIE, 2017) 29.9 29.9 29.9
Annual adjustment in electricity PPI (%) ( Rppi)
(MBIE, 2017) 1.5 1.5 1.5
Time period for Analysis (years) (i) 25 25 25
Rate of Discount (%) (r) 4 6 10
Inflation and deflation accounted for NA NA NA
Corporate Tax rate accounted for No No No
Effects of temperature accounted for No No No
Variations in different States (NIWA, 2007)
State Southland Tasman Northland
Irradiance in W/m2
(irt) 3.2 5 4.3
Calculations
Sample calculation in case of Tasman is shown here the rest of the calculations are
not shown here.
Incomei = ∑
t =1
17520
{( Gpvt ,i −Lt )∗Rbbi+ Lt∗Rt ,i , Gpvt ,i > Lt
Gpvt , i∗Rt ,i ,Gpvt , i ≤ Lt
=
Gpv3000,25 = (1-x)i-1 * (1-LBOS) * IC * irt = (1-0.008)25-1 * (1-0.04) * 2000 * 5 = 7916.83
8
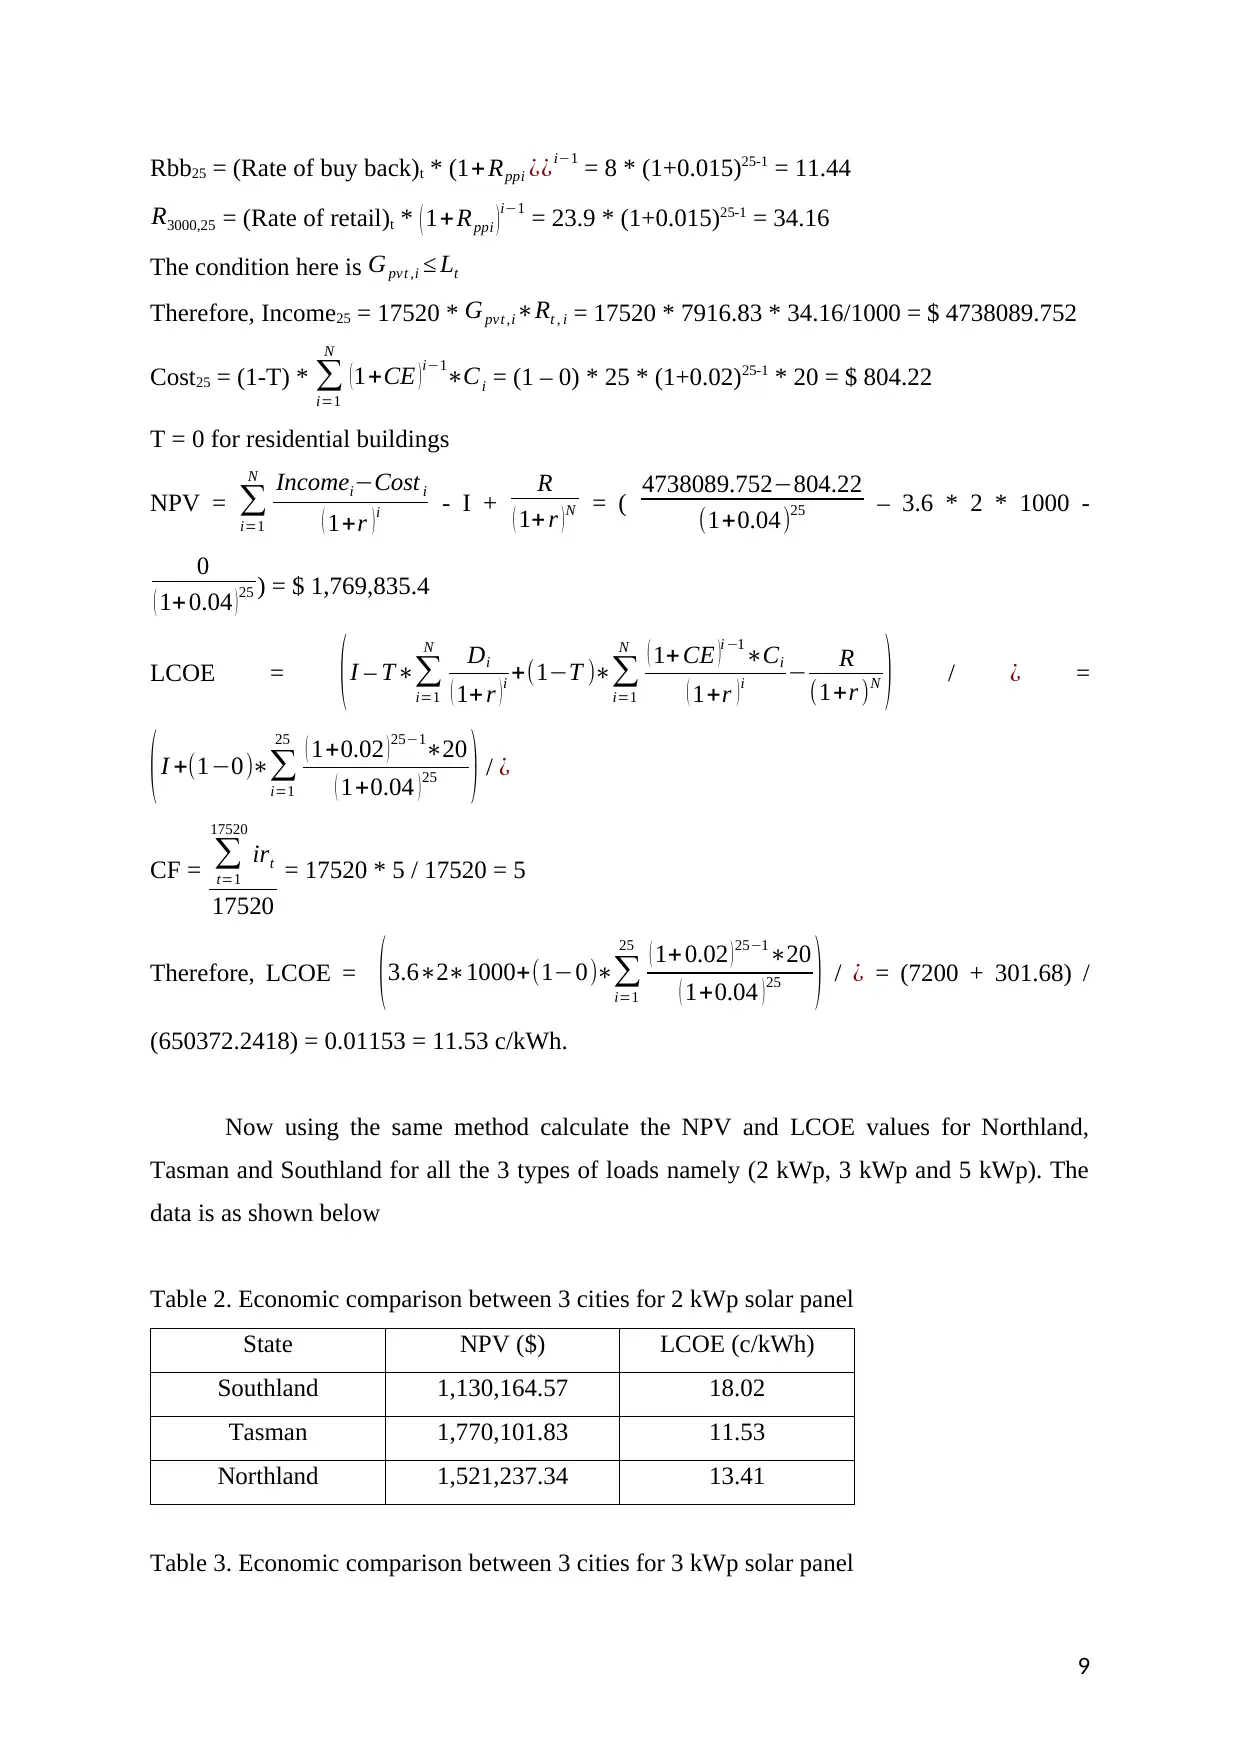
Rbb25 = (Rate of buy back)t * (1+ Rppi ¿¿i−1 = 8 * (1+0.015)25-1 = 11.44
R3000,25 = (Rate of retail)t * ( 1+Rppi )i−1 = 23.9 * (1+0.015)25-1 = 34.16
The condition here is Gpv t ,i ≤ Lt
Therefore, Income25 = 17520 * Gpvt ,i∗Rt , i = 17520 * 7916.83 * 34.16/1000 = $ 4738089.752
Cost25 = (1-T) * ∑
i=1
N
(1+CE )i−1∗Ci = (1 – 0) * 25 * (1+0.02)25-1 * 20 = $ 804.22
T = 0 for residential buildings
NPV = ∑
i=1
N Incomei−Cost i
( 1+r ) i - I + R
( 1+ r ) N = ( 4738089.752−804.22
(1+0.04)25 – 3.6 * 2 * 1000 -
0
( 1+ 0.04 )25 ) = $ 1,769,835.4
LCOE = ( I – T∗∑
i=1
N Di
( 1+ r ) i +(1−T )∗∑
i=1
N ( 1+ CE )i −1∗Ci
( 1+r ) i − R
(1+r )N ) / ¿ =
( I +(1−0)∗∑
i=1
25 ( 1+0.02 ) 25−1∗20
( 1+0.04 ) 25 ) / ¿
CF = ∑
t=1
17520
irt
17520
= 17520 * 5 / 17520 = 5
Therefore, LCOE = (3.6∗2∗1000+(1−0)∗∑
i=1
25 ( 1+0.02 )25−1∗20
( 1+0.04 )25 ) / ¿ = (7200 + 301.68) /
(650372.2418) = 0.01153 = 11.53 c/kWh.
Now using the same method calculate the NPV and LCOE values for Northland,
Tasman and Southland for all the 3 types of loads namely (2 kWp, 3 kWp and 5 kWp). The
data is as shown below
Table 2. Economic comparison between 3 cities for 2 kWp solar panel
State NPV ($) LCOE (c/kWh)
Southland 1,130,164.57 18.02
Tasman 1,770,101.83 11.53
Northland 1,521,237.34 13.41
Table 3. Economic comparison between 3 cities for 3 kWp solar panel
9
⊘ This is a preview!⊘
Do you want full access?
Subscribe today to unlock all pages.
Trusted by 1+ million students worldwide
State NPV ($) LCOE (c/kWh)
Southland 1,050,581.18 24.21
Tasman 1,646,813.49 15.49
Northland 1,414,945.37 18.01
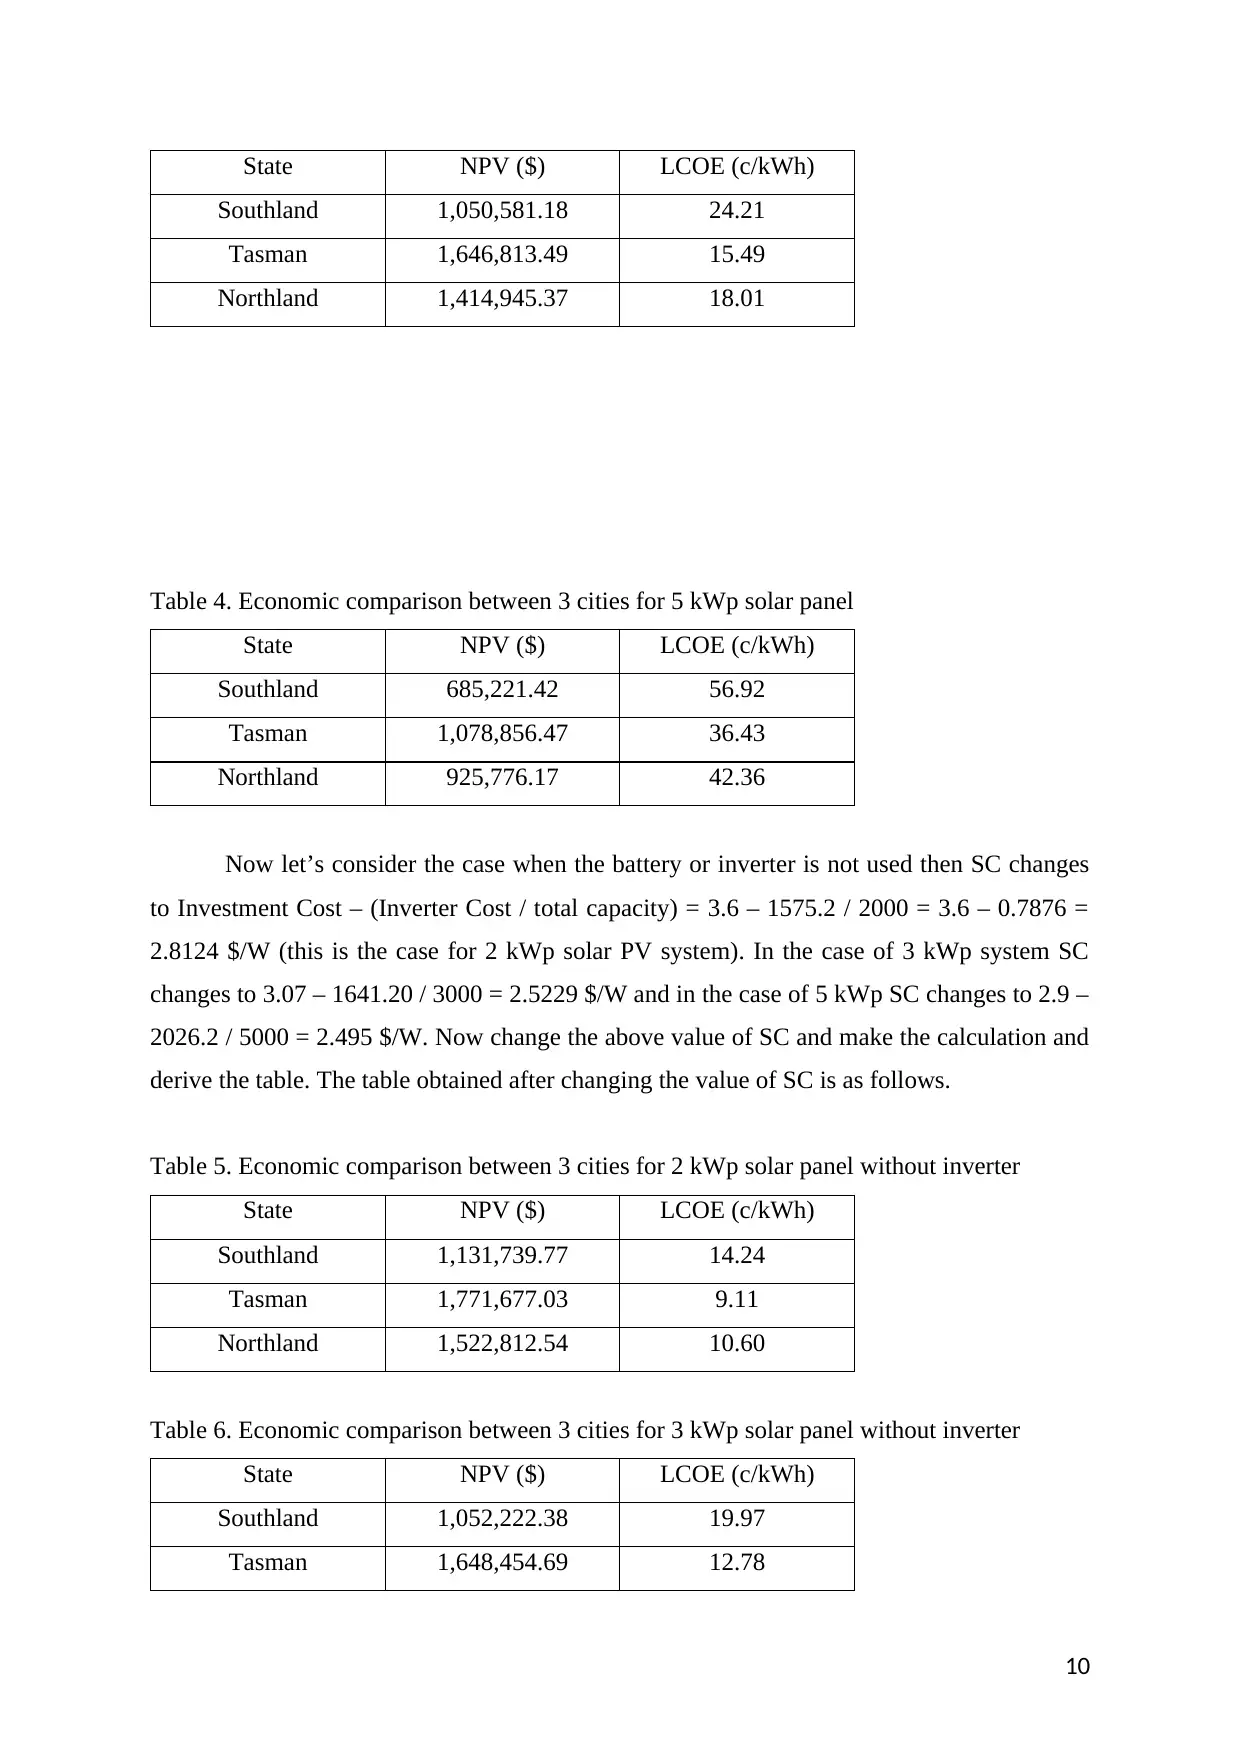
Table 4. Economic comparison between 3 cities for 5 kWp solar panel
State NPV ($) LCOE (c/kWh)
Southland 685,221.42 56.92
Tasman 1,078,856.47 36.43
Northland 925,776.17 42.36
Now let’s consider the case when the battery or inverter is not used then SC changes
to Investment Cost – (Inverter Cost / total capacity) = 3.6 – 1575.2 / 2000 = 3.6 – 0.7876 =
2.8124 $/W (this is the case for 2 kWp solar PV system). In the case of 3 kWp system SC
changes to 3.07 – 1641.20 / 3000 = 2.5229 $/W and in the case of 5 kWp SC changes to 2.9 –
2026.2 / 5000 = 2.495 $/W. Now change the above value of SC and make the calculation and
derive the table. The table obtained after changing the value of SC is as follows.
Table 5. Economic comparison between 3 cities for 2 kWp solar panel without inverter
State NPV ($) LCOE (c/kWh)
Southland 1,131,739.77 14.24
Tasman 1,771,677.03 9.11
Northland 1,522,812.54 10.60
Table 6. Economic comparison between 3 cities for 3 kWp solar panel without inverter
State NPV ($) LCOE (c/kWh)
Southland 1,052,222.38 19.97
Tasman 1,648,454.69 12.78
10
Southland 1,050,581.18 24.21
Tasman 1,646,813.49 15.49
Northland 1,414,945.37 18.01
Table 4. Economic comparison between 3 cities for 5 kWp solar panel
State NPV ($) LCOE (c/kWh)
Southland 685,221.42 56.92
Tasman 1,078,856.47 36.43
Northland 925,776.17 42.36
Now let’s consider the case when the battery or inverter is not used then SC changes
to Investment Cost – (Inverter Cost / total capacity) = 3.6 – 1575.2 / 2000 = 3.6 – 0.7876 =
2.8124 $/W (this is the case for 2 kWp solar PV system). In the case of 3 kWp system SC
changes to 3.07 – 1641.20 / 3000 = 2.5229 $/W and in the case of 5 kWp SC changes to 2.9 –
2026.2 / 5000 = 2.495 $/W. Now change the above value of SC and make the calculation and
derive the table. The table obtained after changing the value of SC is as follows.
Table 5. Economic comparison between 3 cities for 2 kWp solar panel without inverter
State NPV ($) LCOE (c/kWh)
Southland 1,131,739.77 14.24
Tasman 1,771,677.03 9.11
Northland 1,522,812.54 10.60
Table 6. Economic comparison between 3 cities for 3 kWp solar panel without inverter
State NPV ($) LCOE (c/kWh)
Southland 1,052,222.38 19.97
Tasman 1,648,454.69 12.78
10
Paraphrase This Document
Need a fresh take? Get an instant paraphrase of this document with our AI Paraphraser
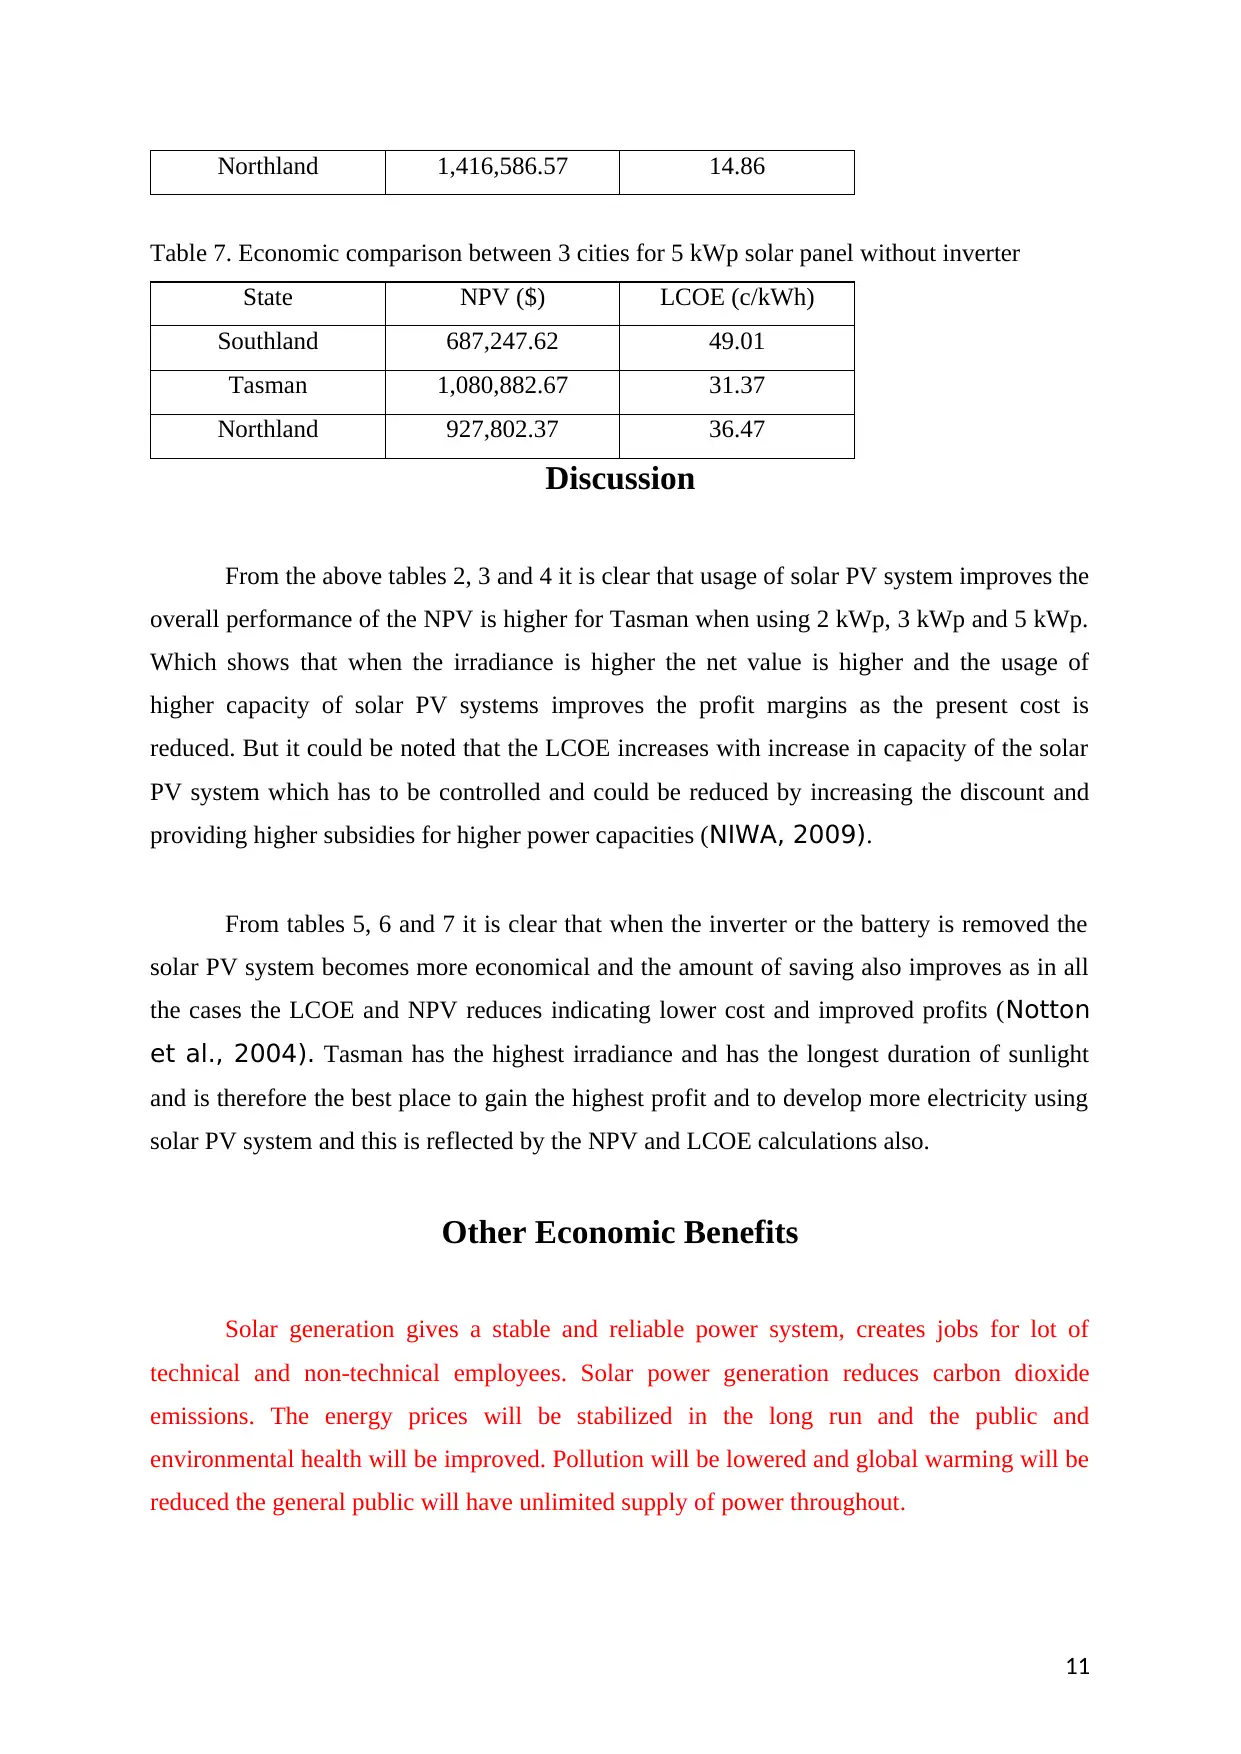
Northland 1,416,586.57 14.86
Table 7. Economic comparison between 3 cities for 5 kWp solar panel without inverter
State NPV ($) LCOE (c/kWh)
Southland 687,247.62 49.01
Tasman 1,080,882.67 31.37
Northland 927,802.37 36.47
Discussion
From the above tables 2, 3 and 4 it is clear that usage of solar PV system improves the
overall performance of the NPV is higher for Tasman when using 2 kWp, 3 kWp and 5 kWp.
Which shows that when the irradiance is higher the net value is higher and the usage of
higher capacity of solar PV systems improves the profit margins as the present cost is
reduced. But it could be noted that the LCOE increases with increase in capacity of the solar
PV system which has to be controlled and could be reduced by increasing the discount and
providing higher subsidies for higher power capacities (NIWA, 2009).
From tables 5, 6 and 7 it is clear that when the inverter or the battery is removed the
solar PV system becomes more economical and the amount of saving also improves as in all
the cases the LCOE and NPV reduces indicating lower cost and improved profits (Notton
et al., 2004). Tasman has the highest irradiance and has the longest duration of sunlight
and is therefore the best place to gain the highest profit and to develop more electricity using
solar PV system and this is reflected by the NPV and LCOE calculations also.
Other Economic Benefits
Solar generation gives a stable and reliable power system, creates jobs for lot of
technical and non-technical employees. Solar power generation reduces carbon dioxide
emissions. The energy prices will be stabilized in the long run and the public and
environmental health will be improved. Pollution will be lowered and global warming will be
reduced the general public will have unlimited supply of power throughout.
11
Solar power gives essentialness constancy: The rising and setting of the sun is
incredibly enduring. Everywhere throughout the world, we know exactly when it will rise and
set every day of the year. While fogs may be to some degree less obvious, we do in like
manner have really extraordinary consistent and step by step projections for the measure of
light that will be gotten in different zones (Ford, et al., 2014). With everything considered,
this makes solar power a significantly strong wellspring of imperativeness.
Solar power gives imperativeness security: Over the above enduring quality favorable
position, it's not possible for anyone to go and buy the sun or change light into a forcing plan
of action. Joined with the ease of solar loads up, this furthermore gives the exceptional solar
impact good position of imperativeness security, something the US military has pointed out
for an extensive time allotment, and a significant inspiration driving why it is moreover
putting a lot of its money into the progression and foundation of solar influence structures.
Solar power gives essentialness self-sufficiency: Like the imperativeness security
help, solar power gives the giant preferred standpoint of imperativeness opportunity. Yet
again, the fuel for solar sheets can't be obtained or cornered. It is free for all to use. When you
have solar sheets on your housetop, you have a fundamentally free wellspring of energy that
is all yours. This is basic for individuals, yet furthermore for urban regions, regions, states,
countries, and even associations (IRENA, 2012). I was starting late in Ukraine going to
various clean tech exercises and ventures. While there, I found that Ukraine starting late has
saved around $3 billion in decreased oil and gas imports from Russia because of the solar
power plants made by a single fashioner.
Solar power makes occupations: As a wellspring of imperativeness, solar power is an
occupation making powerhouse. Money place assets into solar impact makes a couple of
times a bigger number of occupations than money place assets into coal or vaporous
petroleum.
Conclusion
Solar PV systems improve the overall performance of the power system by adding
more capacity using residential building roof tops and in the long run they provide more
12
⊘ This is a preview!⊘
Do you want full access?
Subscribe today to unlock all pages.
Trusted by 1+ million students worldwide
1 out of 15
Related Documents


Your All-in-One AI-Powered Toolkit for Academic Success.
+13062052269
info@desklib.com
Available 24*7 on WhatsApp / Email
![[object Object]](/_next/static/media/star-bottom.7253800d.svg)
Unlock your academic potential
Copyright © 2020–2026 A2Z Services. All Rights Reserved. Developed and managed by ZUCOL.