Economic and Financial Management: Imperial Brand plc Analysis Report
VerifiedAdded on 2023/01/13
|19
|2906
|22
Report
AI Summary
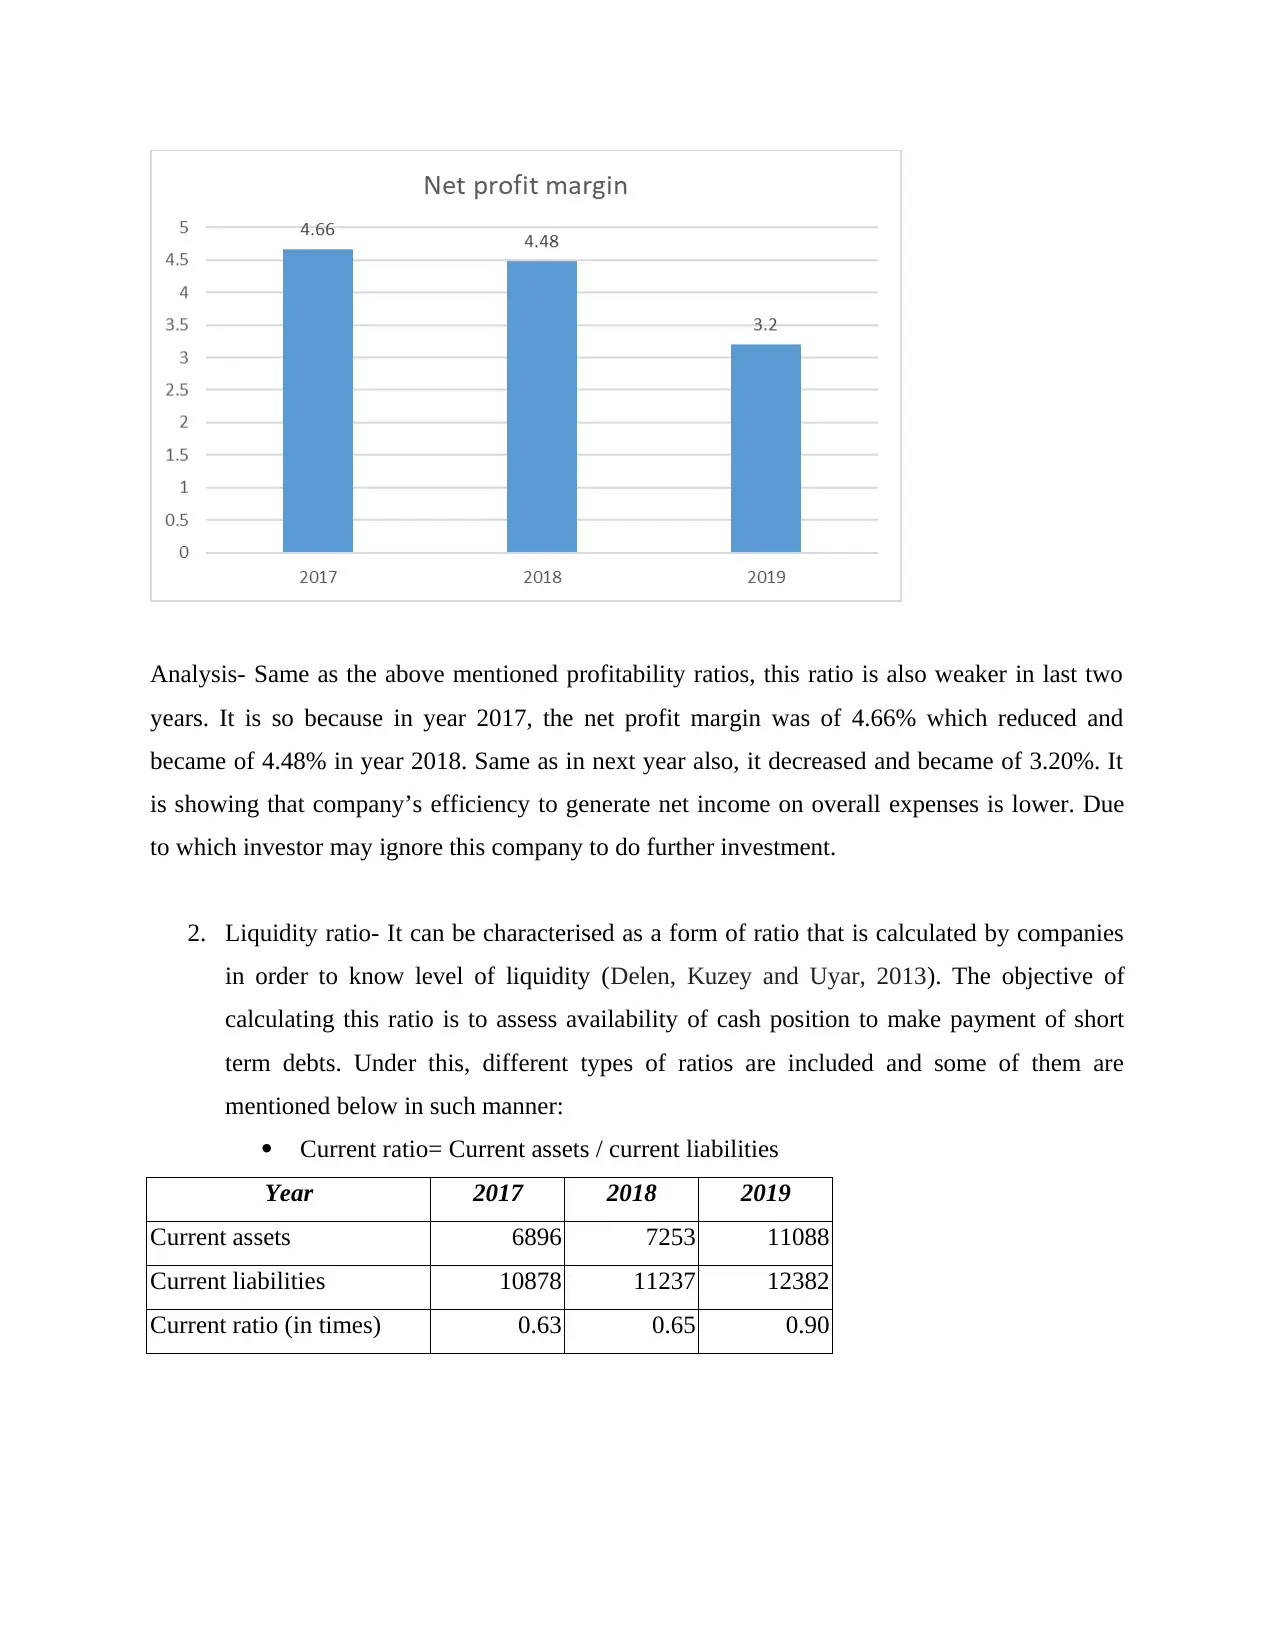
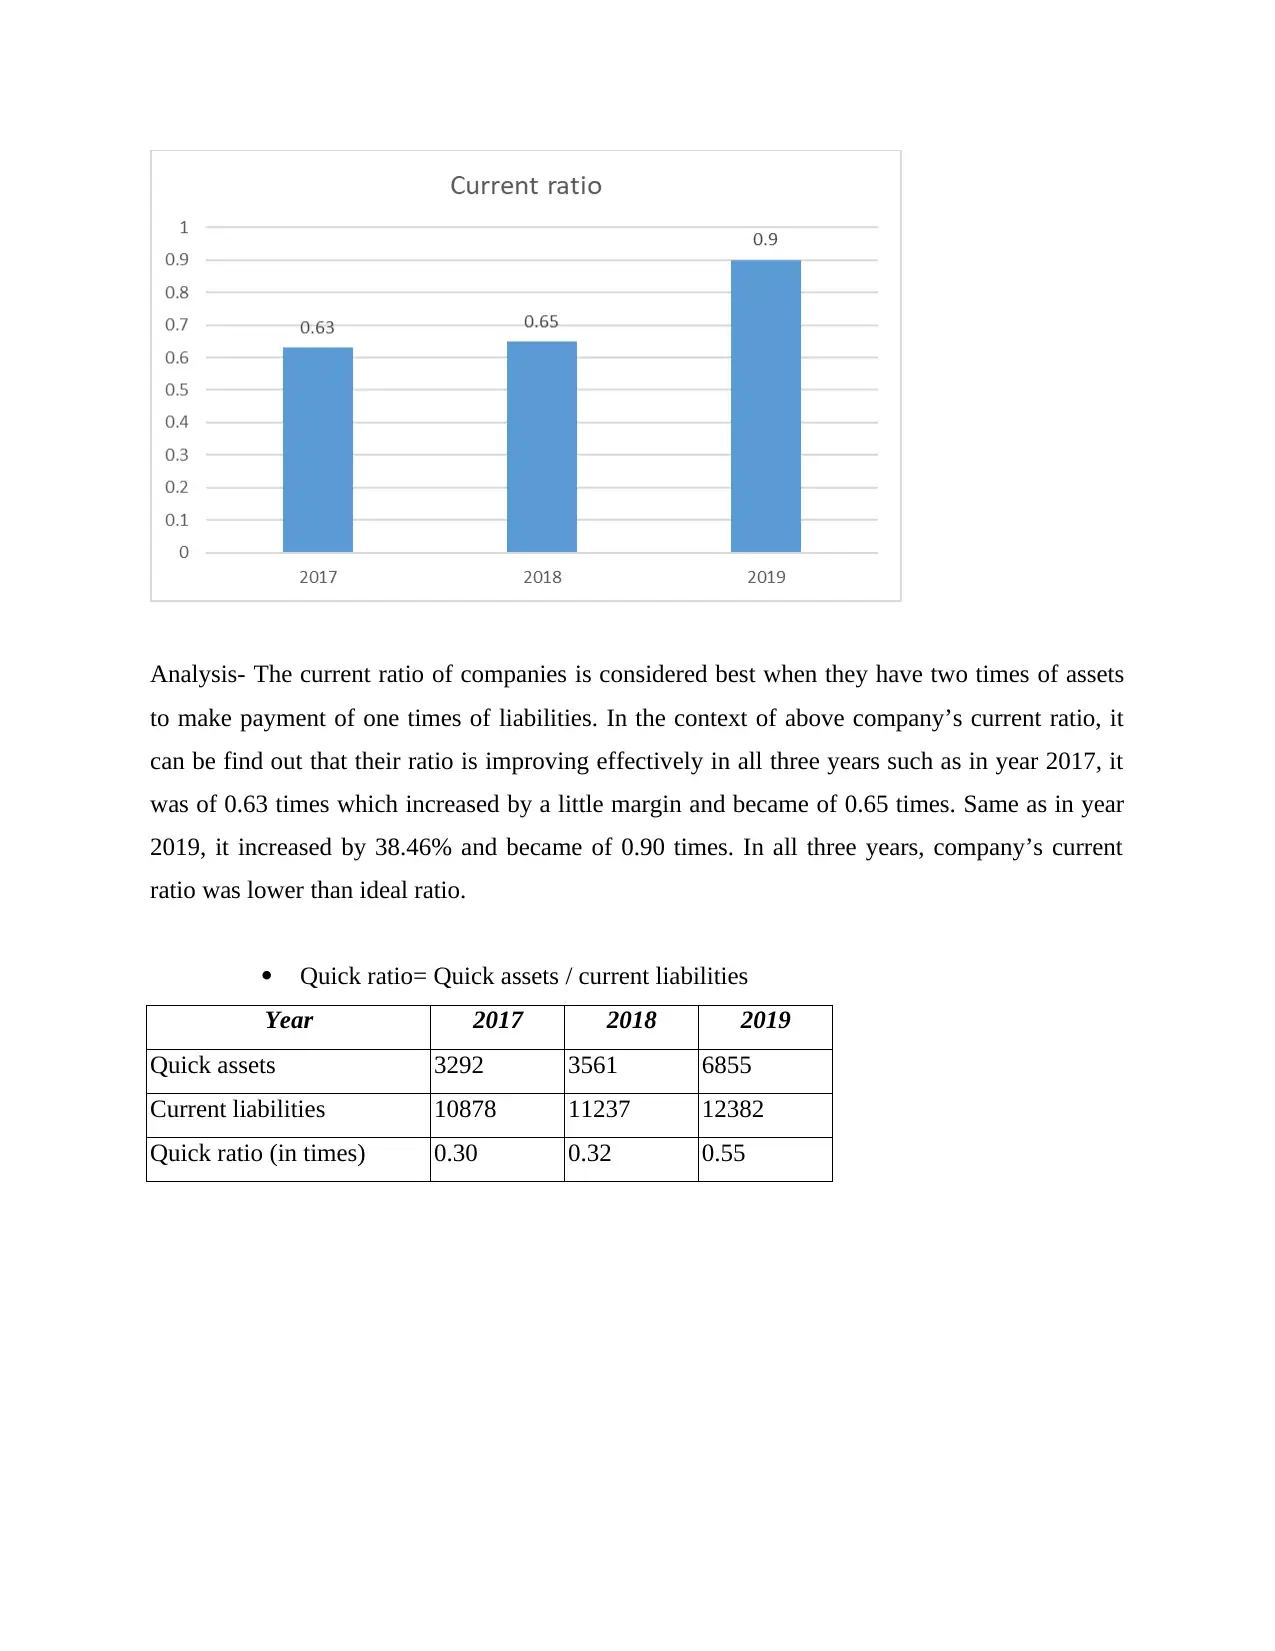
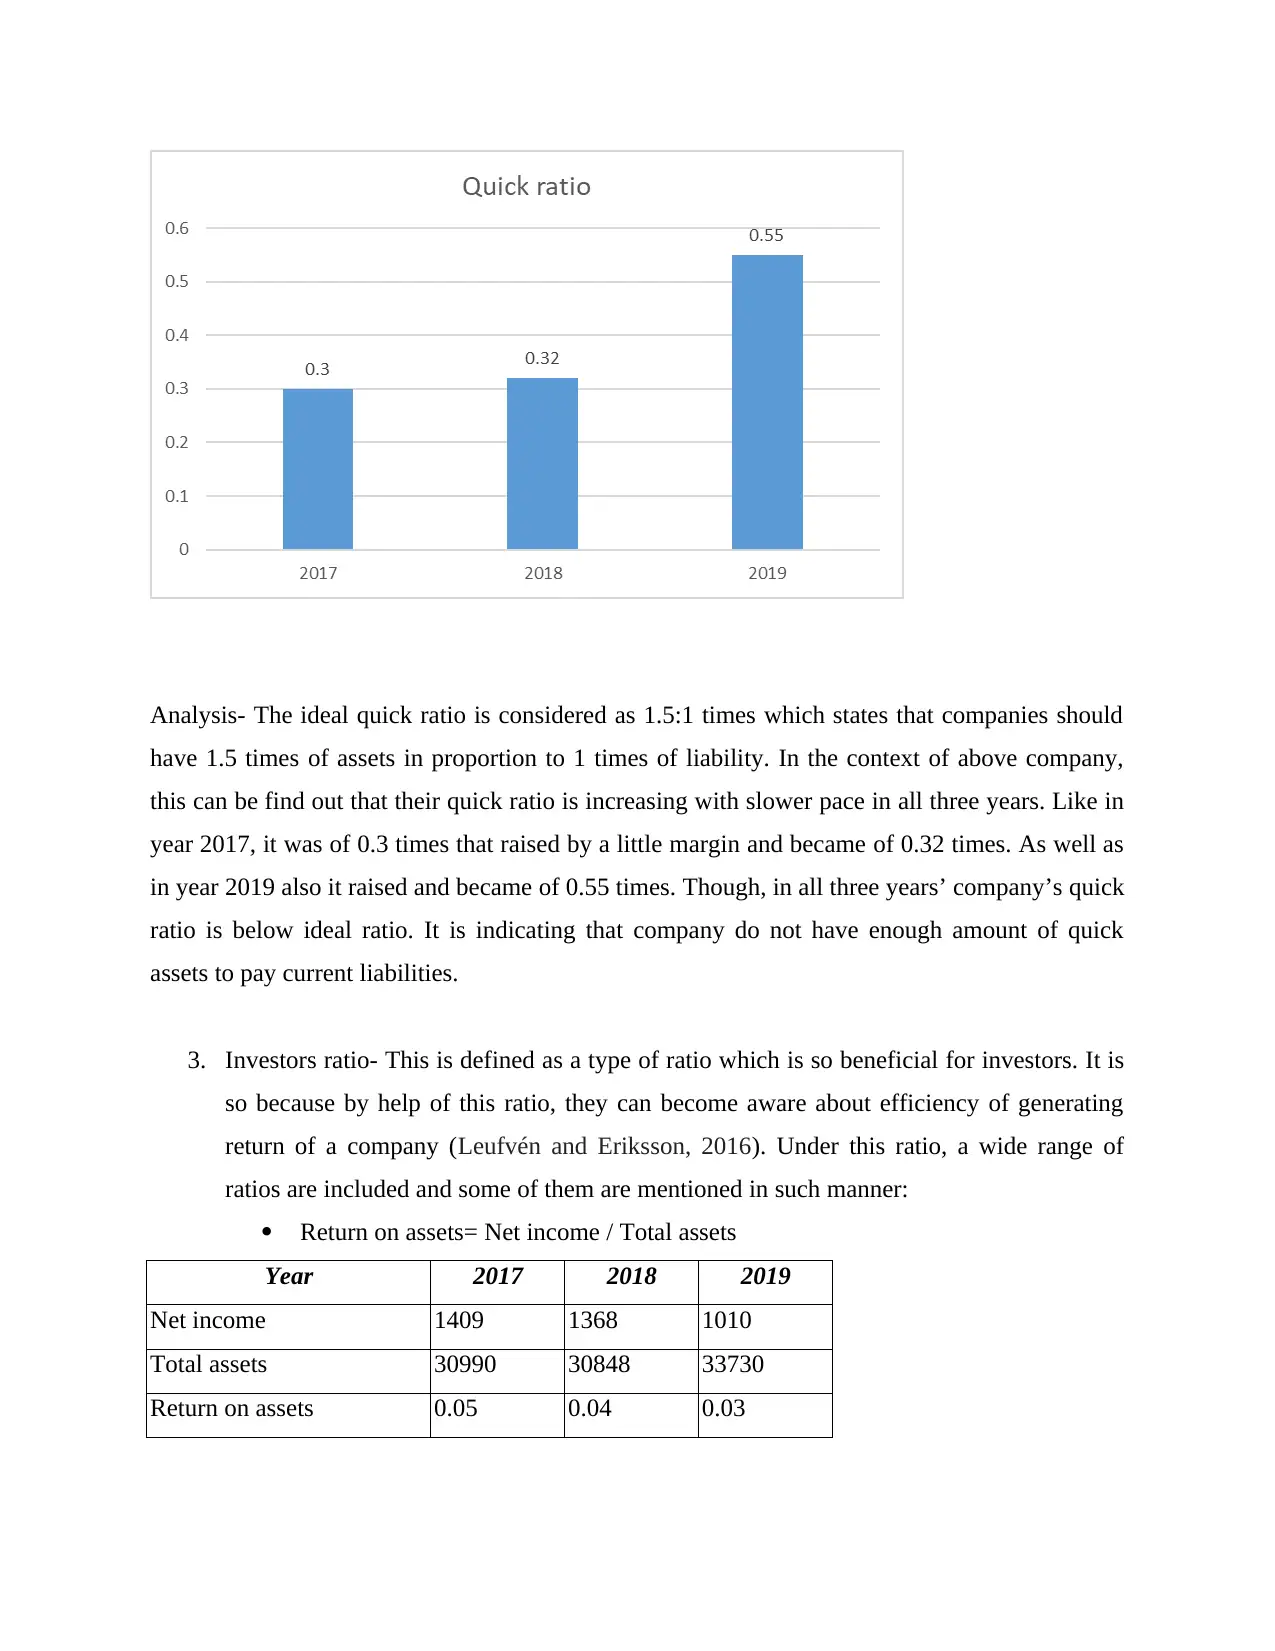
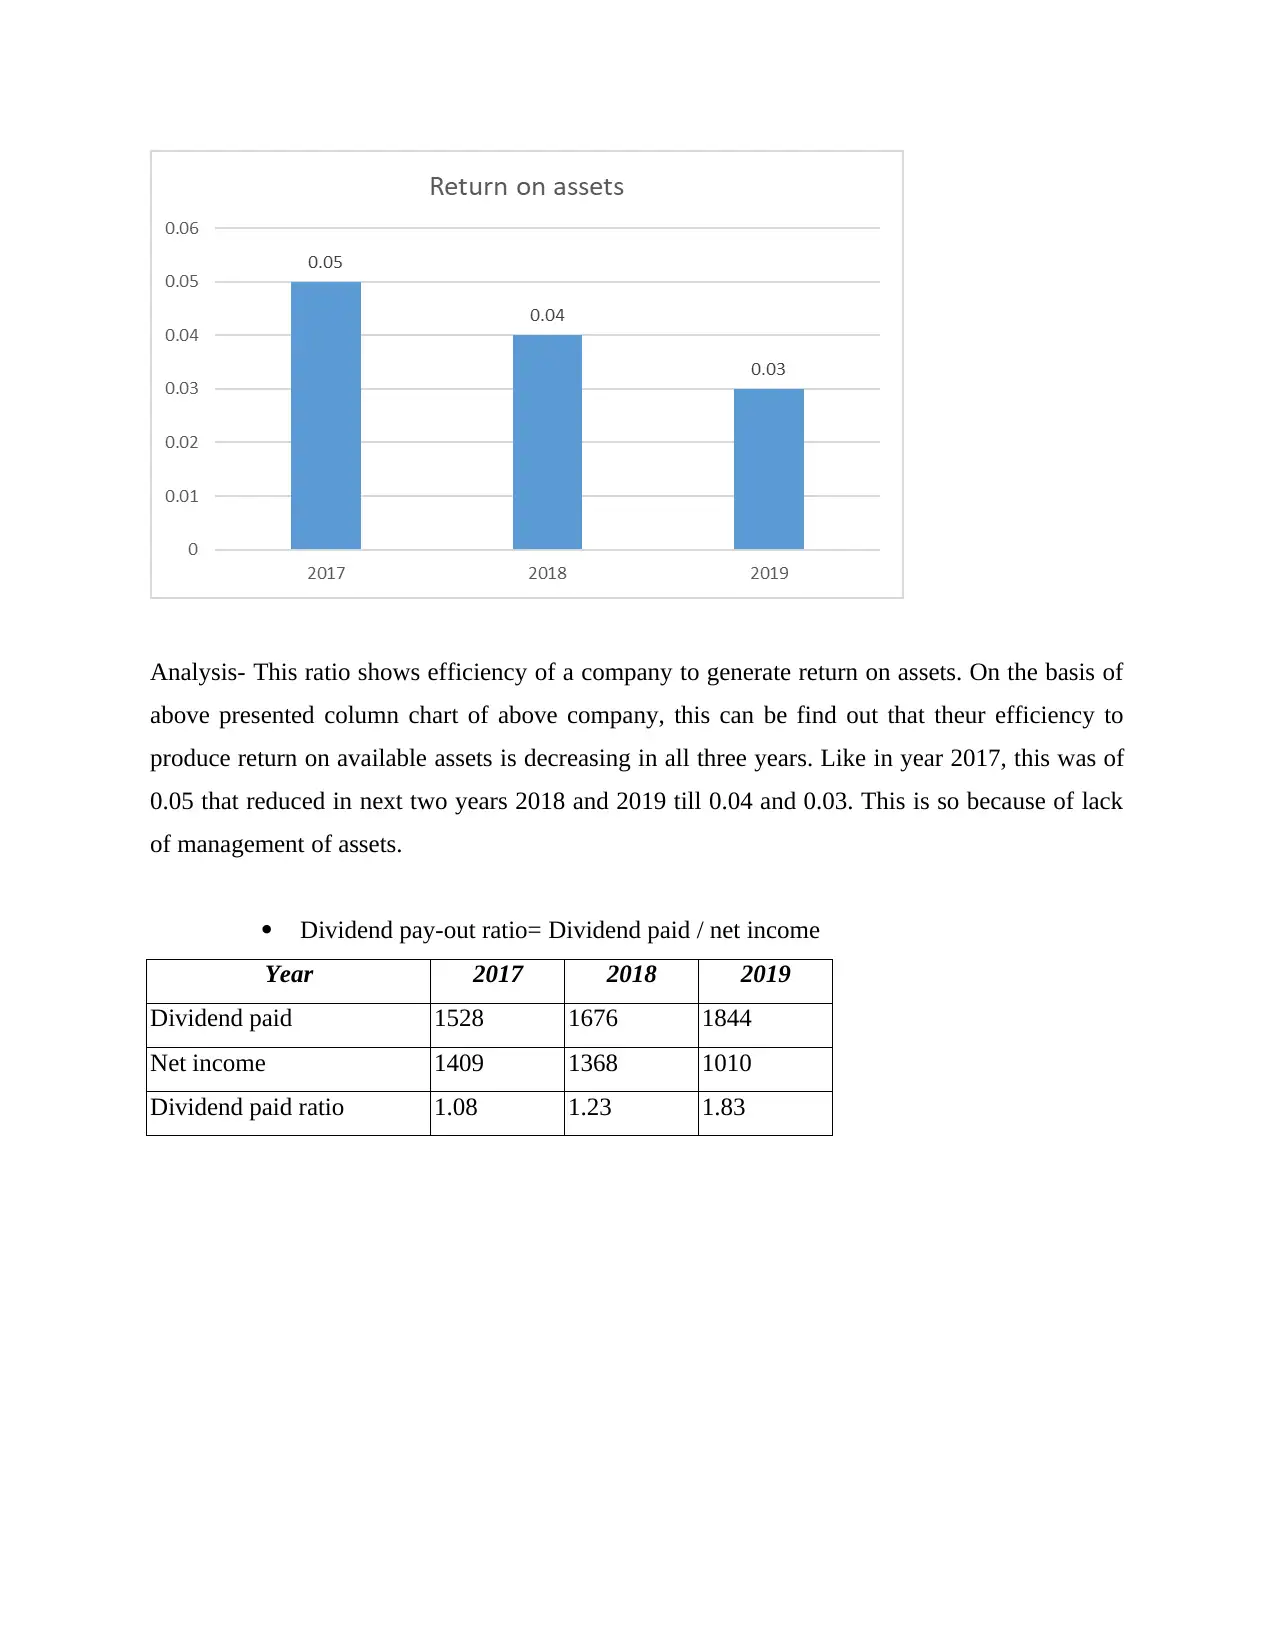
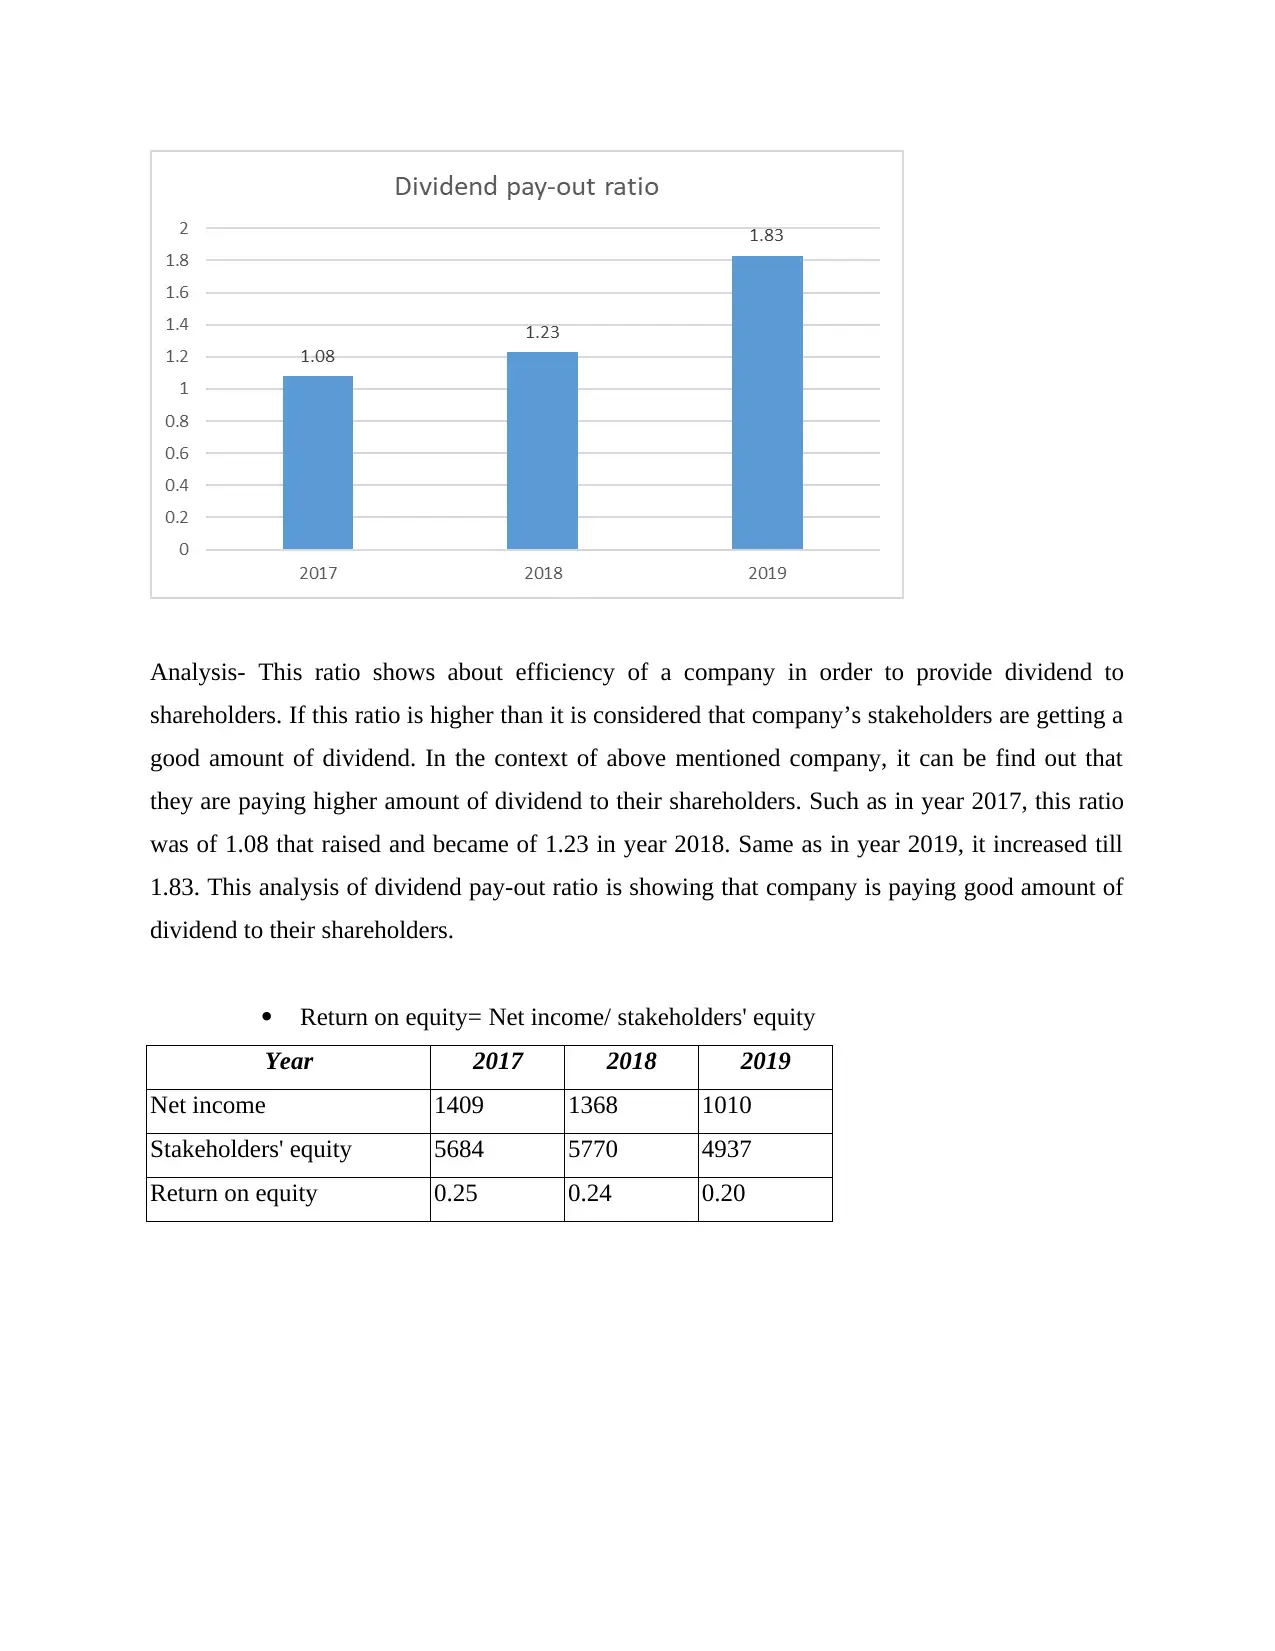
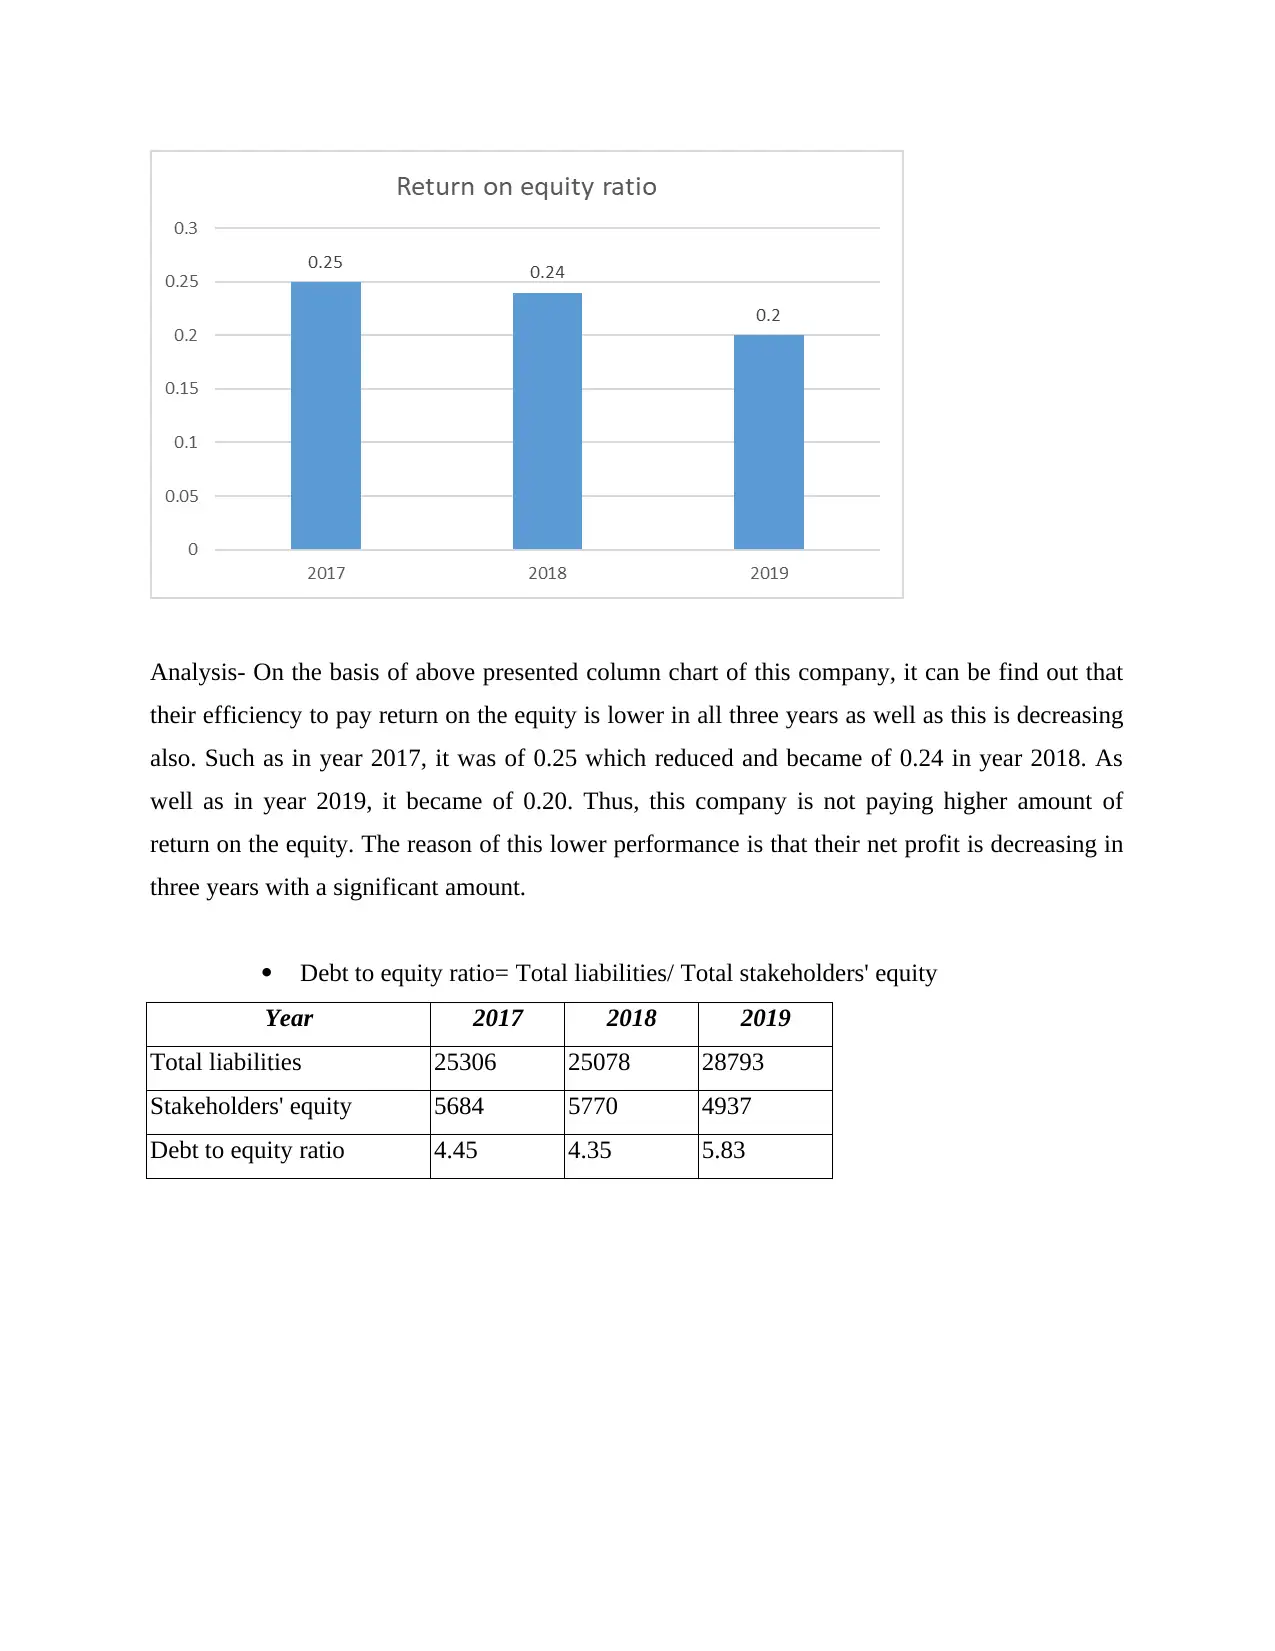
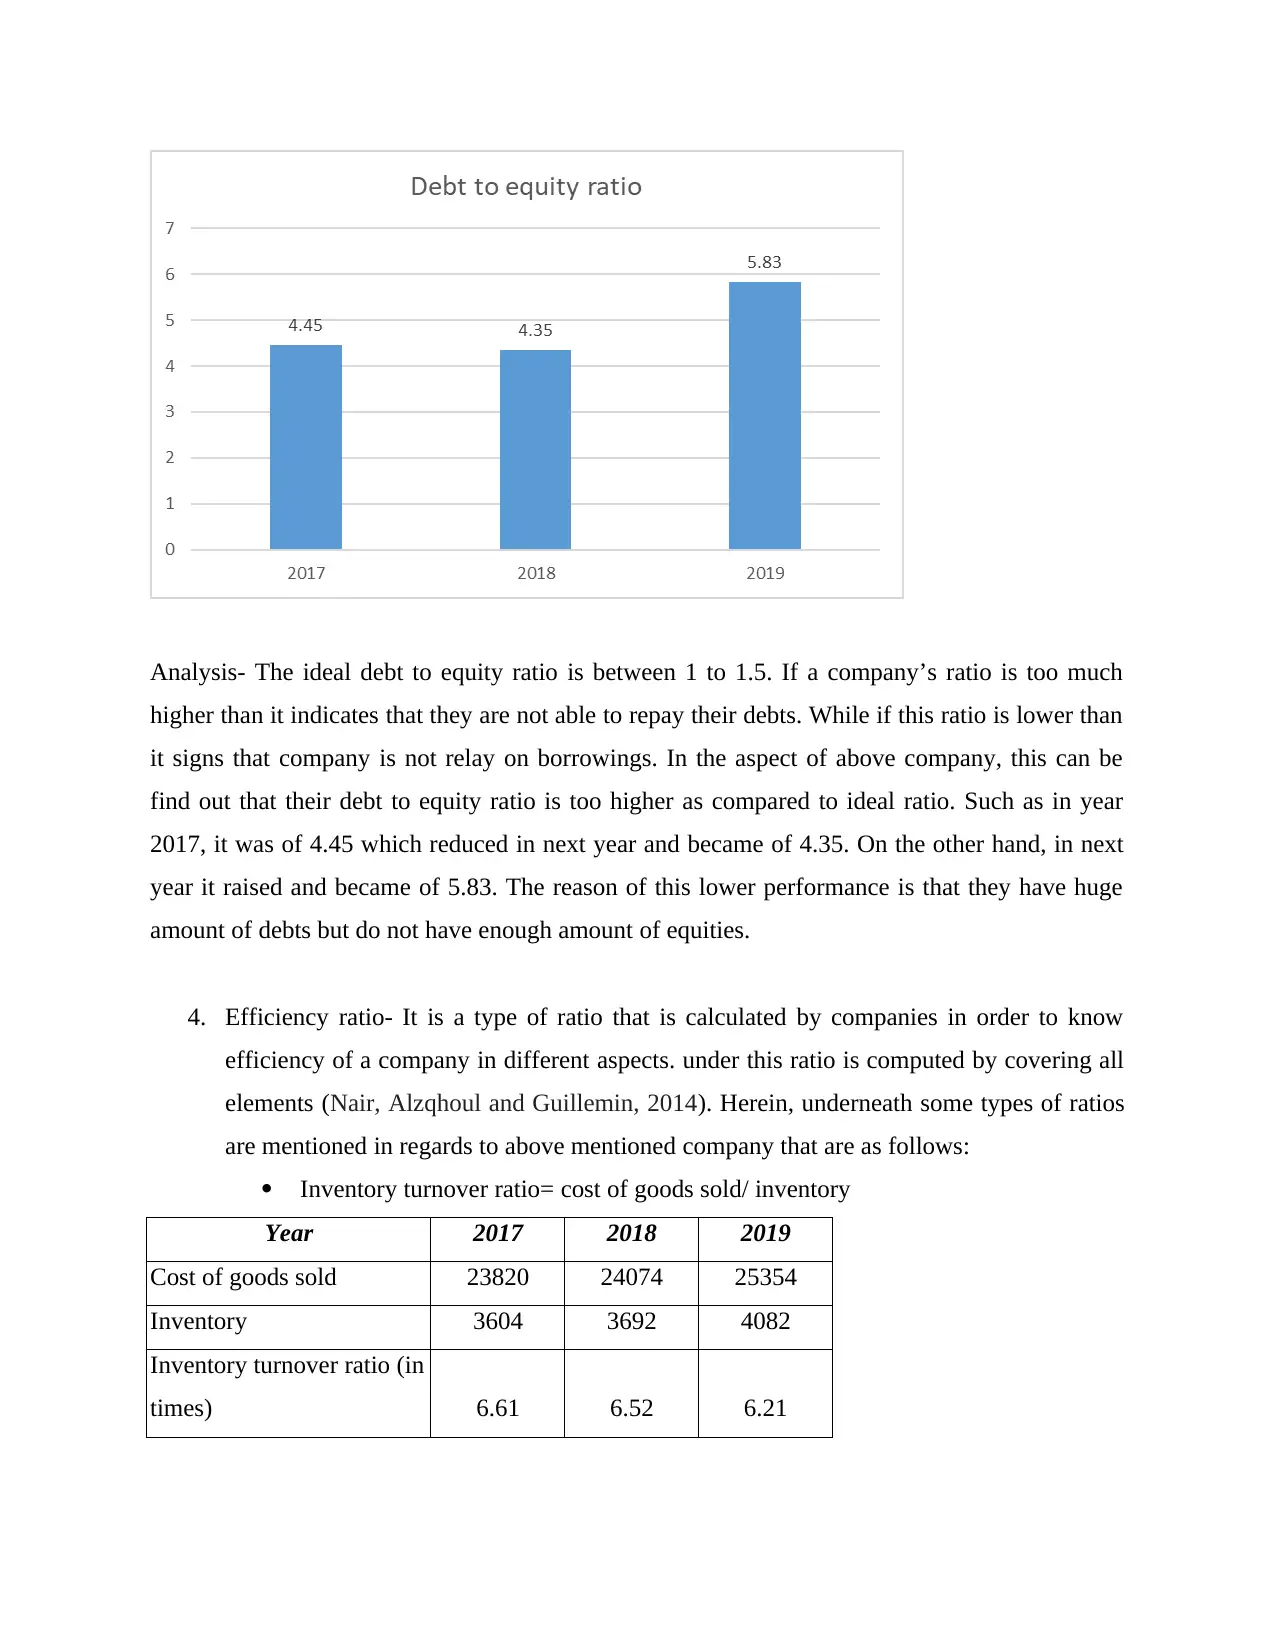
This report offers a comprehensive financial analysis of Imperial Brand plc, a UK-based tobacco manufacturing company. It meticulously examines the company's financial performance over three years (2017-2019) by calculating and interpreting various financial ratios. The analysis covers profitability ratios (gross profit margin, operating profit margin, net profit margin), liquidity ratios (current ratio, quick ratio), investor ratios (return on assets, dividend payout ratio, return on equity, debt to equity ratio), and efficiency ratios (inventory turnover, accounts receivable turnover, accounts payable turnover, total assets turnover, fixed assets turnover). The report evaluates the trends and implications of these ratios, offering insights into the company's financial health, efficiency, and ability to meet its financial obligations and provide returns to investors. The report also includes strategic recommendations based on the financial analysis.

ECONOMIC AND
FINANCIAL
MANAGEMENT
FINANCIAL
MANAGEMENT
Paraphrase This Document
Need a fresh take? Get an instant paraphrase of this document with our AI Paraphraser

Contents
Contents...........................................................................................................................................2
INTRODUCTION...........................................................................................................................3
MAIN BODY..................................................................................................................................3
CONCLUSION..............................................................................................................................18
REFERENCES..............................................................................................................................19

INTRODUCTION
Financial management is a key aspect for companies in order to make effective utilisation of
available financial resources. There are different types of techniques and methods which are used
for making analysis of financial performance of companies (Wei, Wang, Leng and Ji, 2013).
The objective of project report is analysing financial condition of UK based company that is
Imperial brand plc. This company is involved in process of manufacturing tobacco products
whose headquarter is in Bristol, United Kingdom. The project report covers detailed information
about evaluation of different types of ratios to assess financial performance as well as role of
financial information is interpreted to take crucial decisions. The end part of report covers
information regards to key strategic steps that are needed to be taken by chosen company.
MAIN BODY
Analysis of financial performance of chosen organisation:
In accordance of given task of the project report, financial analysis of Imperial brand plc
is required to be done by help of different types of ratios. As well as some ratios are targeted to a
particular external stakeholder that is investors who invest fund in company as per the financial
condition. Herein, underneath financial analysis of above company has been done in such
manner that is as follows:
1. Profitability ratio- This can be defined as a type of ratio that is calculated by companies
in order to know about level of profitability during a particular accounting period (Julien,
2013). Under it, different types of ratios are included and some of them are mentioned
below in regards to chosen company:
Gross profit ratio= Gross profit / net sales * 100
Year 2017 2018 2019
Gross profit 6427 6450 6240
Net sales 30247 30524 31594
Gross profit ratio (in %) 21.25 21.13 19.75
⊘ This is a preview!⊘
Do you want full access?
Subscribe today to unlock all pages.

Trusted by 1+ million students worldwide

Analysis- On the basis of above prepared column chart, this can be find out that gross profit
margin of above company has been decreased in a significant manner during three years. Such as
in year 2017, the gross profit ratio was of 21.25% which reduced and became of 21.13% in year
2018. Same as in year 2019 also it decreased till 19.75%. This is indicating that company is
unable to generate higher profit after deducting cost of sales from revenues.
Operating profit margin= Operating profit / net sales *100
Year 2017 2018 2019
Operating profit 2669 2713 2492
Net sales 30247 30524 31594
Operating profit ratio (in
%) 8.82 8.89 7.89
Paraphrase This Document
Need a fresh take? Get an instant paraphrase of this document with our AI Paraphraser

Analysis- In accordance of above prepared column chart of operating margin, this can be find out
that in current year 2019, company’s performance is weaker as compared to past years. Like in
year 2017, the operating margin was of 8.82% that increased by a little margin and became of
8.89%. While in next year 2019, it reduced and became of 7.89%. This is showing that company
is unable to manage their operating expenses and that is why their operating margin is lower.
Net profit margin= Net profit / Net sales*100
Year 2017 2018 2019
Net profit 1409 1368 1010
Net sales 30247 30524 31594
Net profit ratio (in %) 4.66 4.48 3.20

Analysis- Same as the above mentioned profitability ratios, this ratio is also weaker in last two
years. It is so because in year 2017, the net profit margin was of 4.66% which reduced and
became of 4.48% in year 2018. Same as in next year also, it decreased and became of 3.20%. It
is showing that company’s efficiency to generate net income on overall expenses is lower. Due
to which investor may ignore this company to do further investment.
2. Liquidity ratio- It can be characterised as a form of ratio that is calculated by companies
in order to know level of liquidity (Delen, Kuzey and Uyar, 2013). The objective of
calculating this ratio is to assess availability of cash position to make payment of short
term debts. Under this, different types of ratios are included and some of them are
mentioned below in such manner:
Current ratio= Current assets / current liabilities
Year 2017 2018 2019
Current assets 6896 7253 11088
Current liabilities 10878 11237 12382
Current ratio (in times) 0.63 0.65 0.90
⊘ This is a preview!⊘
Do you want full access?
Subscribe today to unlock all pages.

Trusted by 1+ million students worldwide

Analysis- The current ratio of companies is considered best when they have two times of assets
to make payment of one times of liabilities. In the context of above company’s current ratio, it
can be find out that their ratio is improving effectively in all three years such as in year 2017, it
was of 0.63 times which increased by a little margin and became of 0.65 times. Same as in year
2019, it increased by 38.46% and became of 0.90 times. In all three years, company’s current
ratio was lower than ideal ratio.
Quick ratio= Quick assets / current liabilities
Year 2017 2018 2019
Quick assets 3292 3561 6855
Current liabilities 10878 11237 12382
Quick ratio (in times) 0.30 0.32 0.55
Paraphrase This Document
Need a fresh take? Get an instant paraphrase of this document with our AI Paraphraser

Analysis- The ideal quick ratio is considered as 1.5:1 times which states that companies should
have 1.5 times of assets in proportion to 1 times of liability. In the context of above company,
this can be find out that their quick ratio is increasing with slower pace in all three years. Like in
year 2017, it was of 0.3 times that raised by a little margin and became of 0.32 times. As well as
in year 2019 also it raised and became of 0.55 times. Though, in all three years’ company’s quick
ratio is below ideal ratio. It is indicating that company do not have enough amount of quick
assets to pay current liabilities.
3. Investors ratio- This is defined as a type of ratio which is so beneficial for investors. It is
so because by help of this ratio, they can become aware about efficiency of generating
return of a company (Leufvén and Eriksson, 2016). Under this ratio, a wide range of
ratios are included and some of them are mentioned in such manner:
Return on assets= Net income / Total assets
Year 2017 2018 2019
Net income 1409 1368 1010
Total assets 30990 30848 33730
Return on assets 0.05 0.04 0.03

Analysis- This ratio shows efficiency of a company to generate return on assets. On the basis of
above presented column chart of above company, this can be find out that theur efficiency to
produce return on available assets is decreasing in all three years. Like in year 2017, this was of
0.05 that reduced in next two years 2018 and 2019 till 0.04 and 0.03. This is so because of lack
of management of assets.
Dividend pay-out ratio= Dividend paid / net income
Year 2017 2018 2019
Dividend paid 1528 1676 1844
Net income 1409 1368 1010
Dividend paid ratio 1.08 1.23 1.83
⊘ This is a preview!⊘
Do you want full access?
Subscribe today to unlock all pages.

Trusted by 1+ million students worldwide

Analysis- This ratio shows about efficiency of a company in order to provide dividend to
shareholders. If this ratio is higher than it is considered that company’s stakeholders are getting a
good amount of dividend. In the context of above mentioned company, it can be find out that
they are paying higher amount of dividend to their shareholders. Such as in year 2017, this ratio
was of 1.08 that raised and became of 1.23 in year 2018. Same as in year 2019, it increased till
1.83. This analysis of dividend pay-out ratio is showing that company is paying good amount of
dividend to their shareholders.
Return on equity= Net income/ stakeholders' equity
Year 2017 2018 2019
Net income 1409 1368 1010
Stakeholders' equity 5684 5770 4937
Return on equity 0.25 0.24 0.20
Paraphrase This Document
Need a fresh take? Get an instant paraphrase of this document with our AI Paraphraser

Analysis- On the basis of above presented column chart of this company, it can be find out that
their efficiency to pay return on the equity is lower in all three years as well as this is decreasing
also. Such as in year 2017, it was of 0.25 which reduced and became of 0.24 in year 2018. As
well as in year 2019, it became of 0.20. Thus, this company is not paying higher amount of
return on the equity. The reason of this lower performance is that their net profit is decreasing in
three years with a significant amount.
Debt to equity ratio= Total liabilities/ Total stakeholders' equity
Year 2017 2018 2019
Total liabilities 25306 25078 28793
Stakeholders' equity 5684 5770 4937
Debt to equity ratio 4.45 4.35 5.83

Analysis- The ideal debt to equity ratio is between 1 to 1.5. If a company’s ratio is too much
higher than it indicates that they are not able to repay their debts. While if this ratio is lower than
it signs that company is not relay on borrowings. In the aspect of above company, this can be
find out that their debt to equity ratio is too higher as compared to ideal ratio. Such as in year
2017, it was of 4.45 which reduced in next year and became of 4.35. On the other hand, in next
year it raised and became of 5.83. The reason of this lower performance is that they have huge
amount of debts but do not have enough amount of equities.
4. Efficiency ratio- It is a type of ratio that is calculated by companies in order to know
efficiency of a company in different aspects. under this ratio is computed by covering all
elements (Nair, Alzqhoul and Guillemin, 2014). Herein, underneath some types of ratios
are mentioned in regards to above mentioned company that are as follows:
Inventory turnover ratio= cost of goods sold/ inventory
Year 2017 2018 2019
Cost of goods sold 23820 24074 25354
Inventory 3604 3692 4082
Inventory turnover ratio (in
times) 6.61 6.52 6.21
⊘ This is a preview!⊘
Do you want full access?
Subscribe today to unlock all pages.

Trusted by 1+ million students worldwide
1 out of 19