Economic & Quantitative Analysis: Tax Impact on Market Efficiency

Verified

Added on  2022/07/27

|7
|468
|17
Homework Assignment
AI Summary
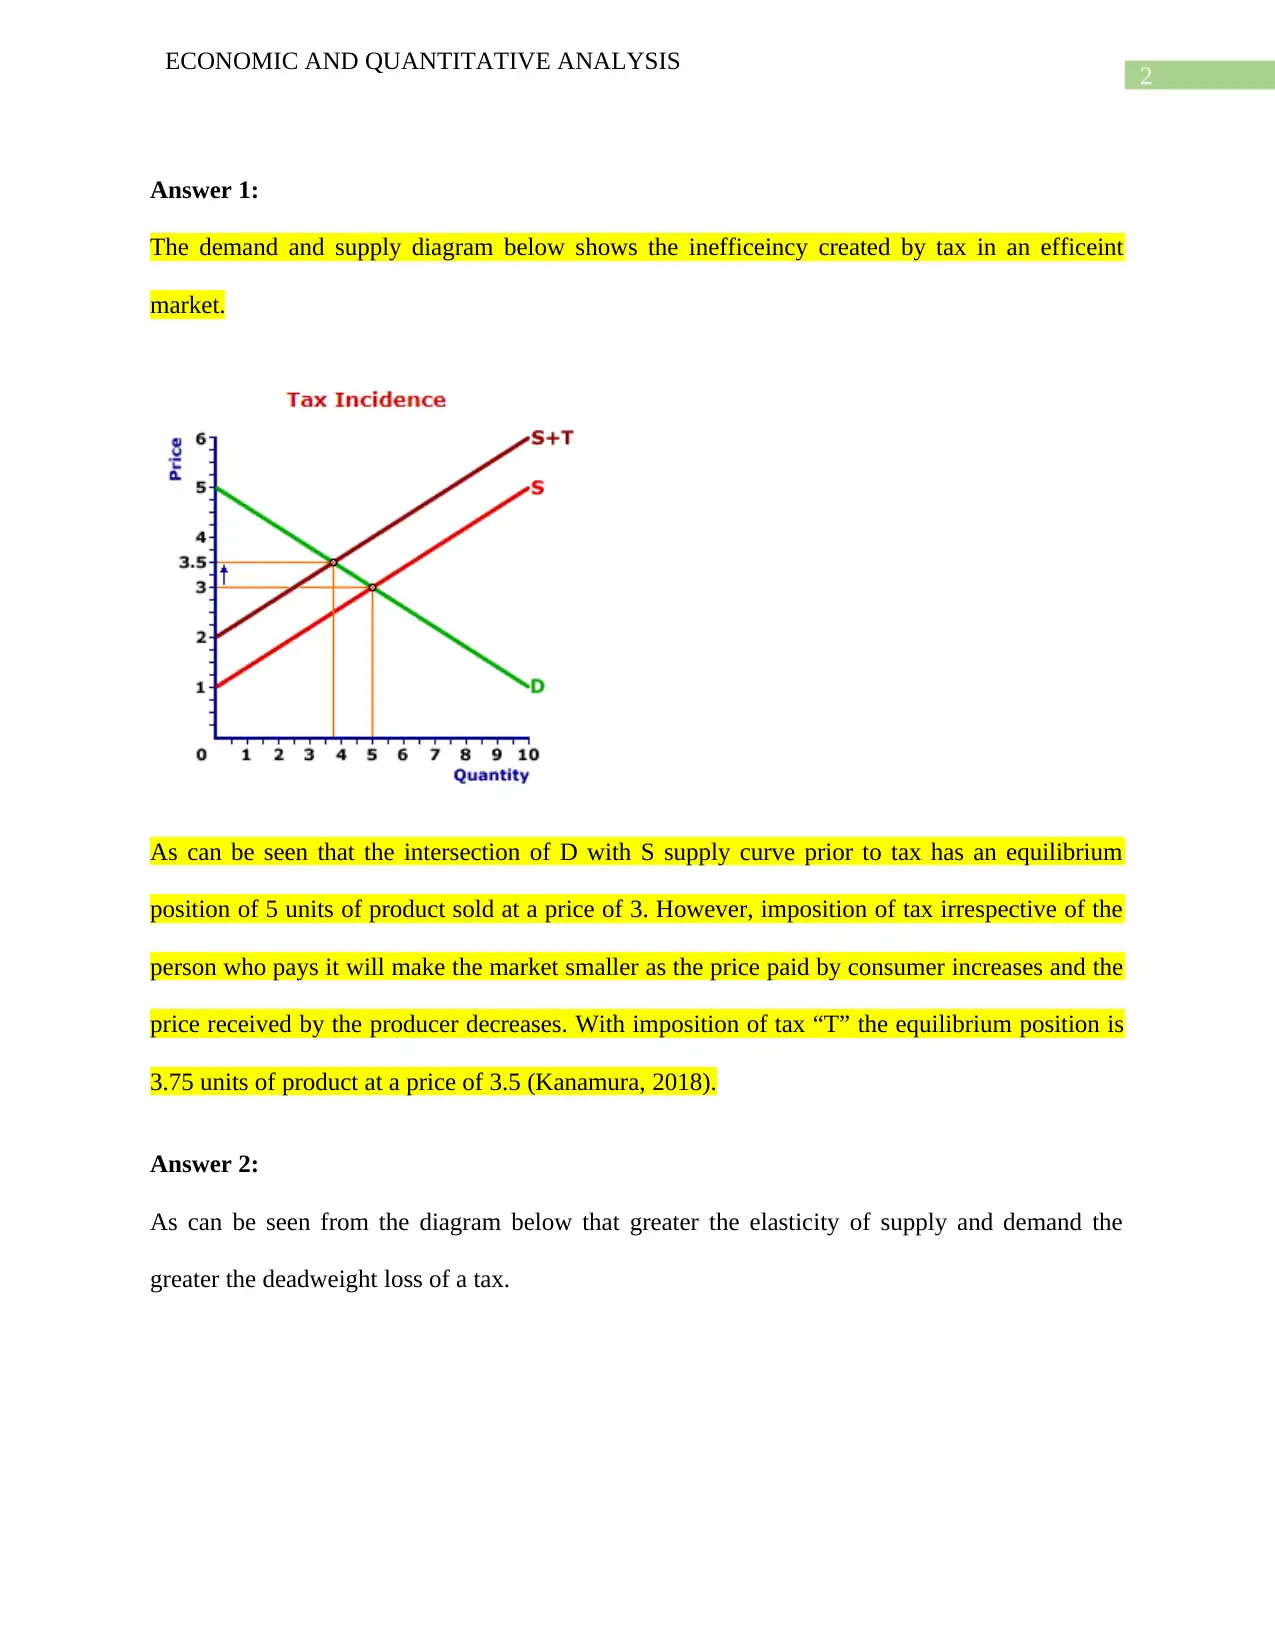
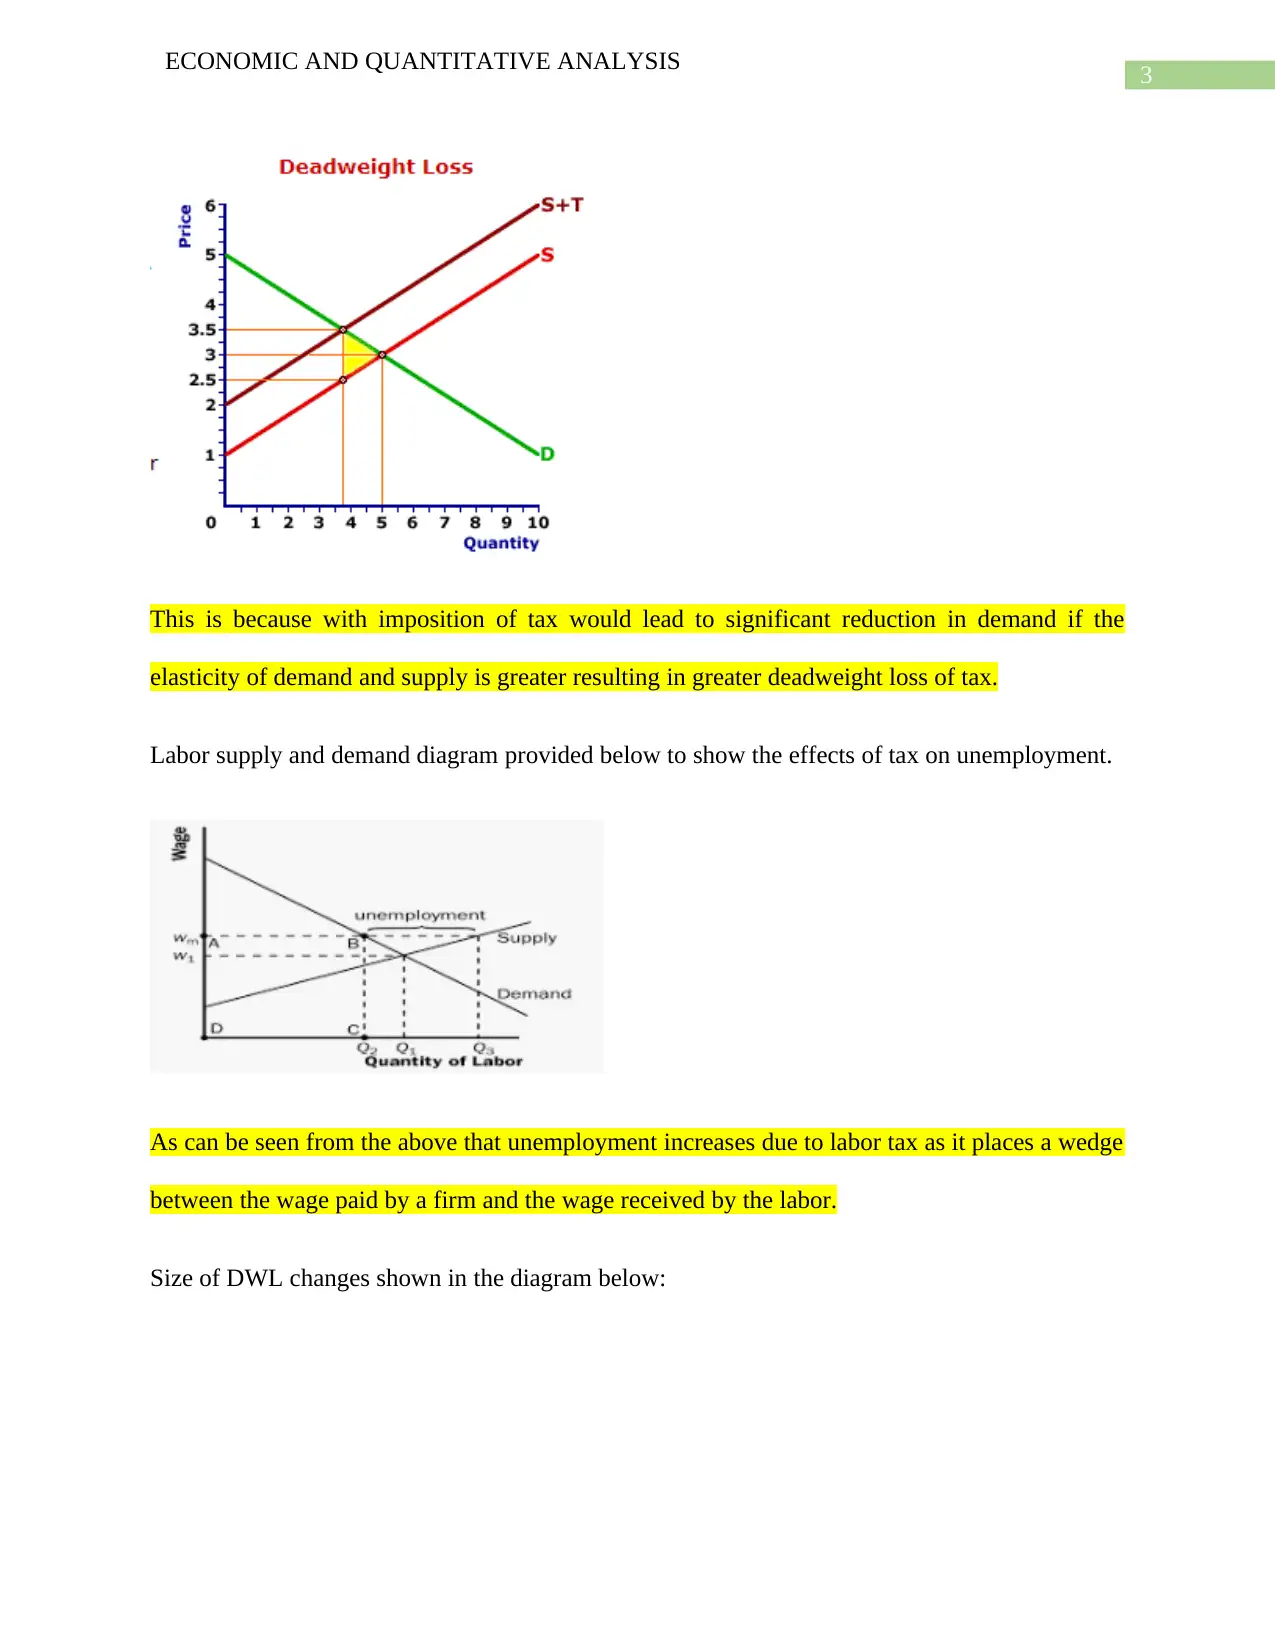
This assignment provides an economic and quantitative analysis of taxation, focusing on its impact on market efficiency and deadweight loss. It uses supply and demand diagrams to illustrate how taxes increase consumer prices, decrease producer revenue, and shrink market size, regardless of who the tax is levied on. The analysis further explores the relationship between the elasticity of supply and demand and the magnitude of deadweight loss, particularly in the context of labor taxes and unemployment. It also discusses how the size of a tax affects revenue, noting that while revenue initially rises with tax size, it eventually falls due to the distortionary effects of taxation. The assignment references relevant literature to support its analysis.
Document Page
Running head: ECONOMIC AND QUANTITATIVE ANALYSIS
Economic and Quantitative Analysis
Name of the Student:
Name of the University:
Authors Note:
tabler-icon-diamond-filled.svg

Paraphrase This Document

Need a fresh take? Get an instant paraphrase of this document with our AI Paraphraser
Document Page
1
ECONOMIC AND QUANTITATIVE ANALYSIS
Contents
Answer 1:.........................................................................................................................................2
Answer 2:.........................................................................................................................................2
Answer 3:.........................................................................................................................................4
References:......................................................................................................................................6
Document Page
2
ECONOMIC AND QUANTITATIVE ANALYSIS
Answer 1:
The demand and supply diagram below shows the inefficeincy created by tax in an efficeint
market.
As can be seen that the intersection of D with S supply curve prior to tax has an equilibrium
position of 5 units of product sold at a price of 3. However, imposition of tax irrespective of the
person who pays it will make the market smaller as the price paid by consumer increases and the
price received by the producer decreases. With imposition of tax “T” the equilibrium position is
3.75 units of product at a price of 3.5 (Kanamura, 2018).
Answer 2:
As can be seen from the diagram below that greater the elasticity of supply and demand the
greater the deadweight loss of a tax.
Document Page
3
ECONOMIC AND QUANTITATIVE ANALYSIS
This is because with imposition of tax would lead to significant reduction in demand if the
elasticity of demand and supply is greater resulting in greater deadweight loss of tax.
Labor supply and demand diagram provided below to show the effects of tax on unemployment.
As can be seen from the above that unemployment increases due to labor tax as it places a wedge
between the wage paid by a firm and the wage received by the labor.
Size of DWL changes shown in the diagram below:
tabler-icon-diamond-filled.svg

Paraphrase This Document

Need a fresh take? Get an instant paraphrase of this document with our AI Paraphraser
Document Page
4
ECONOMIC AND QUANTITATIVE ANALYSIS
Part d:
In a market where the unemployment rate is nil and the labor are in position to negotiate their
wage the labor supply will be elastic. Thus, in a situation where labor are in a perfectly
competitive market and can negotiate their wages with the firms the labor supply would be
elastic (Frisch, 2019).
Answer 3:
Pat a:
The diagram shows below deadweight loss caused by tax grow larger.
Document Page
5
ECONOMIC AND QUANTITATIVE ANALYSIS
Part b:
As can be seen from the above that as the size of tax grows larger first the revenue will rise but
eventually the revenue will fall due to imposition of tax.
Document Page
6
ECONOMIC AND QUANTITATIVE ANALYSIS
References:
Frisch, R. (2019). More Pitfalls in Demand and Supply Curve Analysis. The Quarterly Journal
Of Economics, 57(7), 749. doi: 10.2307/1883550
Kanamura, T. (2018). A Supply and Demand Based Volatility Model for Energy Prices - The
Relationship between Supply Curve Shape and Volatility. SSRN Electronic Journal, 3(3),
13-21. doi: 10.2139/ssrn.926794
chevron_up_icon
1 out of 7
circle_padding
hide_on_mobile
zoom_out_icon
[object Object]