Comprehensive Economic Report: Analyzing Singapore's Key Indicators
VerifiedAdded on 2023/06/16
|17
|3441
|251
Report
AI Summary
This report provides an in-depth analysis of Singapore's economic performance over the last ten years, focusing on key indicators such as aggregate economic output, employment status, and price levels. It examines Singapore's Gross Domestic Product (GDP) and its growth rate, revealing an overall rising trend with a notable expansion in 2017 driven by the manufacturing sector. The report also analyzes GDP per capita, highlighting Singapore's high average income relative to the world average. Furthermore, the report delves into the labor market, defining unemployment and its various types, including cyclical, structural, frictional, and seasonal unemployment, with a specific focus on the types prevalent in Singapore. Government measures to achieve full employment, such as the Career Support Program and Community Development Council initiatives, are also discussed. Finally, the report addresses price level analysis, defining inflation and its causes, examining inflation trends in Singapore, and outlining government measures to maintain price stability. The Singaporean government uses demand-side policies, fiscal and monetary, to affect aggregate output.
Running Head: ECONOMIC ASSIGNMENT
Economic Assignment
Name of the Student
Name of the University
Author note
Economic Assignment
Name of the Student
Name of the University
Author note
Paraphrase This Document
Need a fresh take? Get an instant paraphrase of this document with our AI Paraphraser
1ECONOMIC ASSIGNMENT
Table of Contents
1. Introduction..................................................................................................................................3
2. Production output performance analysis.....................................................................................3
2.1. Gross Domestic Product (GDP)............................................................................................3
2.2. GDP growth rate...................................................................................................................4
2.3. GDP per capita analysis........................................................................................................6
2.4.Government measure adapted to achieve production output performance...........................7
3. Labor market analysis..................................................................................................................7
3.1. Definition of Unemployment and its type............................................................................7
3.2. Trend of Unemployment.......................................................................................................9
3.3. Types of unemployment in Singapore..................................................................................9
3.4. Government measure to achieve full employment.............................................................10
4. Price level analysis....................................................................................................................11
4.1. Definition of inflation and its typical cause........................................................................11
4.2. Trends of inflation..............................................................................................................13
4.3. Causes of inflation in Singapore.........................................................................................14
4.4. Government measure to achieve stable price.....................................................................14
5. Conclusion.................................................................................................................................14
6. References..................................................................................................................................16
2ECONOMIC ASSIGNMENT
1. Introduction
The economic characteristic of Singapore resembles to the nature of a developed nation.
In this nation, economic reliance is mostly on a policy of free market. Singapore employs a free
trade policy with heavy export of electronic machinery and equipment, Mineral fuels,
pharmaceutical, gems and precious metal, organic chemicals and other chemicals. Among these,
the fastest growing export sectors are Optical, medical and technical apparatus. The major
imports of Singapore include Integrated Circuits, Gas Turbines, Refined Petroleum, computers
and crude petroleum.
The economic performances of Singapore economy for the last ten years are analyzedin
this paper. For evaluating economic performance the three main economic indicators such as
aggregate economic output, employment status and price level are considered. Besides free
market economy, government intervenes to promote economic performance. In order to promote
economic growth and development, saving and investment policies are undertaken by the
government. The government’s policies are designed to increase aggregate output level, achieve
a state of full employment and stability in the price level.
2. Production output performance analysis
2.1. Gross Domestic Product (GDP)
Gross Domestic Product is defines as a quantitative measures representing aggregate
economic activity of nation. It is the money values of produced goods and services within a
specific geographic region in the accounting year. There are different methods of estimating
Gross Domestic Product, the most common being aggregate expenditure method. In the method
of GDP computationeither the market value of current year or the values of a base year is used.
The former is called nominal GDP while the later is termed as real GDP (Bernanke, Antonovics
⊘ This is a preview!⊘
Do you want full access?
Subscribe today to unlock all pages.
Trusted by 1+ million students worldwide
3ECONOMIC ASSIGNMENT
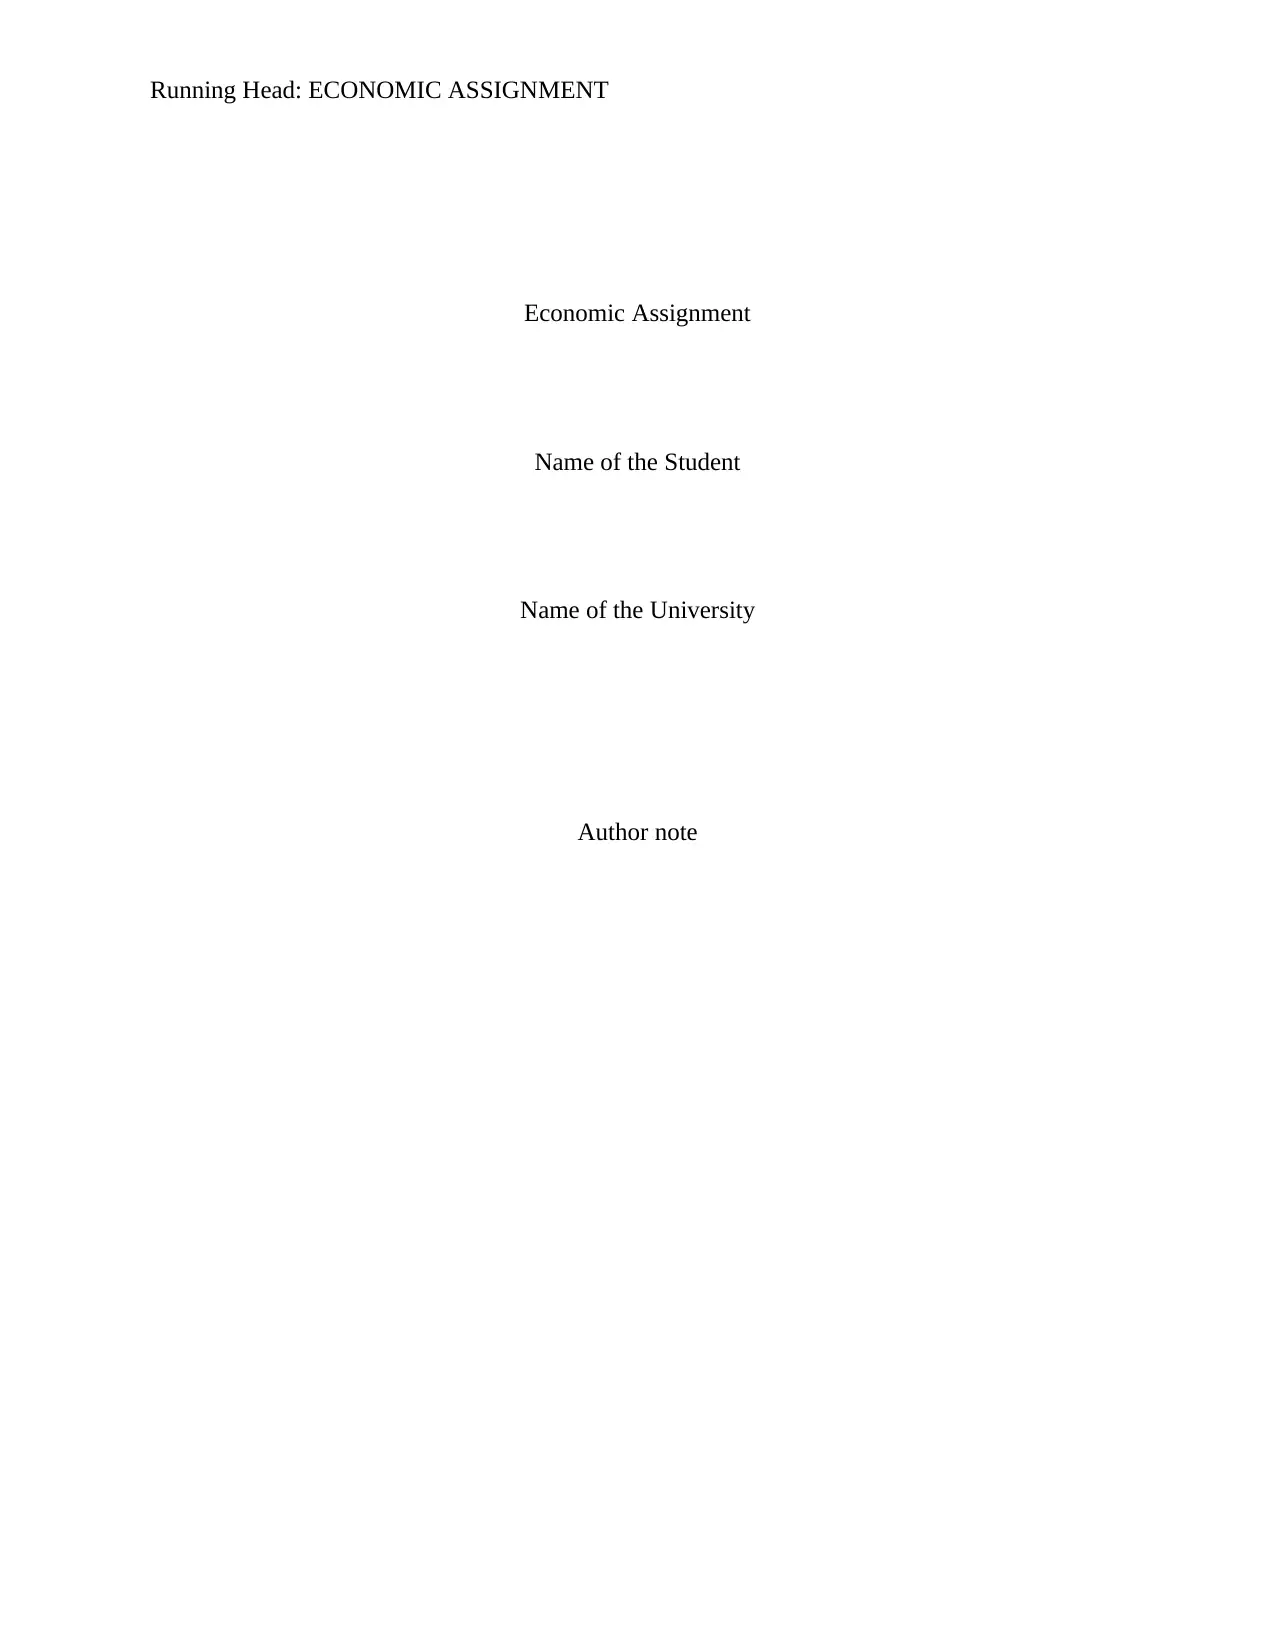
& Frank, 2015). The real GDP determines GDP at constant prices and hence is adjusted for
inflation. Real GDP is a more accurate measure of actual output performance of the economy.
Figure 1: Real GDP in Singapore
(Source: trradingeconomics.com, 2017)
The real GDP figures of Singapore reveal that GDP has become 104973.20 Singapore
Dollar Million in the third quarter of 2017 from 104973.20 SGD Million in the previous quarter.
There is an overall rising trend for Singapore GDP at constant prices. The average GDP at
constant prices from 1975 to 2017 is recorded as 42592.22 Singaporean Dollar in Million. The
all-time highest GDP is accounted in the third quarter of 2017 and is amounts to 104973.20
million Singaporean dollar. The recorded low GDP is estimated in 1975, the GDP figure being
only 7052.10 Singaporean Dollar in Million.
2.2. GDP growth rate
Growth in GDP is the percentage change in GDP in a year with respect to its previous
year. The growth rate is computed by taking the difference between GDP of two consecutive
Paraphrase This Document
Need a fresh take? Get an instant paraphrase of this document with our AI Paraphraser
4ECONOMIC ASSIGNMENT
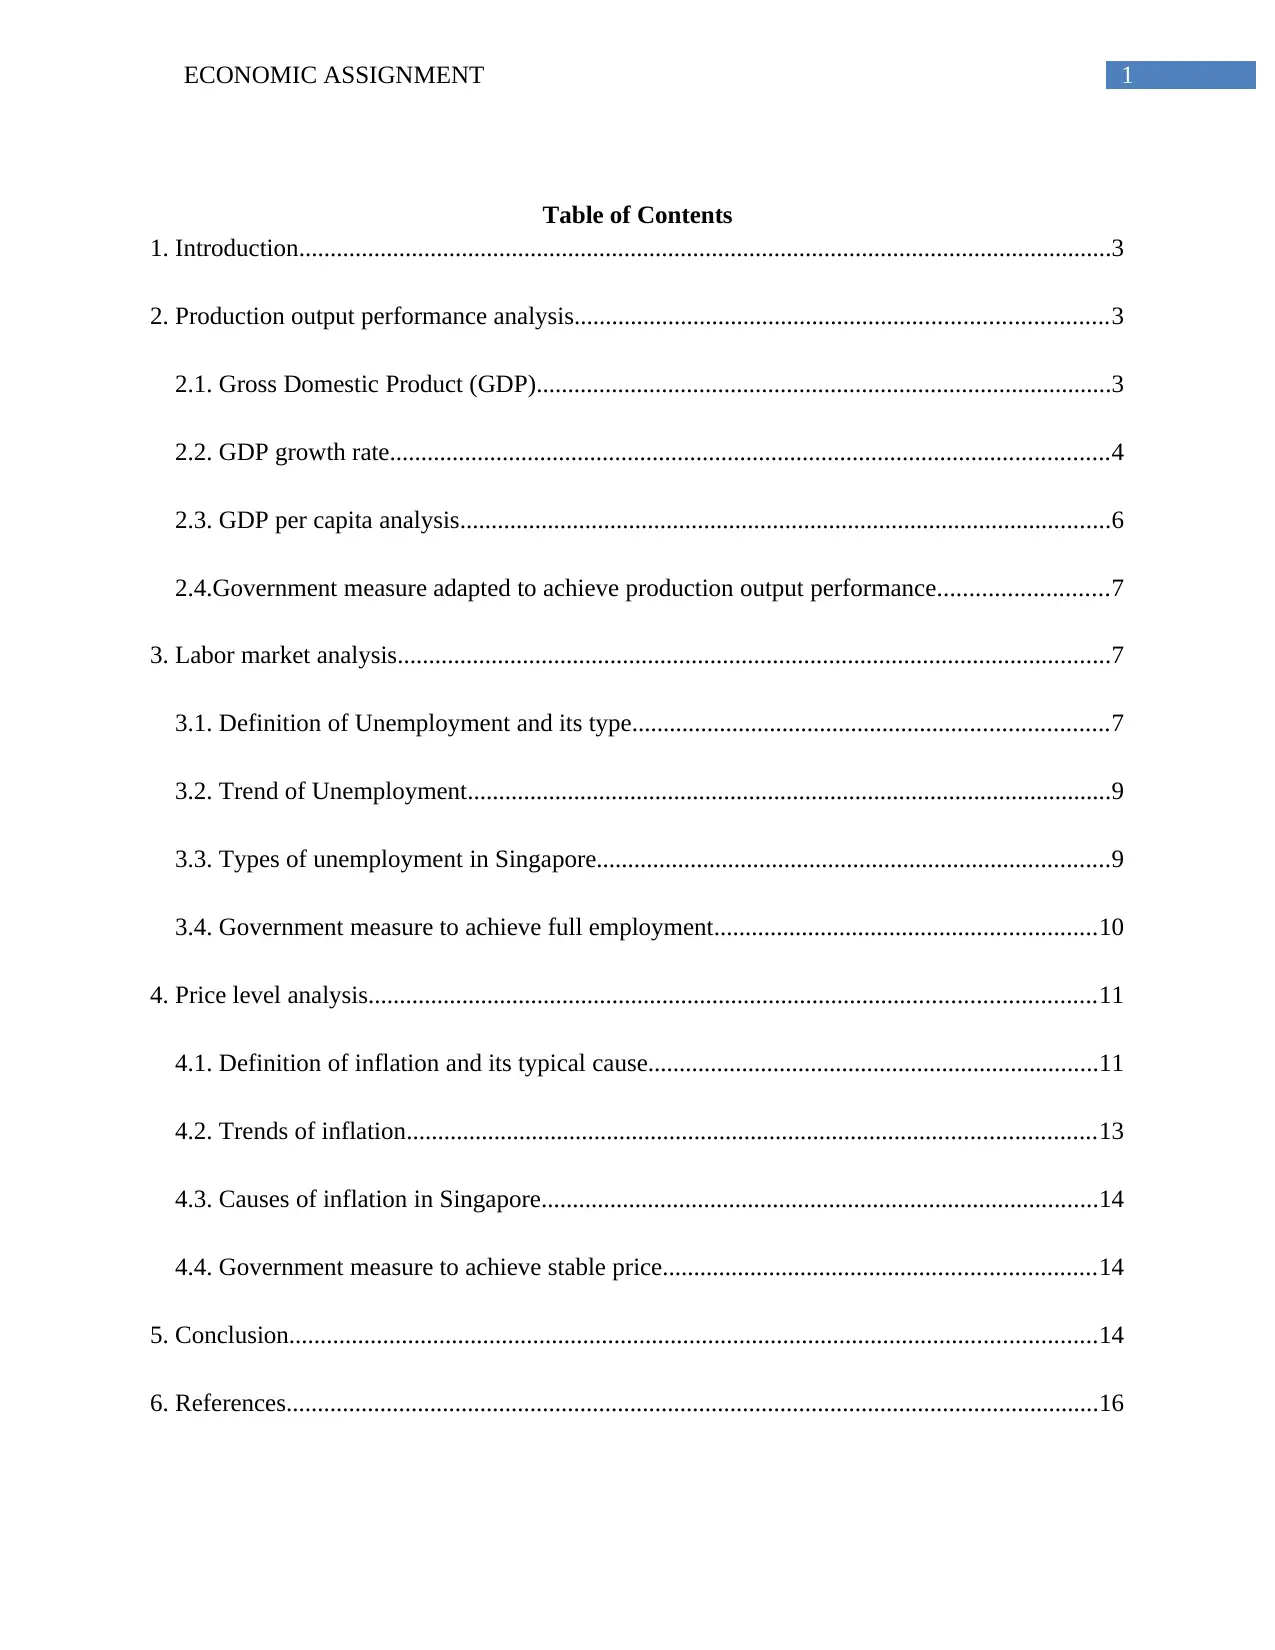
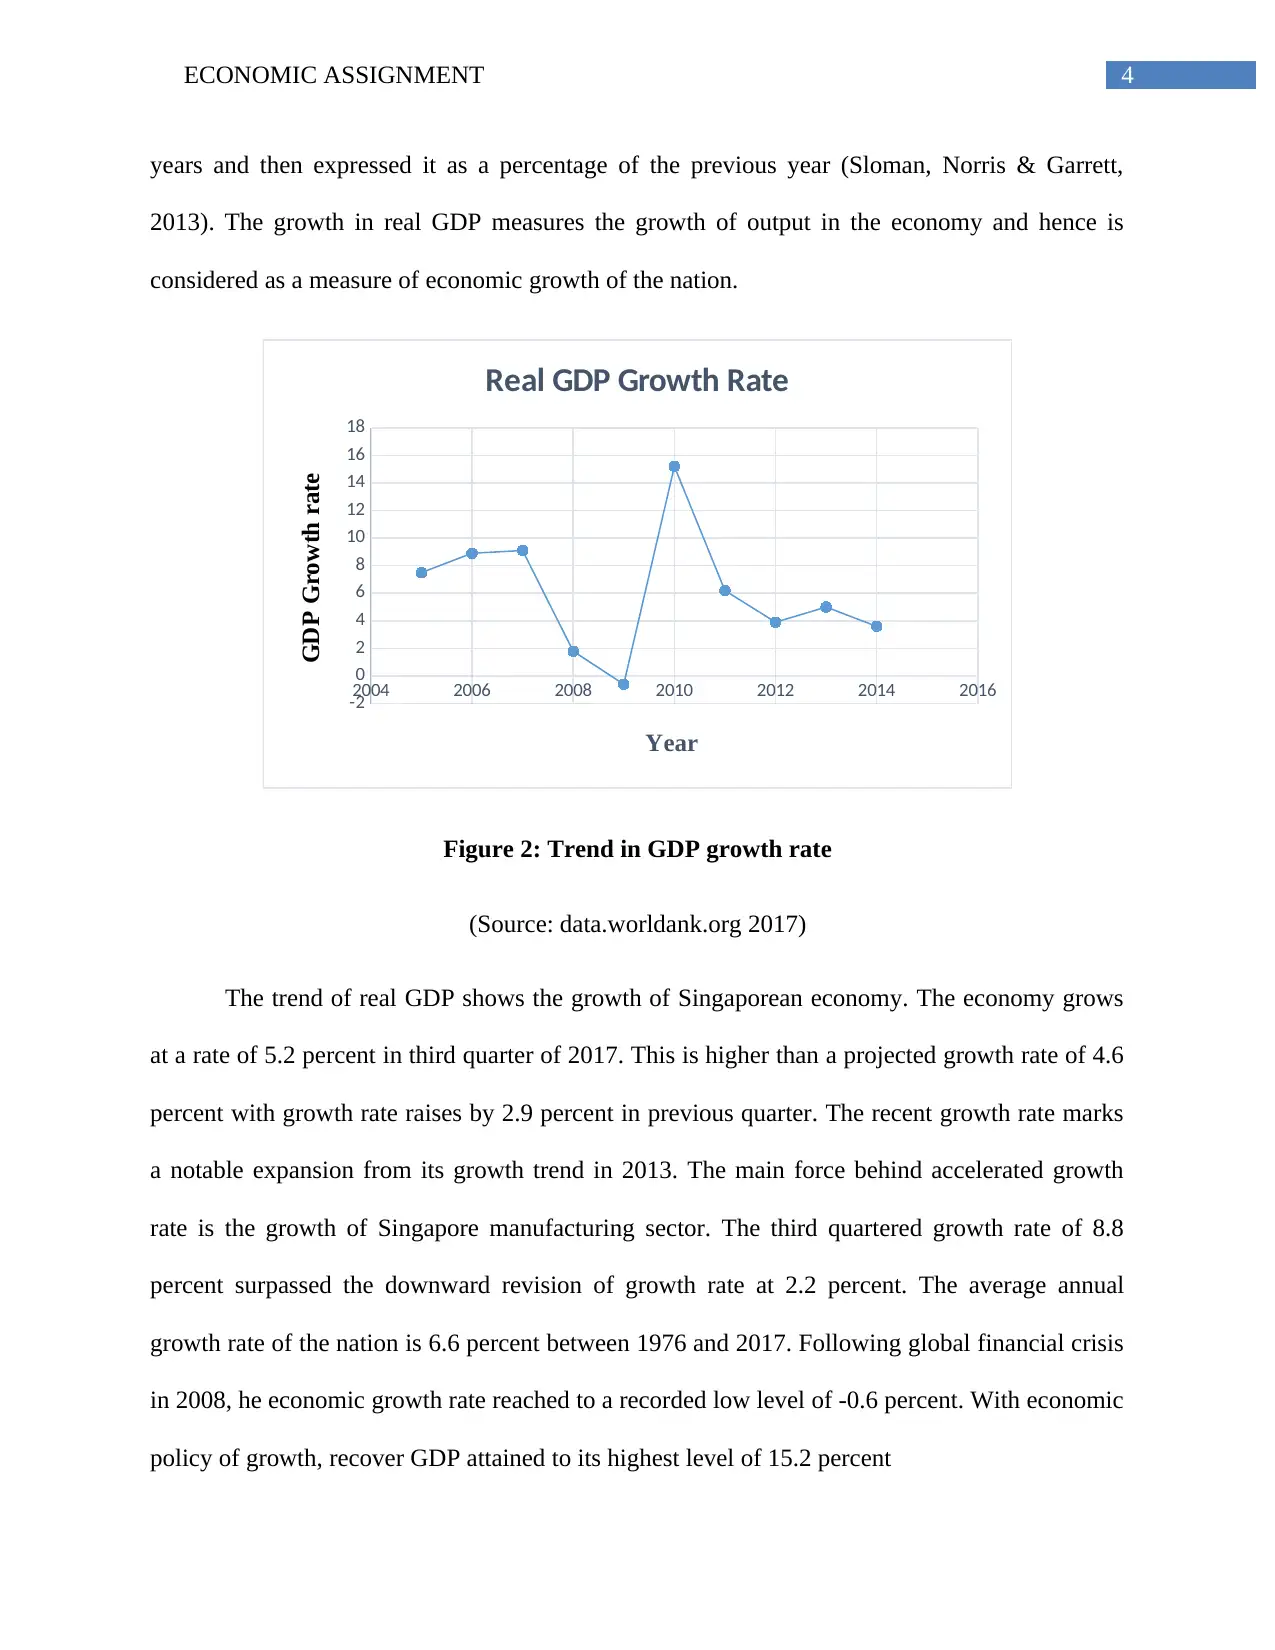
years and then expressed it as a percentage of the previous year (Sloman, Norris & Garrett,
2013). The growth in real GDP measures the growth of output in the economy and hence is
considered as a measure of economic growth of the nation.
2004 2006 2008 2010 2012 2014 2016
-2
0
2
4
6
8
10
12
14
16
18
Real GDP Growth Rate
Year
GDP Growth rate
Figure 2: Trend in GDP growth rate
(Source: data.worldank.org 2017)
The trend of real GDP shows the growth of Singaporean economy. The economy grows
at a rate of 5.2 percent in third quarter of 2017. This is higher than a projected growth rate of 4.6
percent with growth rate raises by 2.9 percent in previous quarter. The recent growth rate marks
a notable expansion from its growth trend in 2013. The main force behind accelerated growth
rate is the growth of Singapore manufacturing sector. The third quartered growth rate of 8.8
percent surpassed the downward revision of growth rate at 2.2 percent. The average annual
growth rate of the nation is 6.6 percent between 1976 and 2017. Following global financial crisis
in 2008, he economic growth rate reached to a recorded low level of -0.6 percent. With economic
policy of growth, recover GDP attained to its highest level of 15.2 percent
5ECONOMIC ASSIGNMENT
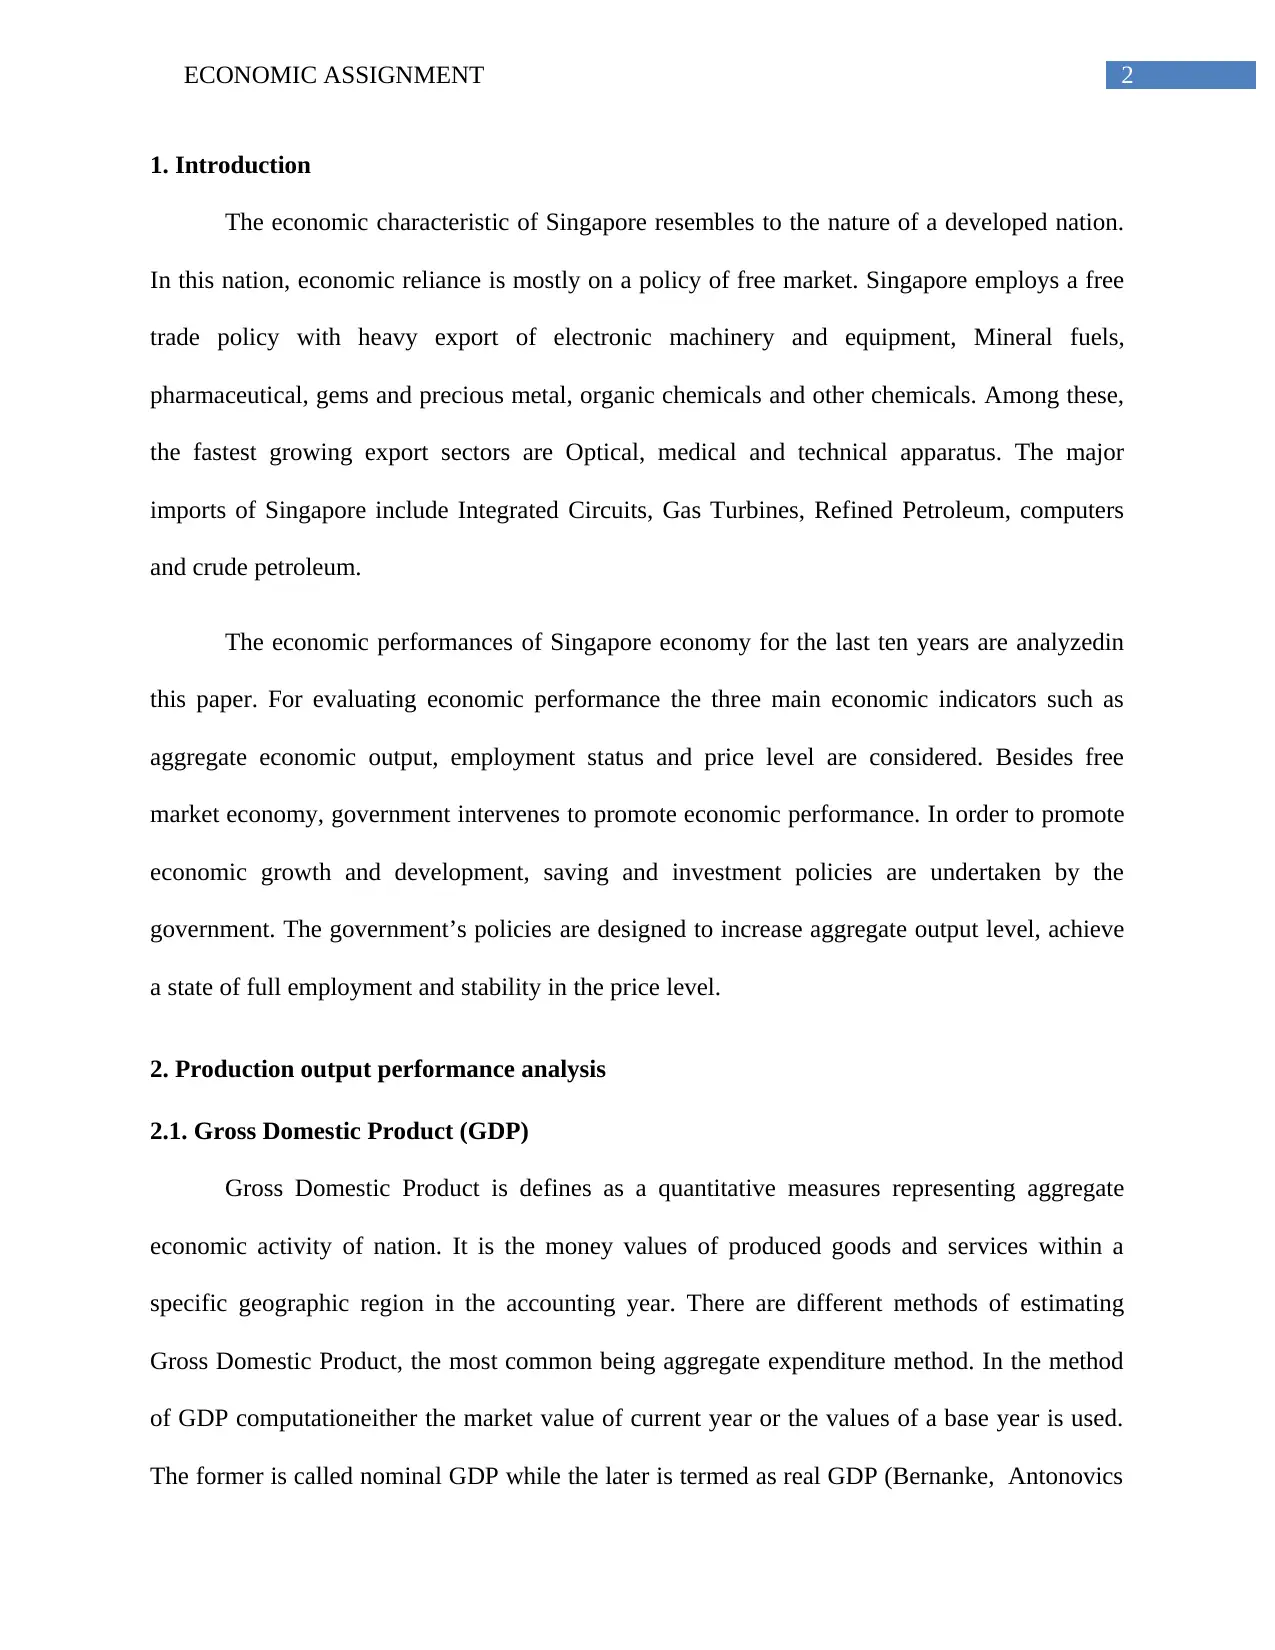
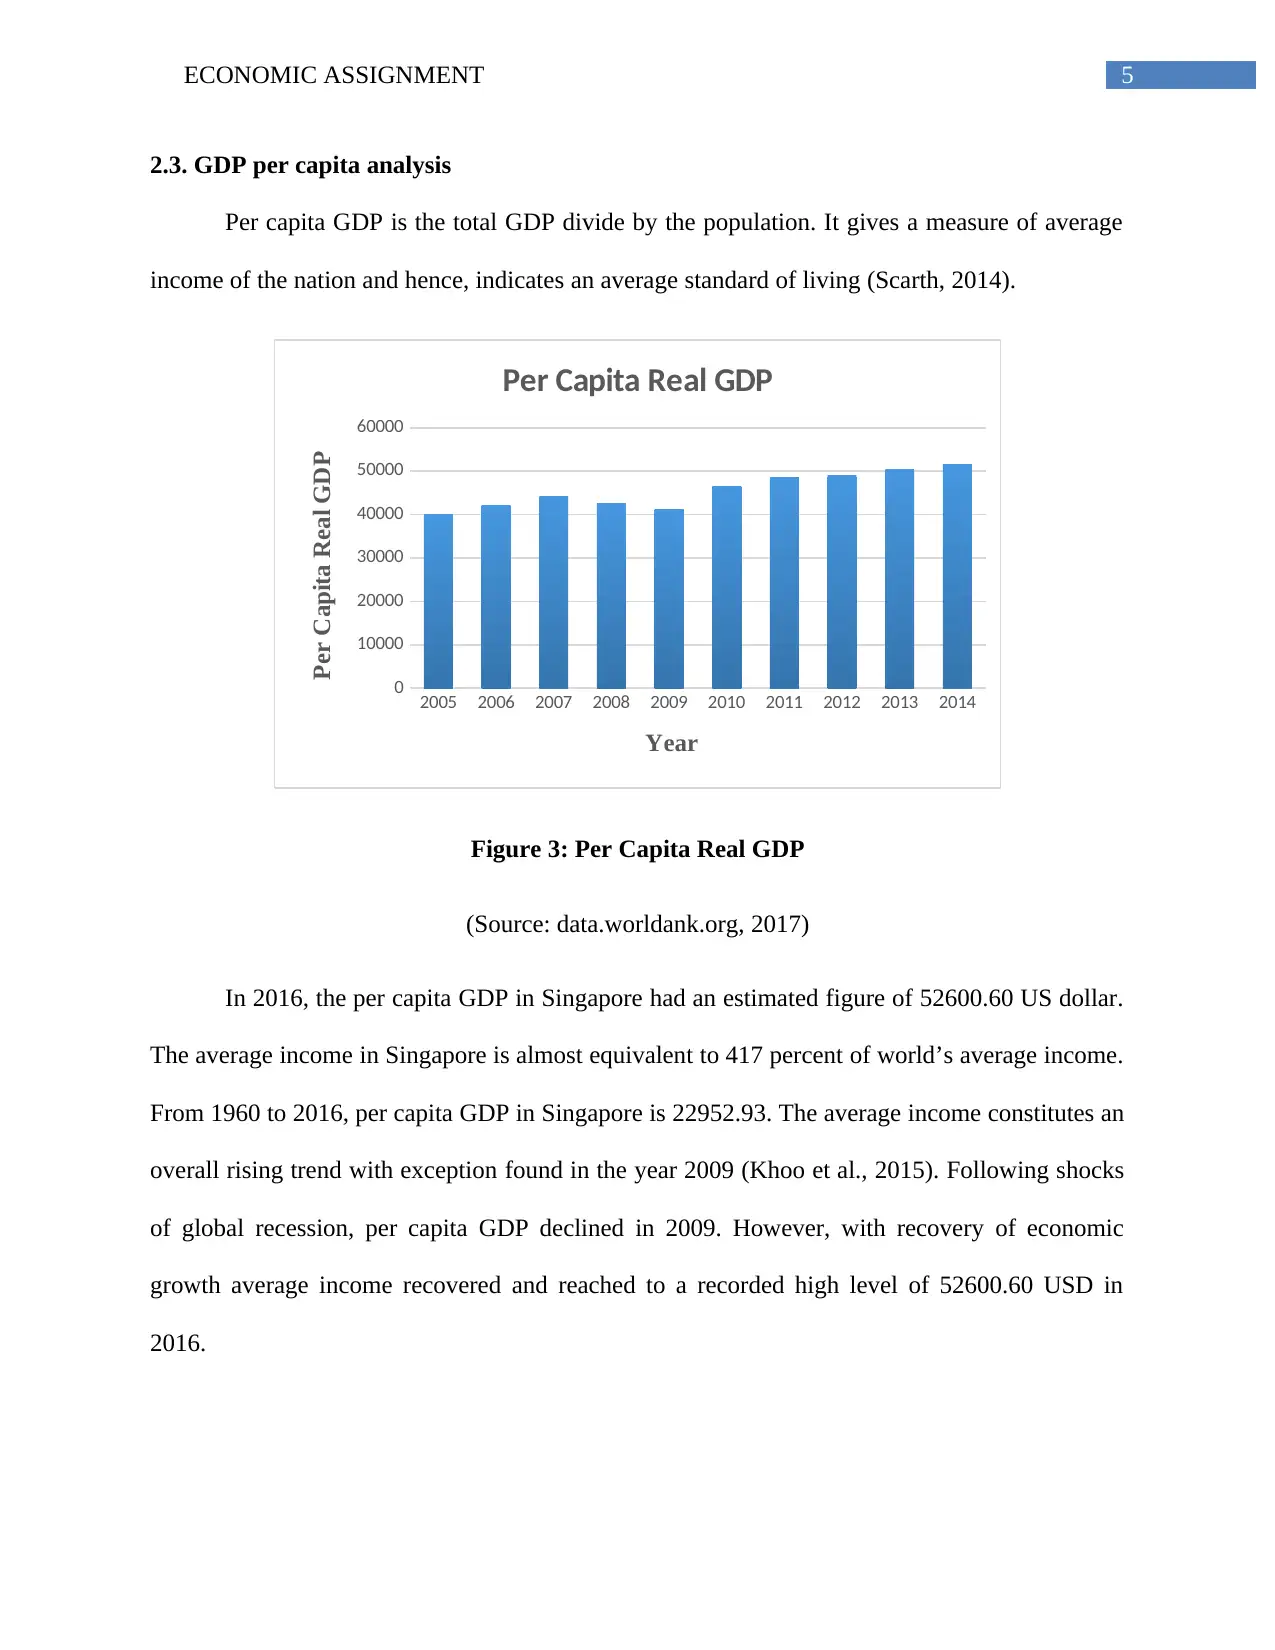
2.3. GDP per capita analysis
Per capita GDP is the total GDP divide by the population. It gives a measure of average
income of the nation and hence, indicates an average standard of living (Scarth, 2014).
2005 2006 2007 2008 2009 2010 2011 2012 2013 2014
0
10000
20000
30000
40000
50000
60000
Per Capita Real GDP
Year
Per Capita Real GDP
Figure 3: Per Capita Real GDP
(Source: data.worldank.org, 2017)
In 2016, the per capita GDP in Singapore had an estimated figure of 52600.60 US dollar.
The average income in Singapore is almost equivalent to 417 percent of world’s average income.
From 1960 to 2016, per capita GDP in Singapore is 22952.93. The average income constitutes an
overall rising trend with exception found in the year 2009 (Khoo et al., 2015). Following shocks
of global recession, per capita GDP declined in 2009. However, with recovery of economic
growth average income recovered and reached to a recorded high level of 52600.60 USD in
2016.
⊘ This is a preview!⊘
Do you want full access?
Subscribe today to unlock all pages.
Trusted by 1+ million students worldwide
6ECONOMIC ASSIGNMENT
2.4.Government measure adapted to achieve production output performance
The government to affect the aggregate output in the nation uses demand side policies.
There are two demand sided policies used by government- Fiscal policy and monetary policy.
The expansionary monetary and ease fiscal policy are used to boost the aggregate demand
(Agénor &Montiel, 2015).
Expansionary Fiscal Policy
Taxes and government expenditure are two instruments of fiscal policy. In times of
expansionary fiscal policy,government reduces either tax rates or government
expenditure.Singapore government raises expenditure in different areas with major focus on
infrastructure sector. Infrastructure sector is an import sector for any nation that attract further
investment. The government to raise investment in infrastructure has launched the Resilience
package (Tan, Lean & Khan, 2014). Besides this, government increases spending in education
and training program to bring economic growth led by productivity growth.
Ease Monetary Policy
Ease monetary policy means increasing money supply of the nation. Singapore uses open
market operation to raise the supply of money. This increases the investment base leading to an
increase in national output.
3. Labor market analysis
3.1. Definition of Unemployment and its type
Unemployment in an economy is defined as a situation when some people in the labor
force though willing to do jobs but are unable to find any suitable opportunity. There are several
Paraphrase This Document
Need a fresh take? Get an instant paraphrase of this document with our AI Paraphraser
7ECONOMIC ASSIGNMENT
reasons causing unemployment in the economy. There are different kinds of unemployment
depending on nature and cause of unemployment.
Cyclical Unemployment
The economy passes through phases of short-term fluctuation before attaining stable log
term growth. These fluctuations are defined as phases of business cycle. In the recession phase,
there is a decline in the growth rate causing economic contraction and job losses for many people
(Rodan, 2016). This type of unemployment is called cyclical unemployment.
Structural Unemployment
The change is sectorial or structural composition causes structural unemployment.
Structural change the skills of the existing labor force does not match with available jobs. Hence,
unemployment is crated.
Frictional Unemployment
There is some time lag involved in time of transition from one job to another. After the
turnover, it usually takes some time to get new job. This is the phase when people are called
frictionally unemployment.
Seasonal Unemployment
Some occupationsdepend on seasons. After passes of this particular season, people
remain unemployed. Examples of such industries include farming, leisure and tourism and the
like.
8ECONOMIC ASSIGNMENT
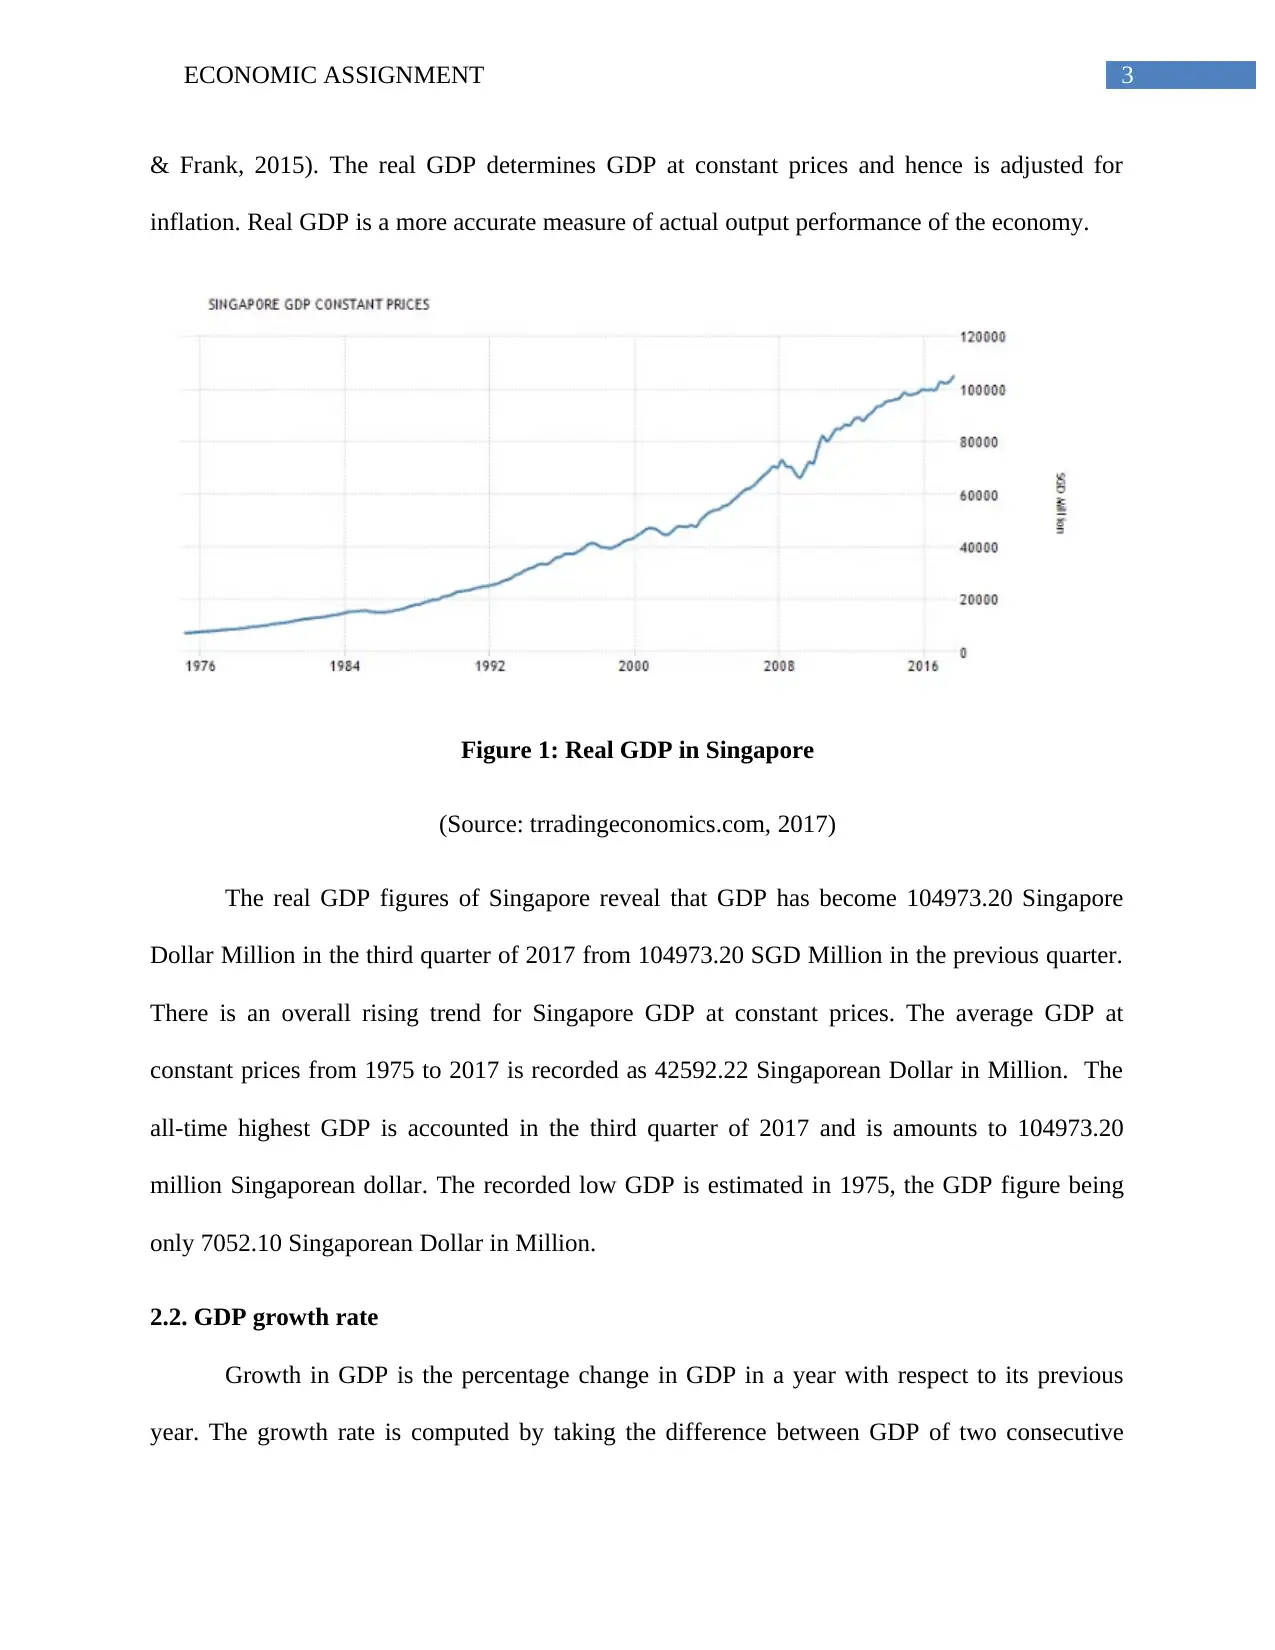
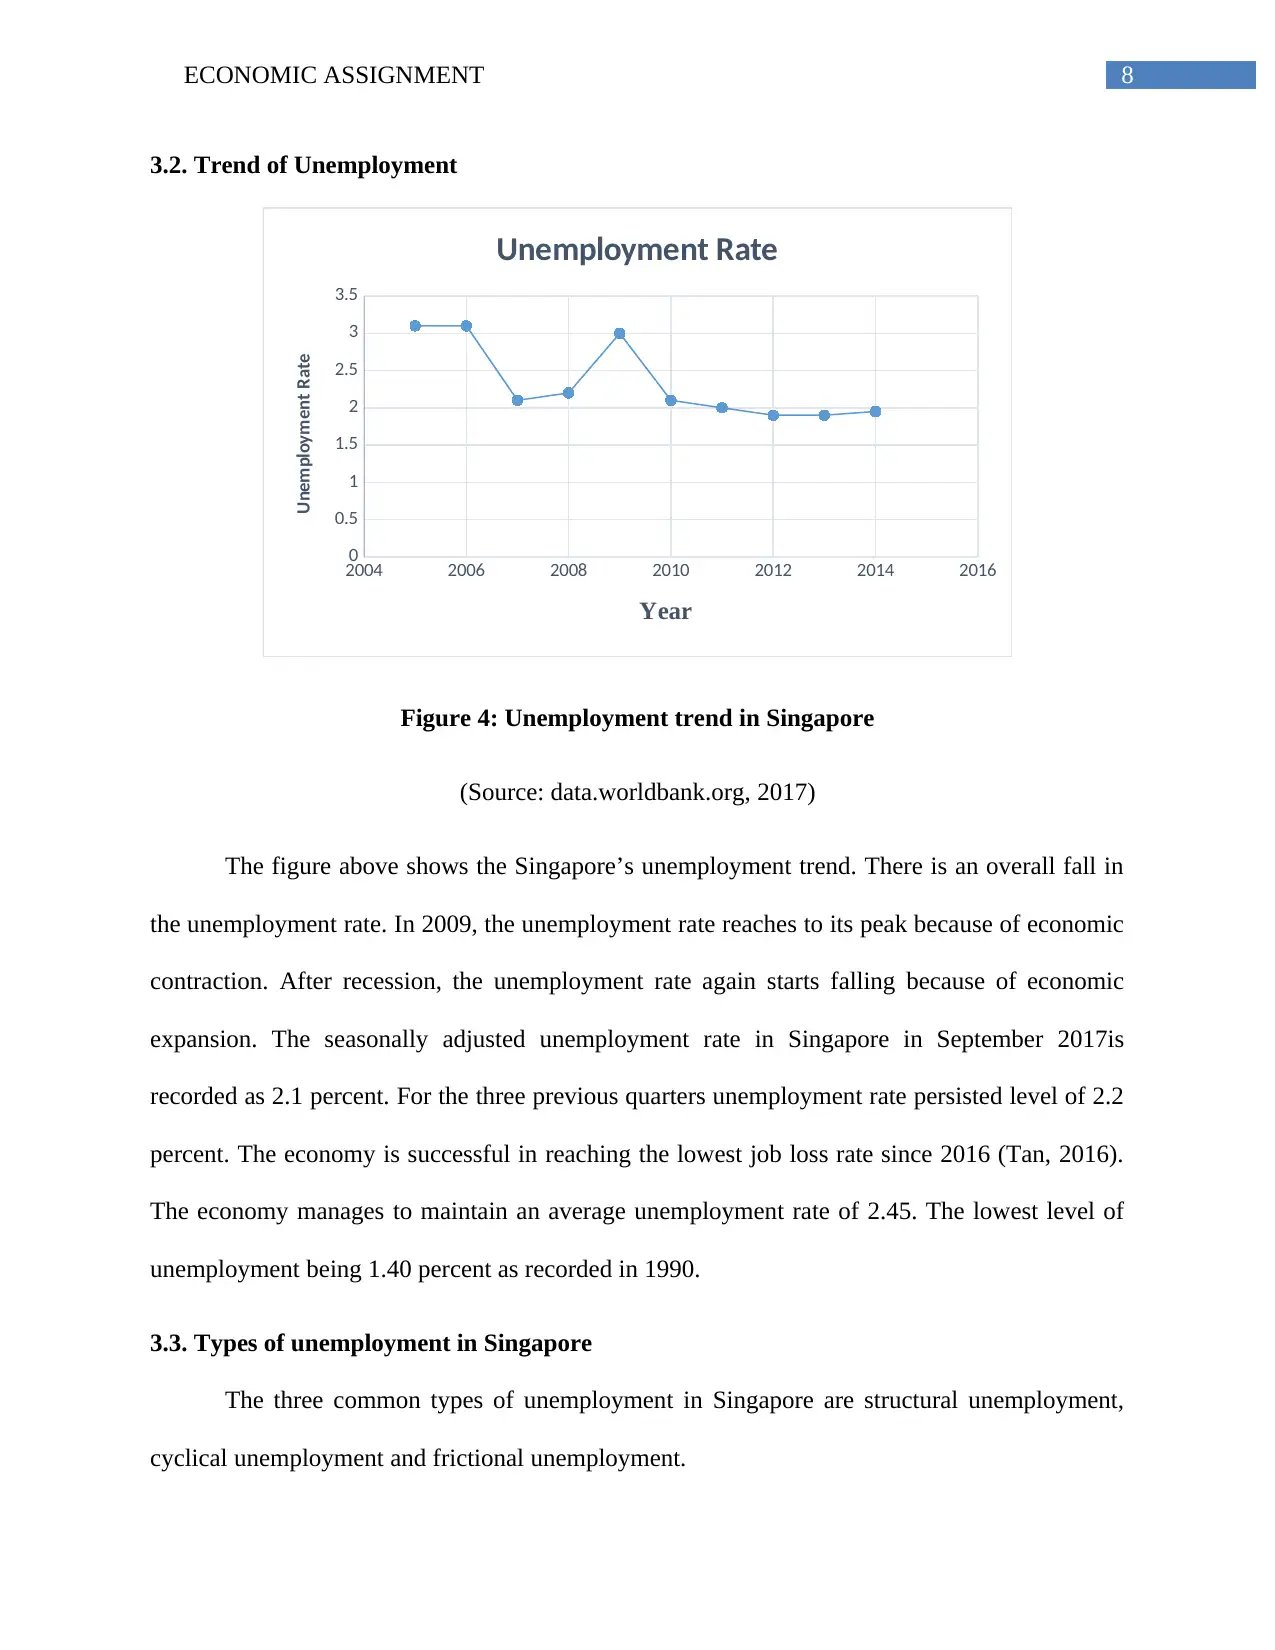
3.2. Trend of Unemployment
2004 2006 2008 2010 2012 2014 2016
0
0.5
1
1.5
2
2.5
3
3.5
Unemployment Rate
Year
Unemployment Rate
Figure 4: Unemployment trend in Singapore
(Source: data.worldbank.org, 2017)
The figure above shows the Singapore’s unemployment trend. There is an overall fall in
the unemployment rate. In 2009, the unemployment rate reaches to its peak because of economic
contraction. After recession, the unemployment rate again starts falling because of economic
expansion. The seasonally adjusted unemployment rate in Singapore in September 2017is
recorded as 2.1 percent. For the three previous quarters unemployment rate persisted level of 2.2
percent. The economy is successful in reaching the lowest job loss rate since 2016 (Tan, 2016).
The economy manages to maintain an average unemployment rate of 2.45. The lowest level of
unemployment being 1.40 percent as recorded in 1990.
3.3. Types of unemployment in Singapore
The three common types of unemployment in Singapore are structural unemployment,
cyclical unemployment and frictional unemployment.
⊘ This is a preview!⊘
Do you want full access?
Subscribe today to unlock all pages.
Trusted by 1+ million students worldwide
9ECONOMIC ASSIGNMENT
Singapore has a large external sector. The dependency on the external sector causes
cyclical unemployment in Singapore. Singapore heavily relies on the demand from the external
sector for is growth. Earnings from exports is a significant contributor of Singapore GDP.
Singapore heavily exports manufacturing electronics across the world. Once the demand for
exported goods fall the aggregate demand in the economy decline causing cyclical
unemployment.
In a world of globalization, countries undertake change is structural and sectorial
composition. Singapore has considered such changes causing structural unemployment. One of
the primary changes is the shift of the nation from labor-intensive economy to a capital
intensiveone. Workers fail to match the required skills of capital-oriented technology lose their
jobs in different industries. One such example is focus of the Singaporean economy on industries
like research and development and biomedical (Chow, Lim &McNelis, 2014). The unskilled
labors in the low valued manufacturing industry end up with losing jobs.
In Singapore, structural change causes may people to switch their jobs. Destruction of
existing jobs and creation of new type of jobs causes frictional unemployment.
3.4. Government measure to achieve full employment
Singapore government design different policy plan to counter existing unemployment in
the economy and sustain full employment. A program named career support program has been
launchedto help job seekers in finding employment opportunity. In this program Professionals,
Mangers, Executive and Technicians below the age 40 are included. The job assistances are
provided if they are unemployed for a period of six month and even more. In order to offer them
jobs, subsidies are offered to employers (Schnabl, & Spantig, 2016). The government promises
Paraphrase This Document
Need a fresh take? Get an instant paraphrase of this document with our AI Paraphraser
10ECONOMIC ASSIGNMENT
the employers to provide 20 percent of the salary for six month. After six months, a subsidy of
10 percent is given.
The careers support program is extended to logistics, pharmaceutical and different retail
sectors. A program called Community Development Council is adapted to reduces he stretch of
frictional unemployment (Ali et al., 2014). There are workforce development agency offering
information about jobs and maintain network with different companies to timely offer jobs
4. Price level analysis
4.1. Definition of inflation and its typical cause
The inflation measures are usedto capture trends in the genera price level of the economy.
When there is a gradual rise in the general price level then the situation is called inflation. There
are both demand side and supply side factors causing inflation in the economy. Inflation from
demand side factors is called demand-pull inflation while that from supply side or cost side
factors is called cost-push inflation.
Demand-pull inflation
An increase in aggregate demand causes an increase in the price level. This is the
situation when demand exceeds its supply. Suppliers are unable to match demand and hence the
supply shortage puts an upward pressure on price.
11ECONOMIC ASSIGNMENT
Figure 5: Demand-pull inflation in the economy
(Source: Sloman, Norris & Garrett, 2013).
Cost-push inflation
When cost of production raises, then suppliers increase price of the goods to recover
costs. The increasing cost may be attributed from rising price of inputs such as wages of labor,
capital cost and others.
Figure 6: Cost Push inflation in the economy
(Source: Sloman, Norris & Garrett, 2013).
⊘ This is a preview!⊘
Do you want full access?
Subscribe today to unlock all pages.
Trusted by 1+ million students worldwide
1 out of 17
Related Documents


Your All-in-One AI-Powered Toolkit for Academic Success.
+13062052269
info@desklib.com
Available 24*7 on WhatsApp / Email
![[object Object]](/_next/static/media/star-bottom.7253800d.svg)
Unlock your academic potential
Copyright © 2020–2025 A2Z Services. All Rights Reserved. Developed and managed by ZUCOL.