Impact of Automation on Production Costs and Labor Compensation
VerifiedAdded on 2023/01/06
|11
|3141
|36
AI Summary
This document discusses the impact of automation on production costs and labor compensation in the manufacturing sector. It explores the market for industrial robots and the adoption of machines in production processes. The effects on bargaining power, real wages, and profits are analyzed. Additionally, government policy measures to mitigate potential issues are discussed.
Contribute Materials
Your contribution can guide someone’s learning journey. Share your
documents today.
ECON1020 PRINCIPLES OF ECONOMICS 1 | S2 2020
Department of Economics
INDIVIDUAL
otal Marks 50 | Weighting 30%
IMPORTANT INFORMATION: MUST READ BEFORE YOU
START
Late submission will incur a penalty of 10% per day of total available marks.
• Submissions will not be accepted beyond 72 hours past the submission deadline.
• Re-submissions are allowed until the deadline.
• After your final submission, make sure you check off the following:
I have double-checked whether the document was properly uploaded.
I have seen my originality report (generated after the deadline).
I have received the Turnitin receipt via email.
DOCUMENT PREPARATION
• You must use this document to prepare your answers. Include your answers in the
text box following each question. Do not change the font size set in the text boxes.
• Keep your answers within the word limit given for each question. Marks will be
deducted for answers that are longer or shorter than the word limit.
• Some questions require diagram illustration. All diagrams must be prepared
electronically and inserted in the text boxes as images. Applications for drawing
economic models include Microsoft Word, Microsoft OneNote, and Google Drawings.
For those of you who are new to drawing such models electronically, there are some
handy YouTube tutorials on how to get started.
UNACCEPTABLE ACADEMIC ACTIVITIES
• Recall “what is okay” and “what is not okay” from the Academic Integrity Module.
Unacceptable academic activities may initiate the student disciplinary procedure and
result in zero marks. They include, but are not limited to, contract cheating, collusion,
plagiarism, and self-plagiarism. Details about academic integrity can found here: MQ
academic honesty policy.
• This is an individual t. Writing answers together is not authorised hence is
categorised as collusion. You may discuss with other students at the preparatory stage.
However, the final version of the should be written in your own words.
• Note that Turnitin will compare your submission against others’ as well as internet
sources. The originality report will be made available upon the deadline.
MARKING
• A detailed rubric is provided in the last page.
• Given the size of the cohort, the entire marking process can take up to three to four
weeks. There will be an announcement on iLearn when the marks are released.
1 / 12
Secure Best Marks with AI Grader
Need help grading? Try our AI Grader for instant feedback on your assignments.
ECON1020 PRINCIPLES OF ECONOMICS 1 | S2 2020
Department of Economics
BACKGROUND
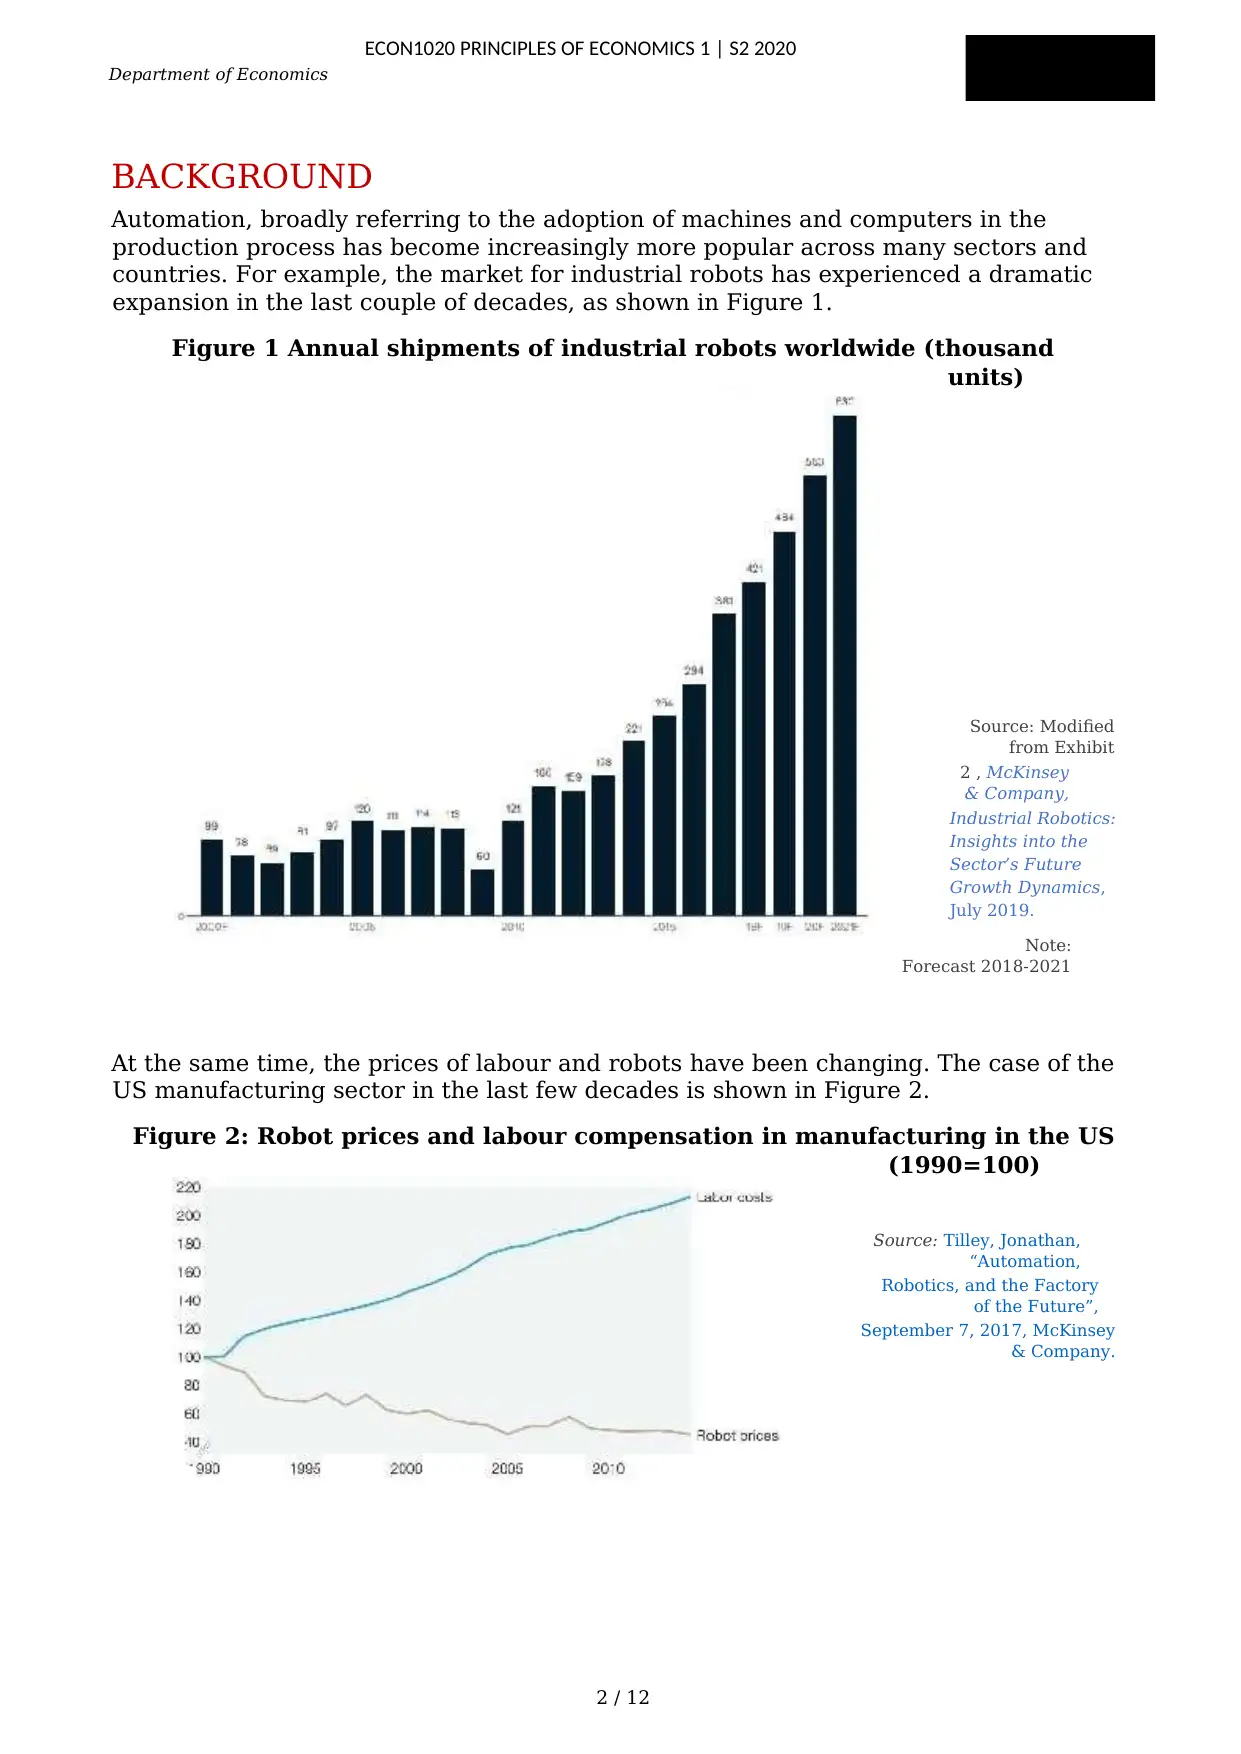
Automation, broadly referring to the adoption of machines and computers in the
production process has become increasingly more popular across many sectors and
countries. For example, the market for industrial robots has experienced a dramatic
expansion in the last couple of decades, as shown in Figure 1.
Figure 1 Annual shipments of industrial robots worldwide (thousand
units)
Source: Modified
from Exhibit
2 , McKinsey
& Company,
Industrial Robotics:
Insights into the
Sector’s Future
Growth Dynamics,
July 2019.
Note:
Forecast 2018-2021
At the same time, the prices of labour and robots have been changing. The case of the
US manufacturing sector in the last few decades is shown in Figure 2.
Figure 2: Robot prices and labour compensation in manufacturing in the US
(1990=100)
Source: Tilley, Jonathan,
“Automation,
Robotics, and the Factory
of the Future”,
September 7, 2017, McKinsey
& Company.
2 / 12
Department of Economics
BACKGROUND
Automation, broadly referring to the adoption of machines and computers in the
production process has become increasingly more popular across many sectors and
countries. For example, the market for industrial robots has experienced a dramatic
expansion in the last couple of decades, as shown in Figure 1.
Figure 1 Annual shipments of industrial robots worldwide (thousand
units)
Source: Modified
from Exhibit
2 , McKinsey
& Company,
Industrial Robotics:
Insights into the
Sector’s Future
Growth Dynamics,
July 2019.
Note:
Forecast 2018-2021
At the same time, the prices of labour and robots have been changing. The case of the
US manufacturing sector in the last few decades is shown in Figure 2.
Figure 2: Robot prices and labour compensation in manufacturing in the US
(1990=100)
Source: Tilley, Jonathan,
“Automation,
Robotics, and the Factory
of the Future”,
September 7, 2017, McKinsey
& Company.
2 / 12
MACQUARIE
BUSINESS SCHOOL ECON1020 PRINCIPLES OF ECONOMICS 1 | S2 2020
Department of Economics
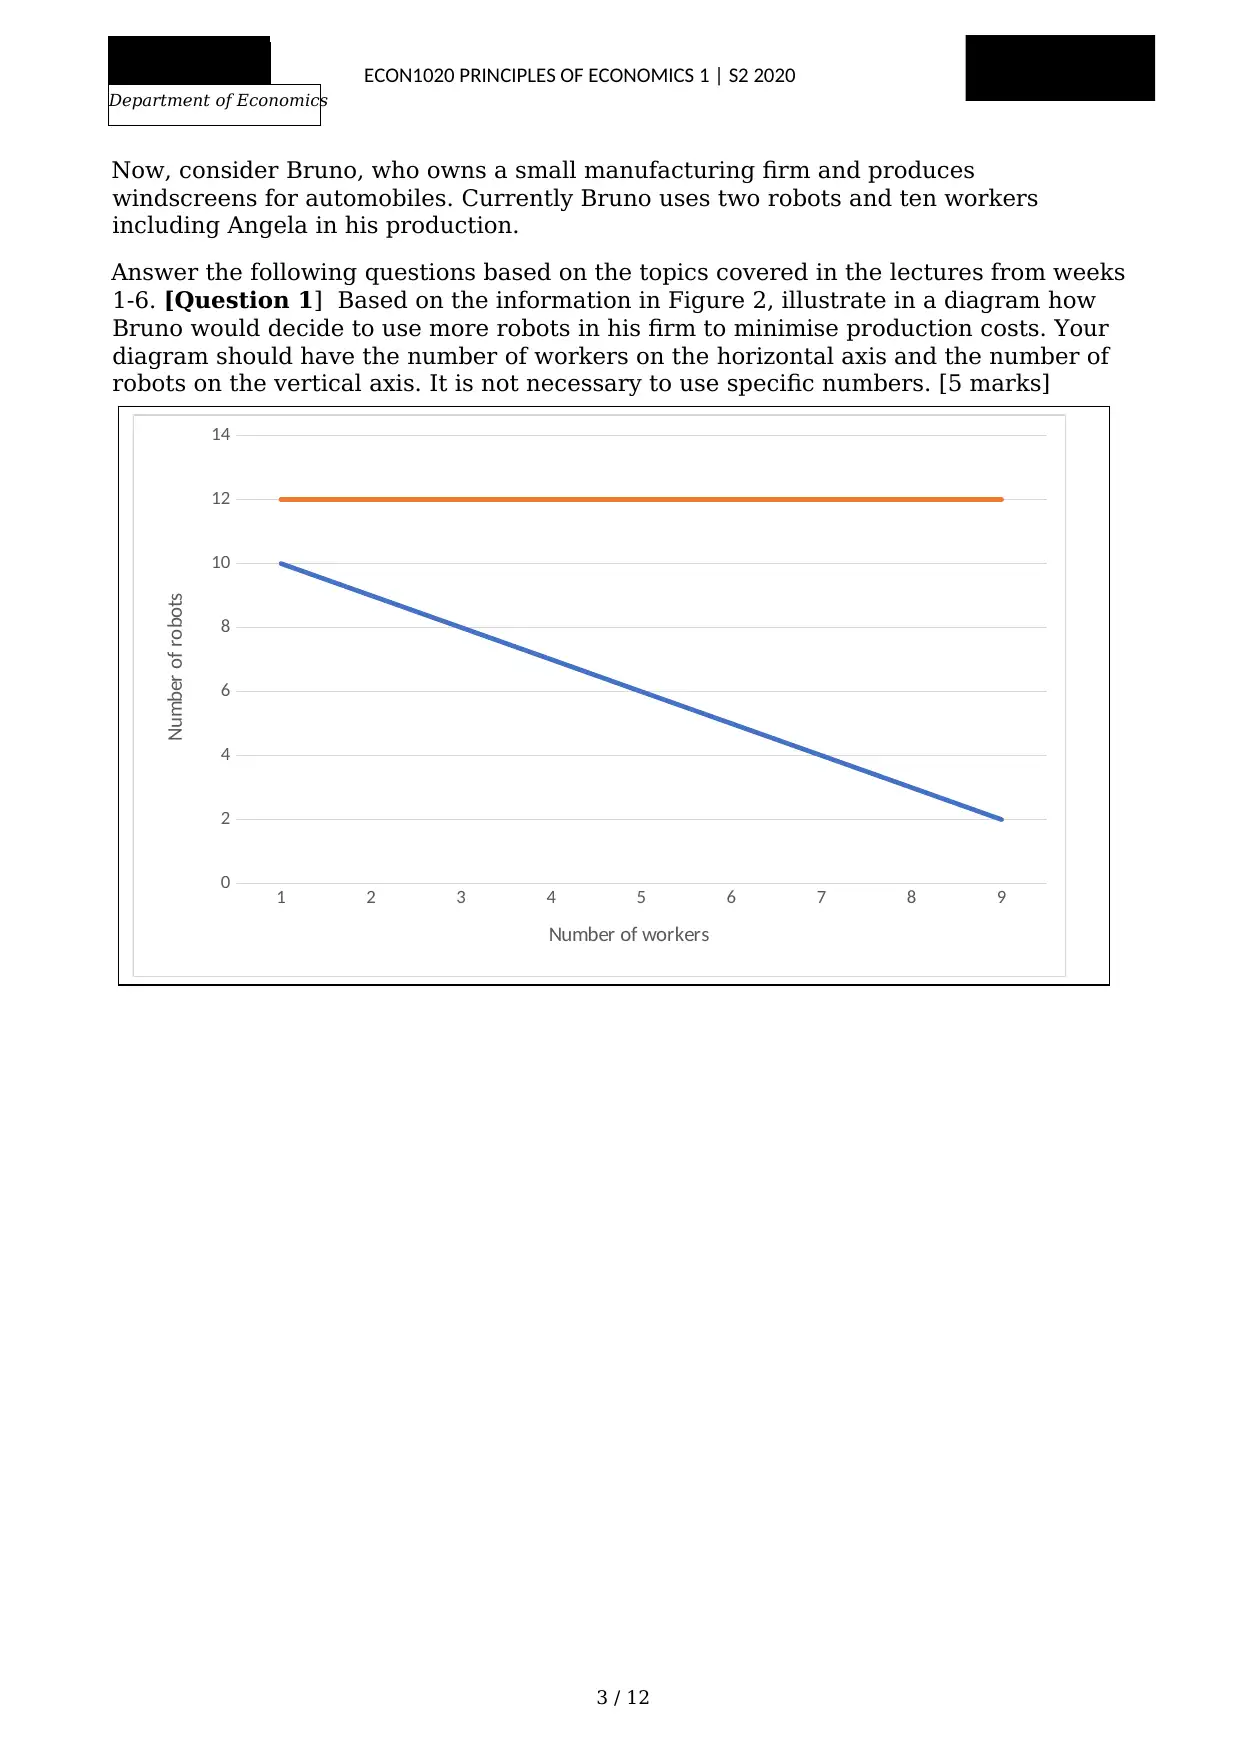
Now, consider Bruno, who owns a small manufacturing firm and produces
windscreens for automobiles. Currently Bruno uses two robots and ten workers
including Angela in his production.
Answer the following questions based on the topics covered in the lectures from weeks
1-6. [Question 1] Based on the information in Figure 2, illustrate in a diagram how
Bruno would decide to use more robots in his firm to minimise production costs. Your
diagram should have the number of workers on the horizontal axis and the number of
robots on the vertical axis. It is not necessary to use specific numbers. [5 marks]
3 / 12
1 2 3 4 5 6 7 8 9
0
2
4
6
8
10
12
14
Number of workers
Number of robots
BUSINESS SCHOOL ECON1020 PRINCIPLES OF ECONOMICS 1 | S2 2020
Department of Economics
Now, consider Bruno, who owns a small manufacturing firm and produces
windscreens for automobiles. Currently Bruno uses two robots and ten workers
including Angela in his production.
Answer the following questions based on the topics covered in the lectures from weeks
1-6. [Question 1] Based on the information in Figure 2, illustrate in a diagram how
Bruno would decide to use more robots in his firm to minimise production costs. Your
diagram should have the number of workers on the horizontal axis and the number of
robots on the vertical axis. It is not necessary to use specific numbers. [5 marks]
3 / 12
1 2 3 4 5 6 7 8 9
0
2
4
6
8
10
12
14
Number of workers
Number of robots
ECON1020 PRINCIPLES OF ECONOMICS 1 | S2 2020
Department of Economics
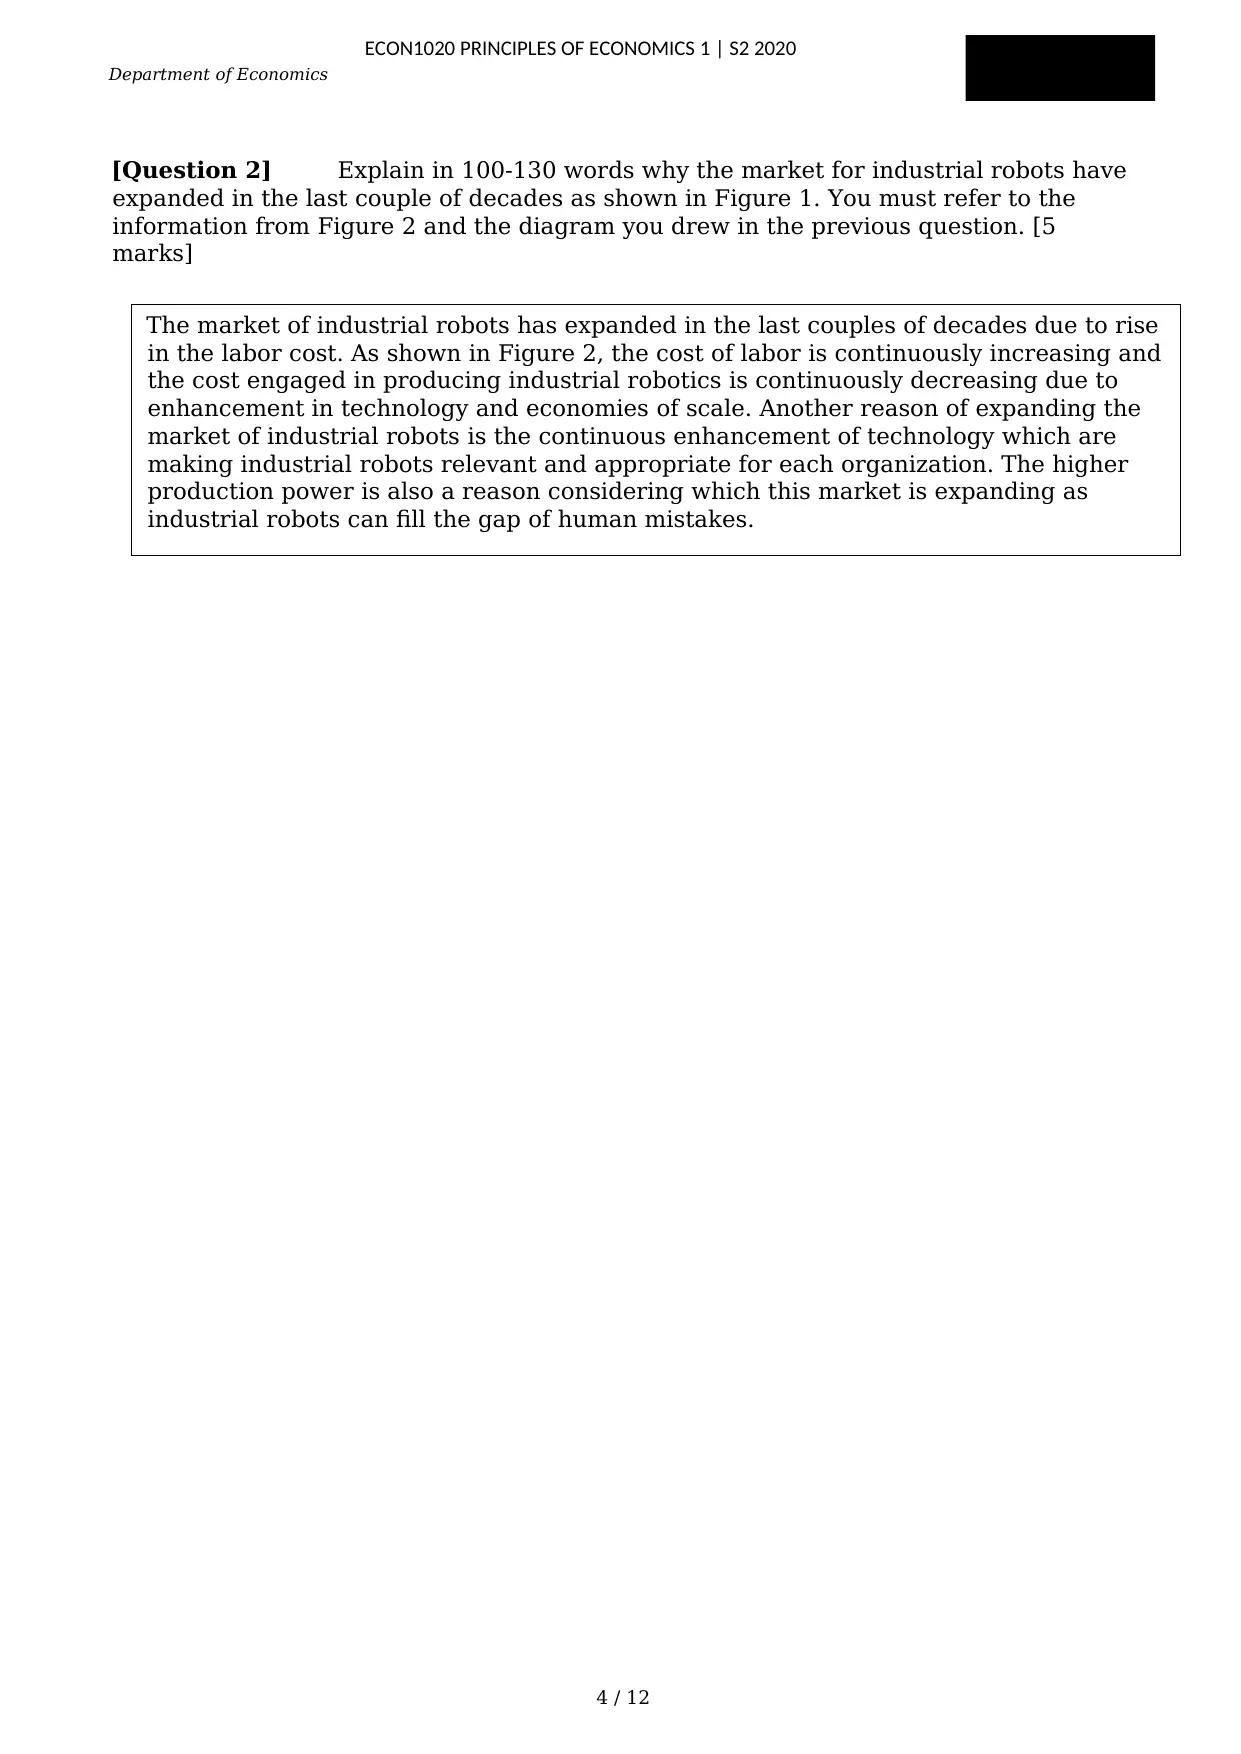
[Question 2] Explain in 100-130 words why the market for industrial robots have
expanded in the last couple of decades as shown in Figure 1. You must refer to the
information from Figure 2 and the diagram you drew in the previous question. [5
marks]
4 / 12
The market of industrial robots has expanded in the last couples of decades due to rise
in the labor cost. As shown in Figure 2, the cost of labor is continuously increasing and
the cost engaged in producing industrial robotics is continuously decreasing due to
enhancement in technology and economies of scale. Another reason of expanding the
market of industrial robots is the continuous enhancement of technology which are
making industrial robots relevant and appropriate for each organization. The higher
production power is also a reason considering which this market is expanding as
industrial robots can fill the gap of human mistakes.
Department of Economics
[Question 2] Explain in 100-130 words why the market for industrial robots have
expanded in the last couple of decades as shown in Figure 1. You must refer to the
information from Figure 2 and the diagram you drew in the previous question. [5
marks]
4 / 12
The market of industrial robots has expanded in the last couples of decades due to rise
in the labor cost. As shown in Figure 2, the cost of labor is continuously increasing and
the cost engaged in producing industrial robotics is continuously decreasing due to
enhancement in technology and economies of scale. Another reason of expanding the
market of industrial robots is the continuous enhancement of technology which are
making industrial robots relevant and appropriate for each organization. The higher
production power is also a reason considering which this market is expanding as
industrial robots can fill the gap of human mistakes.
Secure Best Marks with AI Grader
Need help grading? Try our AI Grader for instant feedback on your assignments.
MACQUARIE
BUSINESS SCHOOL ECON1020 PRINCIPLES OF ECONOMICS 1 | S2 2020
Department of Economics
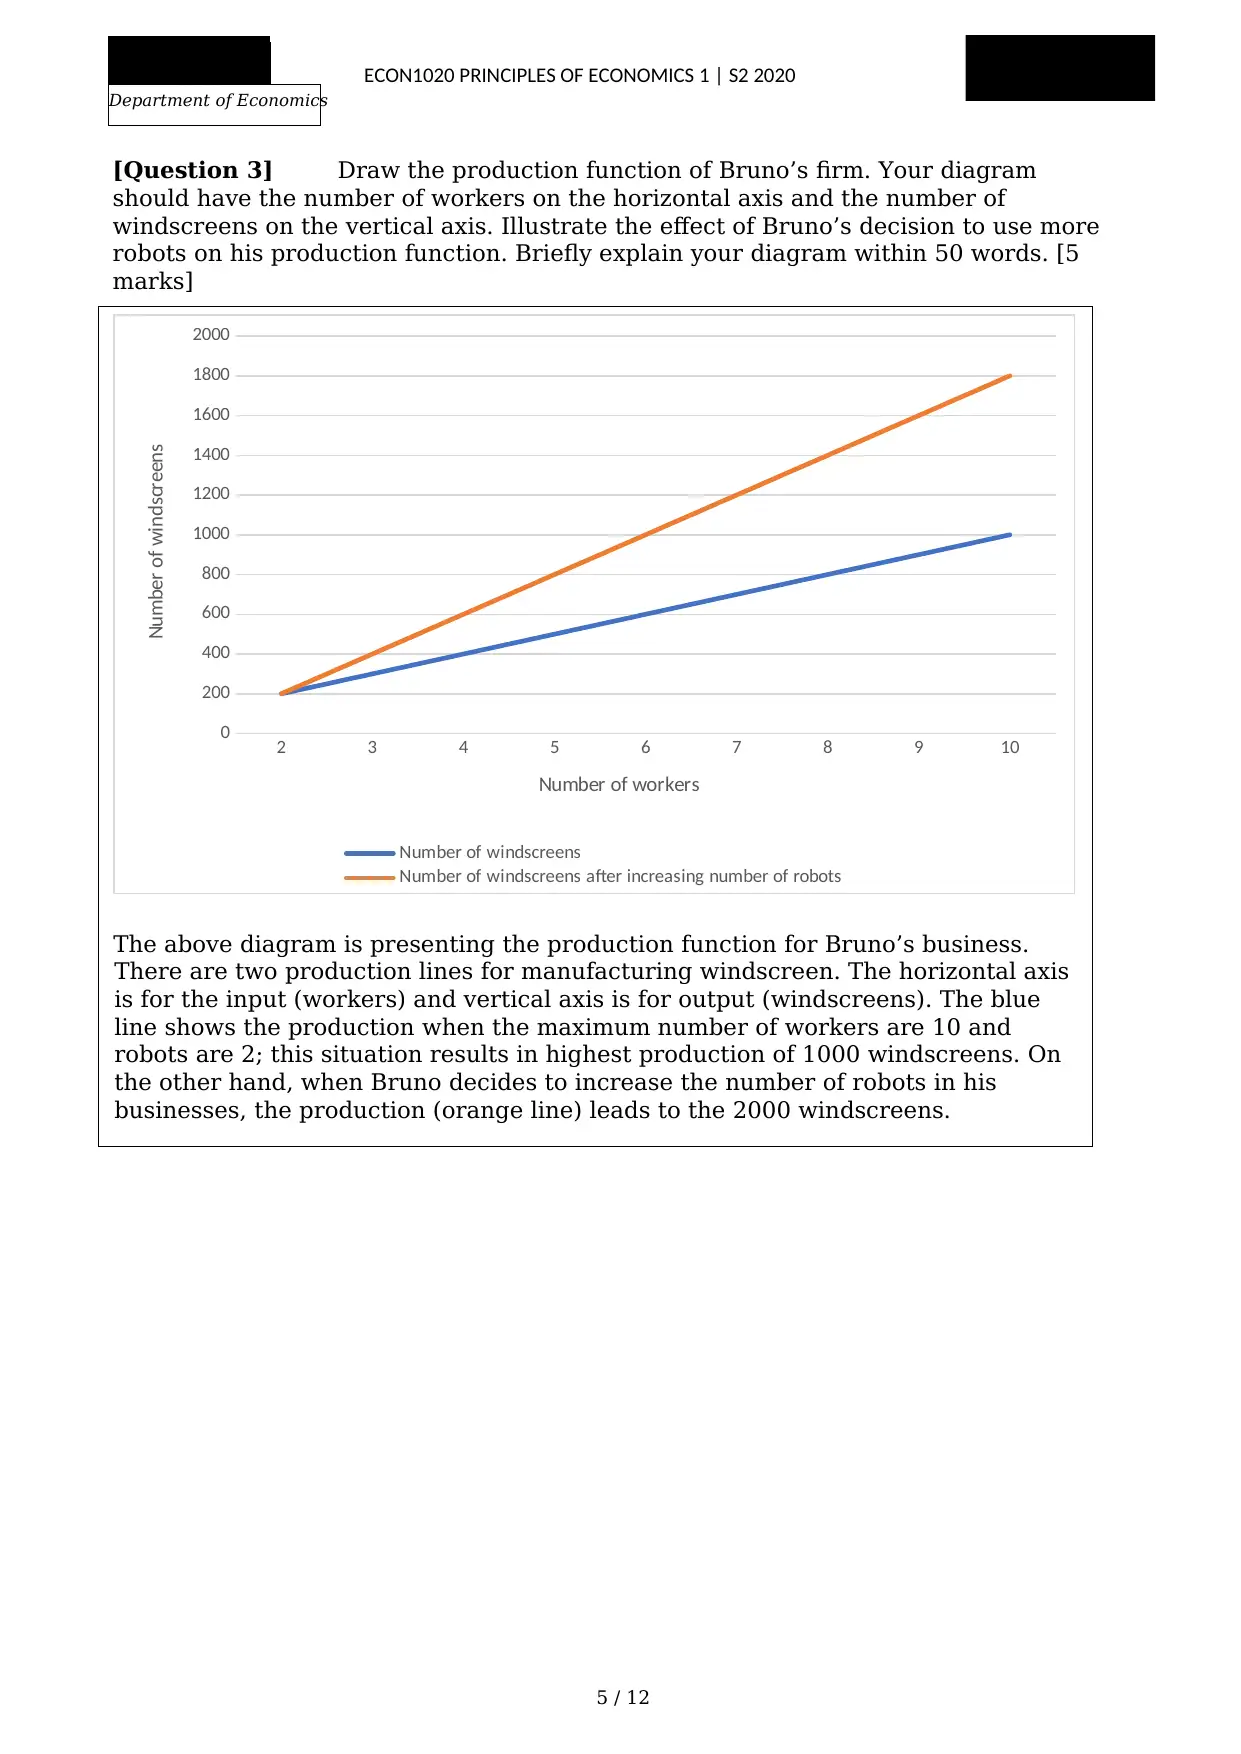
[Question 3] Draw the production function of Bruno’s firm. Your diagram
should have the number of workers on the horizontal axis and the number of
windscreens on the vertical axis. Illustrate the effect of Bruno’s decision to use more
robots on his production function. Briefly explain your diagram within 50 words. [5
marks]
5 / 12
2 3 4 5 6 7 8 9 10
0
200
400
600
800
1000
1200
1400
1600
1800
2000
Number of windscreens
Number of windscreens after increasing number of robots
Number of workers
Number of windscreens
The above diagram is presenting the production function for Bruno’s business.
There are two production lines for manufacturing windscreen. The horizontal axis
is for the input (workers) and vertical axis is for output (windscreens). The blue
line shows the production when the maximum number of workers are 10 and
robots are 2; this situation results in highest production of 1000 windscreens. On
the other hand, when Bruno decides to increase the number of robots in his
businesses, the production (orange line) leads to the 2000 windscreens.
BUSINESS SCHOOL ECON1020 PRINCIPLES OF ECONOMICS 1 | S2 2020
Department of Economics
[Question 3] Draw the production function of Bruno’s firm. Your diagram
should have the number of workers on the horizontal axis and the number of
windscreens on the vertical axis. Illustrate the effect of Bruno’s decision to use more
robots on his production function. Briefly explain your diagram within 50 words. [5
marks]
5 / 12
2 3 4 5 6 7 8 9 10
0
200
400
600
800
1000
1200
1400
1600
1800
2000
Number of windscreens
Number of windscreens after increasing number of robots
Number of workers
Number of windscreens
The above diagram is presenting the production function for Bruno’s business.
There are two production lines for manufacturing windscreen. The horizontal axis
is for the input (workers) and vertical axis is for output (windscreens). The blue
line shows the production when the maximum number of workers are 10 and
robots are 2; this situation results in highest production of 1000 windscreens. On
the other hand, when Bruno decides to increase the number of robots in his
businesses, the production (orange line) leads to the 2000 windscreens.
MACQUARIE
BUSINESS SCHOOL ECON1020 PRINCIPLES OF ECONOMICS 1 | S2 2020
Department of Economics
[Question 4] Discuss in 100-150 words how Bruno’s decision to increase the
use of robots and the general trend of increasing automation could affect in the
future the following:
• Angela’s bargaining power,
• Angela’s real wage, and
• Bruno’s profit.
You must refer to Figure 3 in your discussion. The description of Figure 3 can be
found in Unit 4
Section 12 of the prescribed textbook. [10 marks]
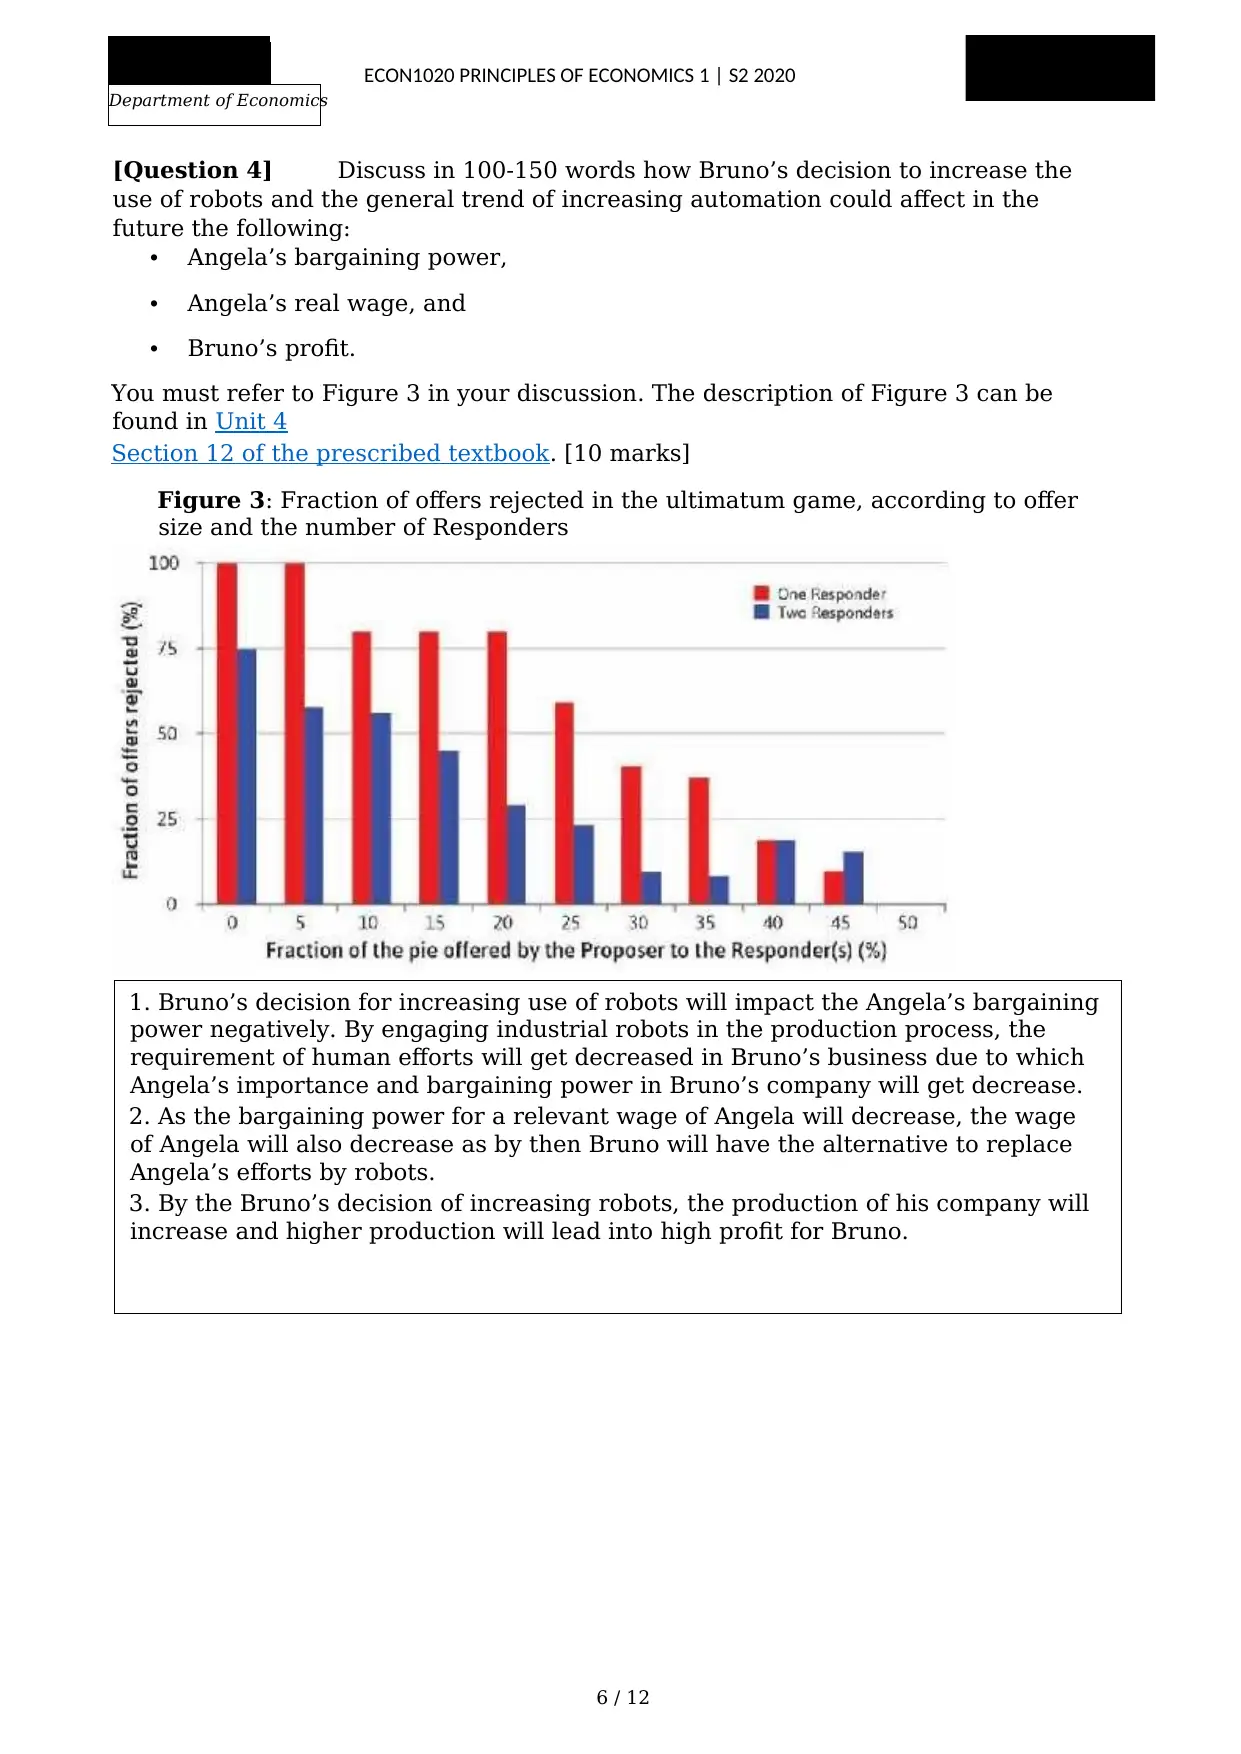
Figure 3: Fraction of offers rejected in the ultimatum game, according to offer
size and the number of Responders
6 / 12
1. Bruno’s decision for increasing use of robots will impact the Angela’s bargaining
power negatively. By engaging industrial robots in the production process, the
requirement of human efforts will get decreased in Bruno’s business due to which
Angela’s importance and bargaining power in Bruno’s company will get decrease.
2. As the bargaining power for a relevant wage of Angela will decrease, the wage
of Angela will also decrease as by then Bruno will have the alternative to replace
Angela’s efforts by robots.
3. By the Bruno’s decision of increasing robots, the production of his company will
increase and higher production will lead into high profit for Bruno.
BUSINESS SCHOOL ECON1020 PRINCIPLES OF ECONOMICS 1 | S2 2020
Department of Economics
[Question 4] Discuss in 100-150 words how Bruno’s decision to increase the
use of robots and the general trend of increasing automation could affect in the
future the following:
• Angela’s bargaining power,
• Angela’s real wage, and
• Bruno’s profit.
You must refer to Figure 3 in your discussion. The description of Figure 3 can be
found in Unit 4
Section 12 of the prescribed textbook. [10 marks]
Figure 3: Fraction of offers rejected in the ultimatum game, according to offer
size and the number of Responders
6 / 12
1. Bruno’s decision for increasing use of robots will impact the Angela’s bargaining
power negatively. By engaging industrial robots in the production process, the
requirement of human efforts will get decreased in Bruno’s business due to which
Angela’s importance and bargaining power in Bruno’s company will get decrease.
2. As the bargaining power for a relevant wage of Angela will decrease, the wage
of Angela will also decrease as by then Bruno will have the alternative to replace
Angela’s efforts by robots.
3. By the Bruno’s decision of increasing robots, the production of his company will
increase and higher production will lead into high profit for Bruno.
MACQUARIE
BUSINESS SCHOOL ECON1020 PRINCIPLES OF ECONOMICS 1 | S2 2020
Department of Economics
[Question5] Does Bruno’s decision to use more robots bring about a Pareto
improvement?
Discuss in 50-100 words based on your answer for Question 4. [5 marks]
[Question 6] Does Bruno’s decision to use more robots result in a fairer
outcome? Discuss in 150-200 words based on your answer for Question 4. Your
discussion must use any TWO of the following ideas. [10 marks]
• substantive judgement of fairness
• procedural judgement of fairness
• consequentialist approach
• deontological approach
See the week 6 lecture Section D and the supplementary videos to assist your
discussion.
7 / 12
The decision of Bruno to use more robots will not harm anything in Bruno’s
business but it will surely improve and increase the production, so yes, it can
be said that Bruno’s decision bring about a Pareto improvement. The result of
the decision of Bruno fulfils all the Pareto improvement requirements which are
re allocation of goods and benefit to at least one person who in this case is
Bruno.
Substantive judgement of fairness:
The substantive judgement of fairness is the fair and valid reason for an employer to
terminate the employee. Using this idea, it can be said that Bruno’s decision to use
more robots will result into a fairer outcome as more robots will result into more
production, higher revenue, higher profits and high chances of growth and survival.
Consequentialist approach:
Another idea which is selected to be considered is the consequentialist approach as
it is related to the ethics of a business organization. According to this idea, every
move in business is fair when it has undertaken by considering moral right and
wrong approach. The Bruno’s decision to use robots will not result in a fairer
outcome as the use of more robots will result in less utility of human employees by
which many employees will lose their employment and will struggle through
unemployment. So, from this idea, it can be said that Bruno’s decision will not result
into fairer outcome for its employees.
Paraphrase This Document
Need a fresh take? Get an instant paraphrase of this document with our AI Paraphraser
MACQUARIE
BUSINESS SCHOOL ECON1020 PRINCIPLES OF ECONOMICS 1 | S2 2020
Department of Economics
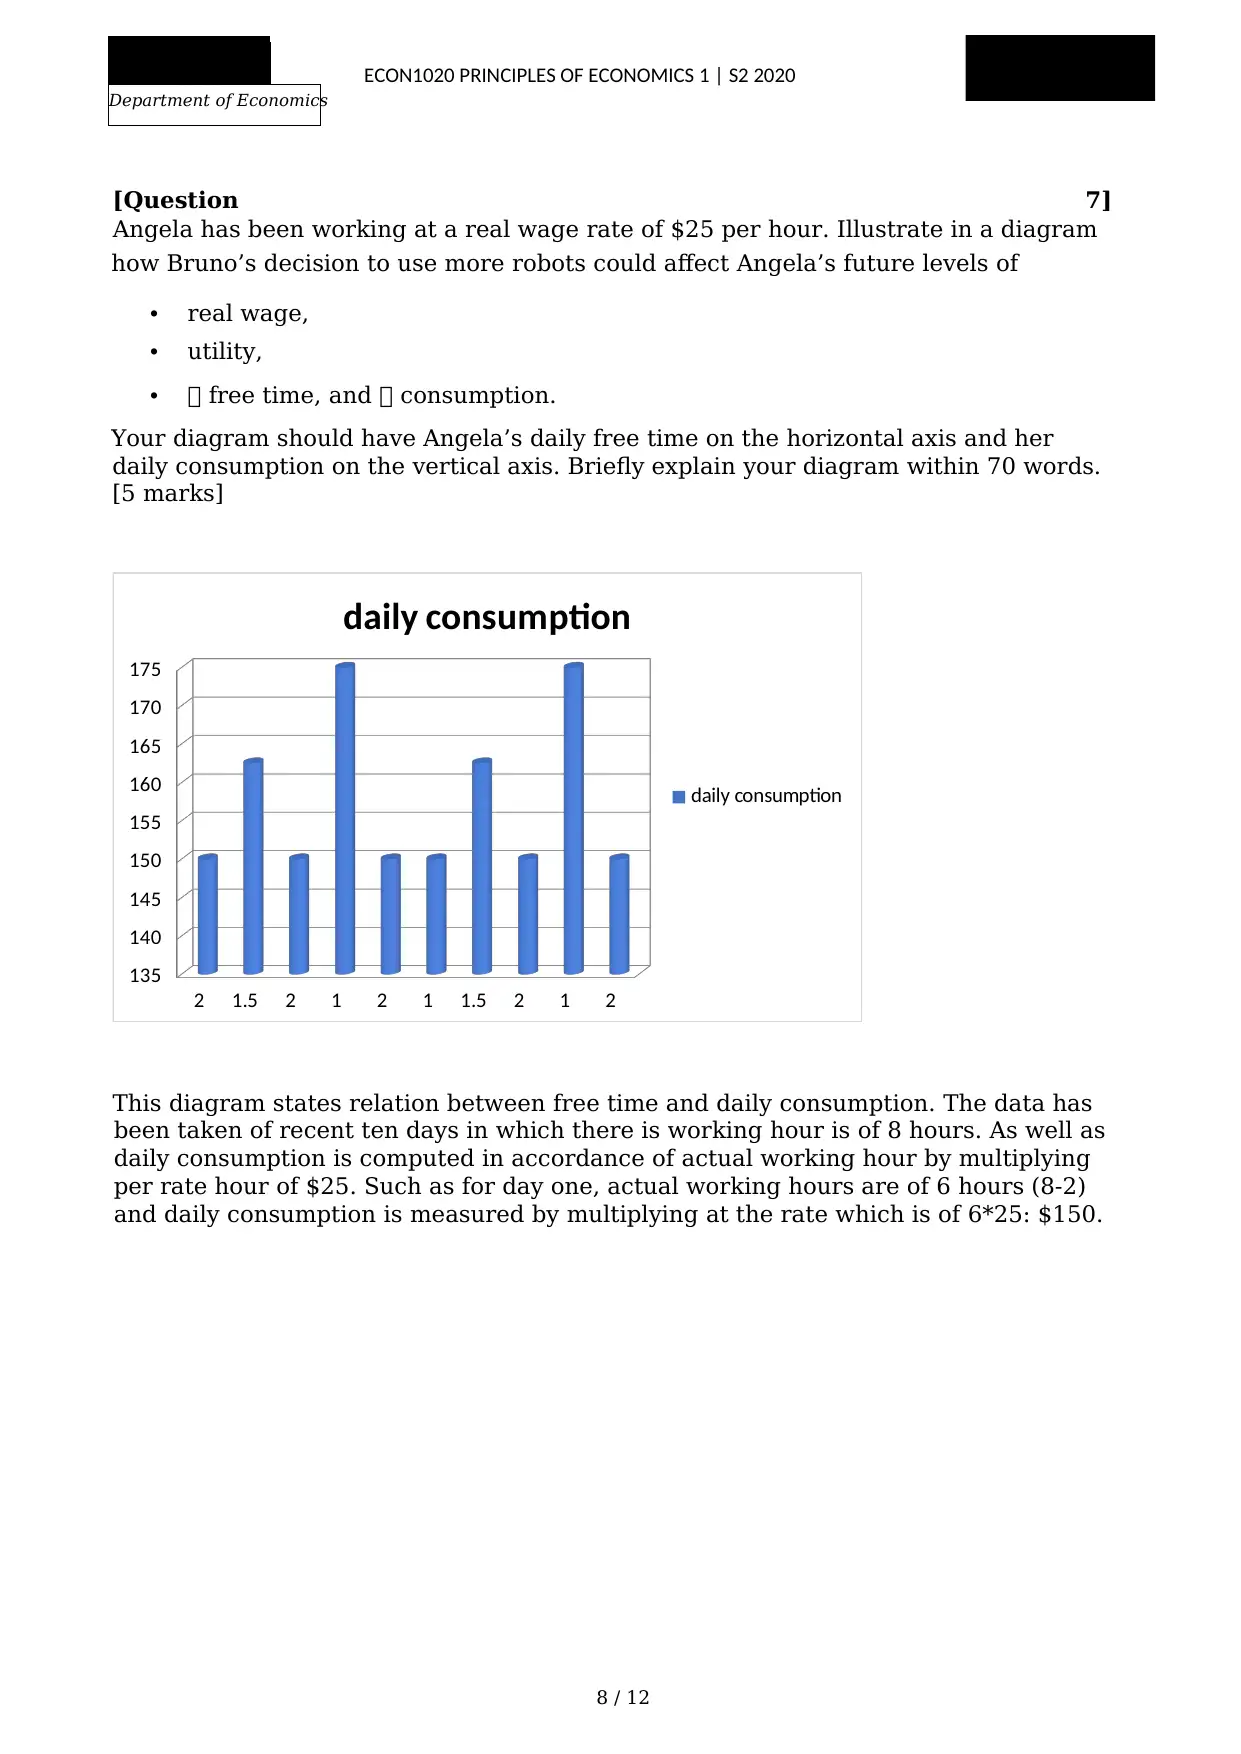
[Question 7]
Angela has been working at a real wage rate of $25 per hour. Illustrate in a diagram
how Bruno’s decision to use more robots could affect Angela’s future levels of
• real wage,
• utility,
• free time, and consumption.
Your diagram should have Angela’s daily free time on the horizontal axis and her
daily consumption on the vertical axis. Briefly explain your diagram within 70 words.
[5 marks]
2 1.5 2 1 2 1 1.5 2 1 2
135
140
145
150
155
160
165
170
175
daily consumption
daily consumption
This diagram states relation between free time and daily consumption. The data has
been taken of recent ten days in which there is working hour is of 8 hours. As well as
daily consumption is computed in accordance of actual working hour by multiplying
per rate hour of $25. Such as for day one, actual working hours are of 6 hours (8-2)
and daily consumption is measured by multiplying at the rate which is of 6*25: $150.
8 / 12
BUSINESS SCHOOL ECON1020 PRINCIPLES OF ECONOMICS 1 | S2 2020
Department of Economics
[Question 7]
Angela has been working at a real wage rate of $25 per hour. Illustrate in a diagram
how Bruno’s decision to use more robots could affect Angela’s future levels of
• real wage,
• utility,
• free time, and consumption.
Your diagram should have Angela’s daily free time on the horizontal axis and her
daily consumption on the vertical axis. Briefly explain your diagram within 70 words.
[5 marks]
2 1.5 2 1 2 1 1.5 2 1 2
135
140
145
150
155
160
165
170
175
daily consumption
daily consumption
This diagram states relation between free time and daily consumption. The data has
been taken of recent ten days in which there is working hour is of 8 hours. As well as
daily consumption is computed in accordance of actual working hour by multiplying
per rate hour of $25. Such as for day one, actual working hours are of 6 hours (8-2)
and daily consumption is measured by multiplying at the rate which is of 6*25: $150.
8 / 12
MACQUARIE
BUSINESS SCHOOL ECON1020 PRINCIPLES OF ECONOMICS 1 | S2 2020
Department of Economics
[Question 8] Choose one government policy measure that you think can mitigate
the potential issue(s) of increasing automation you analysed in the previous questions.
Discuss in 100-150 words the reason(s) behind your choice. You must cite at least one
reputable source from your own research. Include the full reference at the end of your
discussion, which will not count towards the word limit. Use a standard referencing
system (e.g. Harvard style). [5 marks]
In recent years, there has been a tremendous growth of automobile technology that
has made government policy in the catch-up phase of new innovations and progress of
ICT communication and information software innovations. Trade Adjustment
Assistance (TAA) is a United States government federal initiative to serve as a means
to mitigate the adverse influence of imports faced by some segments of the U.S.
economy. Four elements of Trade Transition Assistance are present in the new
structure: for staff, businesses, growers, and societies. A separate sector of the trade
balance Improvement Assistance programme was assigned to each parliament-level
agency. The scheme for staff is the biggest and is operated by the U.S. Labour
Service. The scheme for farmers is run by the U.S. The Division of Agriculture and
programmes for enterprises and neighbourhoods was managed by the U.S. Export
Section.
BEFORE YOU SUBMIT: DOCUMENT PREPARATION
CHECKLIST
☐ My is written in full sentences and clear formal
language.
☐ My is proofread, and errors and typos are
minimised.
☐ My is written within the word limit for each
question.
9 / 12

MACQUARIE
BUSINESS SCHOOL ECON1020 PRINCIPLES OF ECONOMICS 1 | S2 2020
Department of Economics
☐ Diagrams are drawn clearly and fully labelled. Poorly drawn diagrams reflect poor
communication which may result in loss of marks.
☐ Diagrams are not distorted and properly inserted into the text boxes.
☐ I have read the rubric in the next page and made sure that my is up to the criteria.
10 / 12
Secure Best Marks with AI Grader
Need help grading? Try our AI Grader for instant feedback on your assignments.
MACQUARIE
BUSINESS SCHOOL
Department of Economics
ECON1020 PRINCIPLES OF ECONOMICS 1 | S2 2020
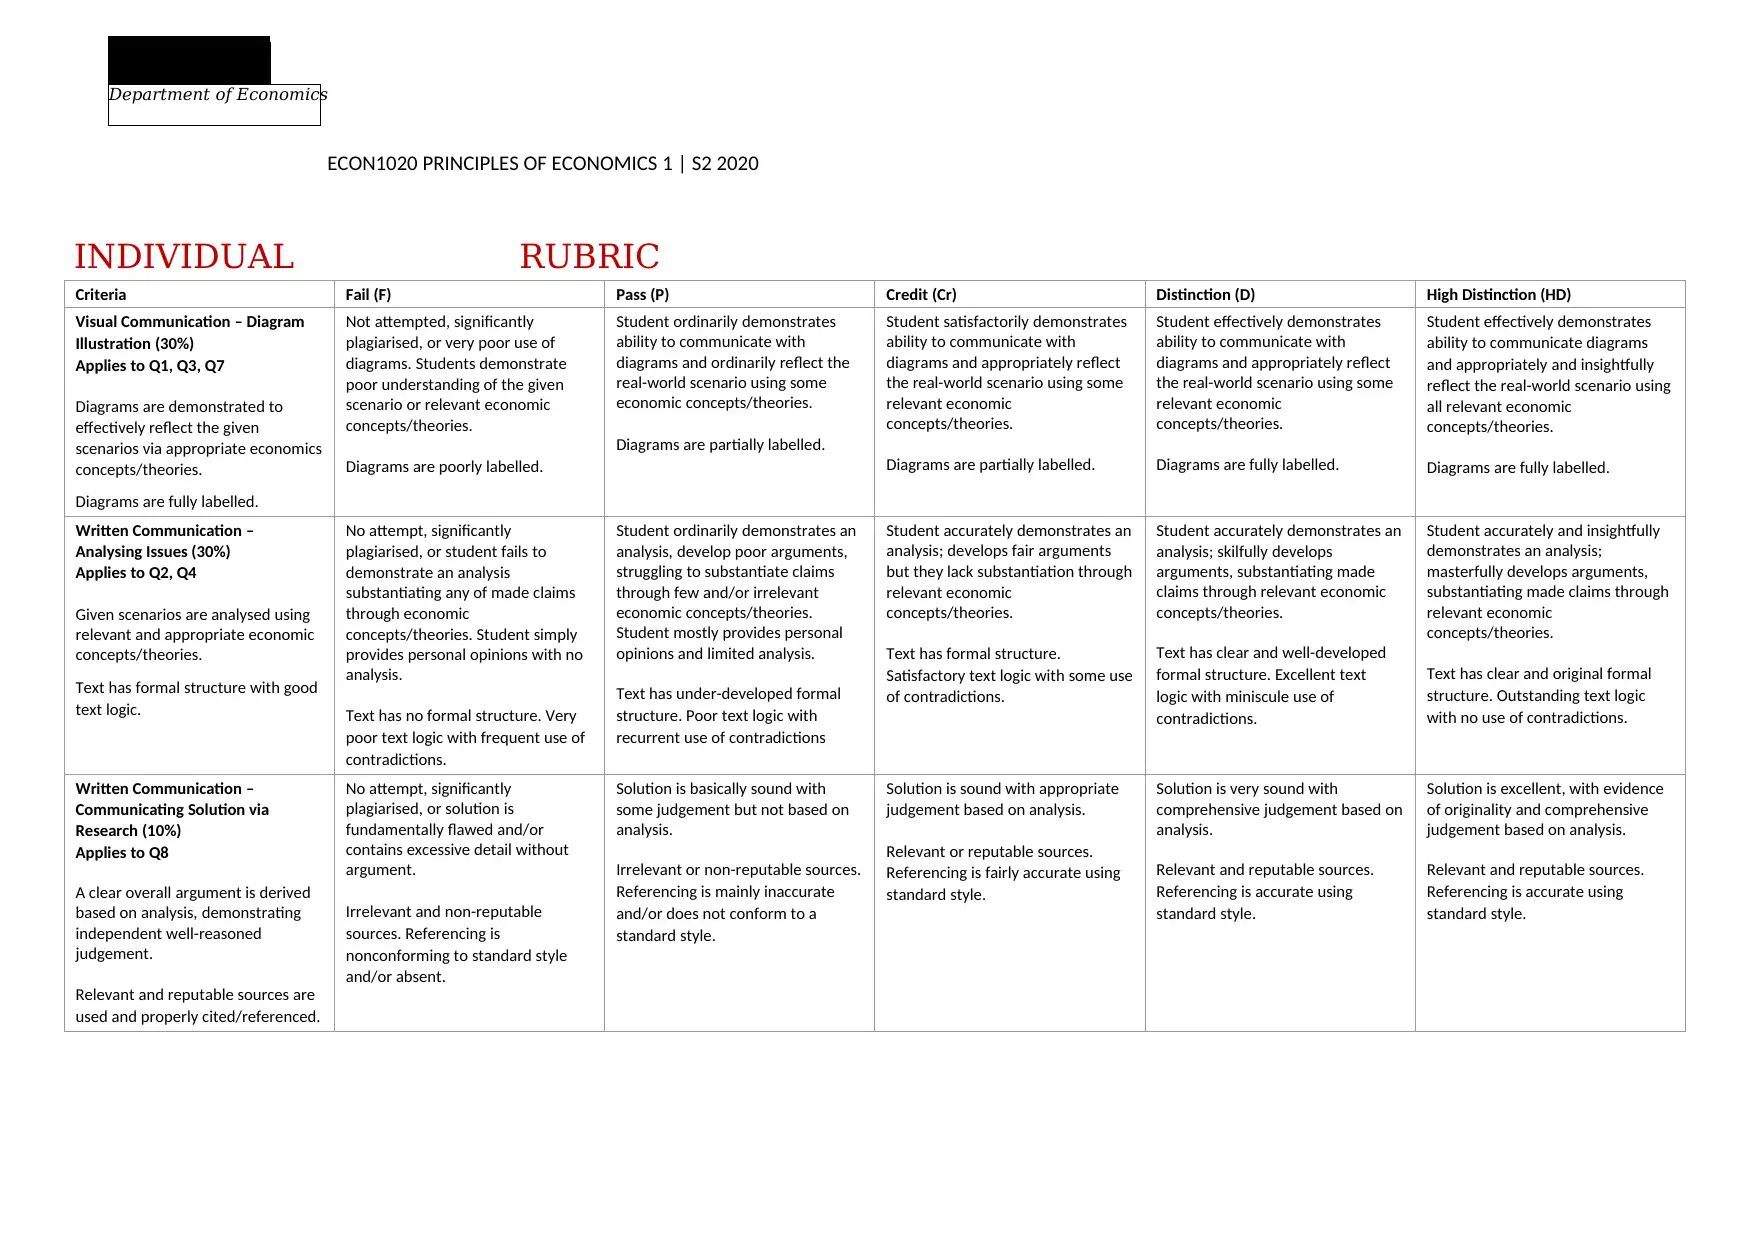
INDIVIDUAL RUBRIC
Criteria Fail (F) Pass (P) Credit (Cr) Distinction (D) High Distinction (HD)
Visual Communication – Diagram
Illustration (30%)
Applies to Q1, Q3, Q7
Diagrams are demonstrated to
effectively reflect the given
scenarios via appropriate economics
concepts/theories.
Diagrams are fully labelled.
Not attempted, significantly
plagiarised, or very poor use of
diagrams. Students demonstrate
poor understanding of the given
scenario or relevant economic
concepts/theories.
Diagrams are poorly labelled.
Student ordinarily demonstrates
ability to communicate with
diagrams and ordinarily reflect the
real-world scenario using some
economic concepts/theories.
Diagrams are partially labelled.
Student satisfactorily demonstrates
ability to communicate with
diagrams and appropriately reflect
the real-world scenario using some
relevant economic
concepts/theories.
Diagrams are partially labelled.
Student effectively demonstrates
ability to communicate with
diagrams and appropriately reflect
the real-world scenario using some
relevant economic
concepts/theories.
Diagrams are fully labelled.
Student effectively demonstrates
ability to communicate diagrams
and appropriately and insightfully
reflect the real-world scenario using
all relevant economic
concepts/theories.
Diagrams are fully labelled.
Written Communication –
Analysing Issues (30%)
Applies to Q2, Q4
Given scenarios are analysed using
relevant and appropriate economic
concepts/theories.
Text has formal structure with good
text logic.
No attempt, significantly
plagiarised, or student fails to
demonstrate an analysis
substantiating any of made claims
through economic
concepts/theories. Student simply
provides personal opinions with no
analysis.
Text has no formal structure. Very
poor text logic with frequent use of
contradictions.
Student ordinarily demonstrates an
analysis, develop poor arguments,
struggling to substantiate claims
through few and/or irrelevant
economic concepts/theories.
Student mostly provides personal
opinions and limited analysis.
Text has under-developed formal
structure. Poor text logic with
recurrent use of contradictions
Student accurately demonstrates an
analysis; develops fair arguments
but they lack substantiation through
relevant economic
concepts/theories.
Text has formal structure.
Satisfactory text logic with some use
of contradictions.
Student accurately demonstrates an
analysis; skilfully develops
arguments, substantiating made
claims through relevant economic
concepts/theories.
Text has clear and well-developed
formal structure. Excellent text
logic with miniscule use of
contradictions.
Student accurately and insightfully
demonstrates an analysis;
masterfully develops arguments,
substantiating made claims through
relevant economic
concepts/theories.
Text has clear and original formal
structure. Outstanding text logic
with no use of contradictions.
Written Communication –
Communicating Solution via
Research (10%)
Applies to Q8
A clear overall argument is derived
based on analysis, demonstrating
independent well-reasoned
judgement.
Relevant and reputable sources are
used and properly cited/referenced.
No attempt, significantly
plagiarised, or solution is
fundamentally flawed and/or
contains excessive detail without
argument.
Irrelevant and non-reputable
sources. Referencing is
nonconforming to standard style
and/or absent.
Solution is basically sound with
some judgement but not based on
analysis.
Irrelevant or non-reputable sources.
Referencing is mainly inaccurate
and/or does not conform to a
standard style.
Solution is sound with appropriate
judgement based on analysis.
Relevant or reputable sources.
Referencing is fairly accurate using
standard style.
Solution is very sound with
comprehensive judgement based on
analysis.
Relevant and reputable sources.
Referencing is accurate using
standard style.
Solution is excellent, with evidence
of originality and comprehensive
judgement based on analysis.
Relevant and reputable sources.
Referencing is accurate using
standard style.
BUSINESS SCHOOL
Department of Economics
ECON1020 PRINCIPLES OF ECONOMICS 1 | S2 2020
INDIVIDUAL RUBRIC
Criteria Fail (F) Pass (P) Credit (Cr) Distinction (D) High Distinction (HD)
Visual Communication – Diagram
Illustration (30%)
Applies to Q1, Q3, Q7
Diagrams are demonstrated to
effectively reflect the given
scenarios via appropriate economics
concepts/theories.
Diagrams are fully labelled.
Not attempted, significantly
plagiarised, or very poor use of
diagrams. Students demonstrate
poor understanding of the given
scenario or relevant economic
concepts/theories.
Diagrams are poorly labelled.
Student ordinarily demonstrates
ability to communicate with
diagrams and ordinarily reflect the
real-world scenario using some
economic concepts/theories.
Diagrams are partially labelled.
Student satisfactorily demonstrates
ability to communicate with
diagrams and appropriately reflect
the real-world scenario using some
relevant economic
concepts/theories.
Diagrams are partially labelled.
Student effectively demonstrates
ability to communicate with
diagrams and appropriately reflect
the real-world scenario using some
relevant economic
concepts/theories.
Diagrams are fully labelled.
Student effectively demonstrates
ability to communicate diagrams
and appropriately and insightfully
reflect the real-world scenario using
all relevant economic
concepts/theories.
Diagrams are fully labelled.
Written Communication –
Analysing Issues (30%)
Applies to Q2, Q4
Given scenarios are analysed using
relevant and appropriate economic
concepts/theories.
Text has formal structure with good
text logic.
No attempt, significantly
plagiarised, or student fails to
demonstrate an analysis
substantiating any of made claims
through economic
concepts/theories. Student simply
provides personal opinions with no
analysis.
Text has no formal structure. Very
poor text logic with frequent use of
contradictions.
Student ordinarily demonstrates an
analysis, develop poor arguments,
struggling to substantiate claims
through few and/or irrelevant
economic concepts/theories.
Student mostly provides personal
opinions and limited analysis.
Text has under-developed formal
structure. Poor text logic with
recurrent use of contradictions
Student accurately demonstrates an
analysis; develops fair arguments
but they lack substantiation through
relevant economic
concepts/theories.
Text has formal structure.
Satisfactory text logic with some use
of contradictions.
Student accurately demonstrates an
analysis; skilfully develops
arguments, substantiating made
claims through relevant economic
concepts/theories.
Text has clear and well-developed
formal structure. Excellent text
logic with miniscule use of
contradictions.
Student accurately and insightfully
demonstrates an analysis;
masterfully develops arguments,
substantiating made claims through
relevant economic
concepts/theories.
Text has clear and original formal
structure. Outstanding text logic
with no use of contradictions.
Written Communication –
Communicating Solution via
Research (10%)
Applies to Q8
A clear overall argument is derived
based on analysis, demonstrating
independent well-reasoned
judgement.
Relevant and reputable sources are
used and properly cited/referenced.
No attempt, significantly
plagiarised, or solution is
fundamentally flawed and/or
contains excessive detail without
argument.
Irrelevant and non-reputable
sources. Referencing is
nonconforming to standard style
and/or absent.
Solution is basically sound with
some judgement but not based on
analysis.
Irrelevant or non-reputable sources.
Referencing is mainly inaccurate
and/or does not conform to a
standard style.
Solution is sound with appropriate
judgement based on analysis.
Relevant or reputable sources.
Referencing is fairly accurate using
standard style.
Solution is very sound with
comprehensive judgement based on
analysis.
Relevant and reputable sources.
Referencing is accurate using
standard style.
Solution is excellent, with evidence
of originality and comprehensive
judgement based on analysis.
Relevant and reputable sources.
Referencing is accurate using
standard style.
1 out of 11
Related Documents


Your All-in-One AI-Powered Toolkit for Academic Success.
+13062052269
info@desklib.com
Available 24*7 on WhatsApp / Email
![[object Object]](/_next/static/media/star-bottom.7253800d.svg)
Unlock your academic potential
© 2024 | Zucol Services PVT LTD | All rights reserved.