Assignment on Economic Growth and Inequality analysis
Added on 2022-09-08
34 Pages3603 Words19 Views
RUNNING HEAD: - Economic Growth and Inequality analysis 0 | P a g e
ECONOMIC ANALYSIS
Module Number
ECONOMIC ANALYSIS
Module Number
Economic Growth and Inequality analysis 1 | P a g e
Table of Contents
Introduction.................................................................................................................... 2
Section A: Economic Growth and Inequality...........................................................................2
(A) REAL GDP PER CAPITA OF INDIA AND CHINA (USING THE RATIO SCALE):-..............2
(B) CALCULATION OF RICH OR POOR RATIO IN 1980, 1990, 2014....................................4
© DIFFERENCE BETWEEN INDIA AND CHINA AND CHANGES OVER TIME.....................6
(D) EXPLANTION OF ABOVE DIFFERENCES.................................................................8
(E)MEDIAN INCOME IN COUNTRY INDIA AND CHINA..................................................9
(F) IMPACT ON MEDIAN DUE TO CHANGES IN INCOME................................................9
(G) VERTICLE BAR CHART OF CHINA.......................................................................10
(H) FALL IN MEAN AMOUNT.................................................................................... 11
(I) CALCULATION OF MEAN IN EXCEL USING AVERAGE FORMULA TO VERIFY THE
ANSWER................................................................................................................. 12
(L) CHANGES IN THE MEAN DUE TO CHANGE IN THE INCOME..................................12
(M) BRIEF DISCUSSION ON THE ECONOMY OF INDIA AND CHINA..............................13
Section B: Job Market..................................................................................................... 14
(A) AVERAGE EMPLOYMENT, UNEMPLOYMENT AND PARTICIPATION RATE.......14
(B) COMPARISON BETWEEN INDIA AND CHINA USI NG BELOW CHARTS (STATISTICS) 14
© CAUSES OF UNEMPLOYMENT IN INDIA AND CHINA...............................................15
Section- C.................................................................................................................... 15
(2).......................................................................................................................... 23
©............................................................................................................................ 26
Section-D.................................................................................................................... 27
(A).......................................................................................................................... 27
(C).......................................................................................................................... 28
(D).......................................................................................................................... 28
(E).......................................................................................................................... 28
(F).......................................................................................................................... 29
Conclusion on the direction of causality between quality of management practices and real GDP per
capital......................................................................................................................... 30
References............................................................................................................... 31
Economic Growth and Inequality analysis 2 | P a g e
Introduction
This report reveals the key implication and economic growth and inequality of the economic
which helps in assessing the real GDP per capita of India and China. This report has divulged the
key aspects and implication of the economic growth and inequality analysis of the two countries.
After that, economic analysis in context with rich and poor in context with the given economic.
Section A: Economic Growth and Inequality
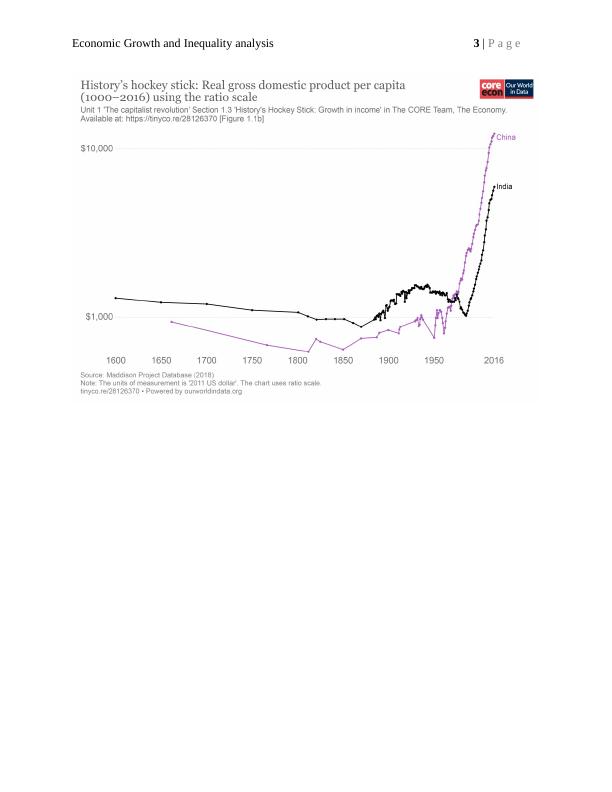
(A) REAL GDP PER CAPITA OF INDIA AND CHINA (USING THE RATIO SCALE):-
Real GDP per capita is a measurement of the total economic output of a country divided by the
number of people and adjusted for inflation. It is used to compare the standard of living between
two countries and over time. India’s GDP per capita has lagged to China’s GDP per capita. From
the beginning of the year 1600 the real GDP per capita of India and china are on the downward
scale simultaneously up to the beginning of 1800 then the per capita growth rate was started to
increase in case of china (Govindaraju, & Tang, 2013). The growth rate of china continuously
increases till 1821. After that again decreasing, this movement started to taken place in the
economy of country (Srinivasan, 2014). Where growth rate of India was always high, china in
the late of 1900 almost touched the growth rate of India and after that real GDP per capita
growth rate is continuously high as compared to India.
Introduction
This report reveals the key implication and economic growth and inequality of the economic
which helps in assessing the real GDP per capita of India and China. This report has divulged the
key aspects and implication of the economic growth and inequality analysis of the two countries.
After that, economic analysis in context with rich and poor in context with the given economic.
Section A: Economic Growth and Inequality
(A) REAL GDP PER CAPITA OF INDIA AND CHINA (USING THE RATIO SCALE):-
Real GDP per capita is a measurement of the total economic output of a country divided by the
number of people and adjusted for inflation. It is used to compare the standard of living between
two countries and over time. India’s GDP per capita has lagged to China’s GDP per capita. From
the beginning of the year 1600 the real GDP per capita of India and china are on the downward
scale simultaneously up to the beginning of 1800 then the per capita growth rate was started to
increase in case of china (Govindaraju, & Tang, 2013). The growth rate of china continuously
increases till 1821. After that again decreasing, this movement started to taken place in the
economy of country (Srinivasan, 2014). Where growth rate of India was always high, china in
the late of 1900 almost touched the growth rate of India and after that real GDP per capita
growth rate is continuously high as compared to India.
Economic Growth and Inequality analysis 3 | P a g e
Economic Growth and Inequality analysis 4 | P a g e
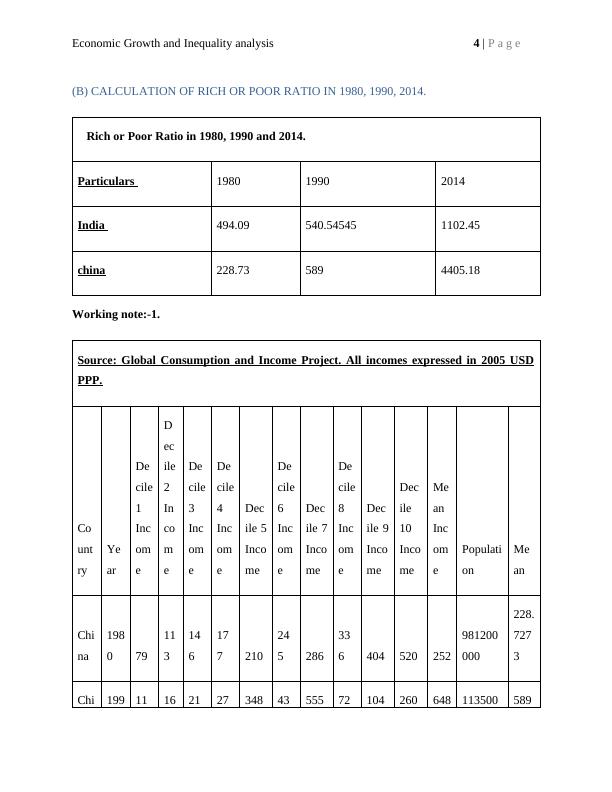
(B) CALCULATION OF RICH OR POOR RATIO IN 1980, 1990, 2014.
Rich or Poor Ratio in 1980, 1990 and 2014.
Particulars 1980 1990 2014
India 494.09 540.54545 1102.45
china 228.73 589 4405.18
Working note:-1.
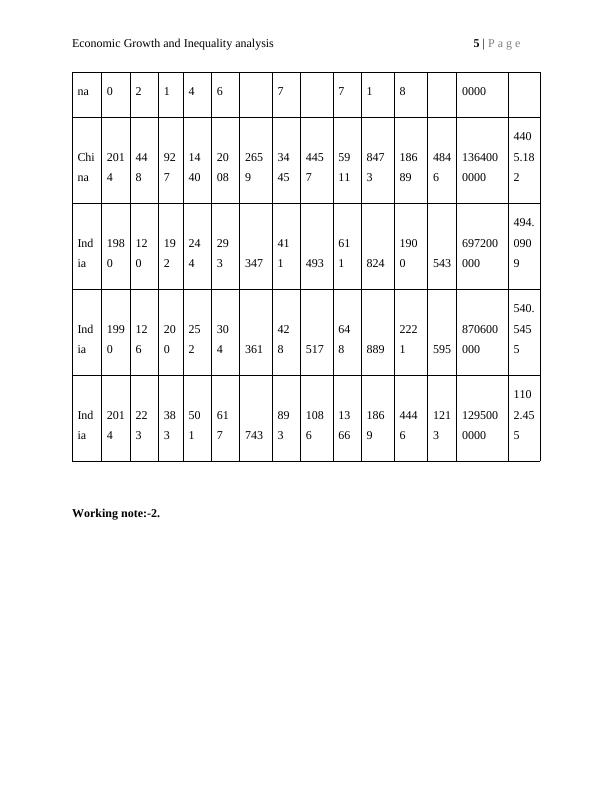
Source: Global Consumption and Income Project. All incomes expressed in 2005 USD
PPP.
Co
unt
ry
Ye
ar
De
cile
1
Inc
om
e
D
ec
ile
2
In
co
m
e
De
cile
3
Inc
om
e
De
cile
4
Inc
om
e
Dec
ile 5
Inco
me
De
cile
6
Inc
om
e
Dec
ile 7
Inco
me
De
cile
8
Inc
om
e
Dec
ile 9
Inco
me
Dec
ile
10
Inco
me
Me
an
Inc
om
e
Populati
on
Me
an
Chi
na
198
0 79
11
3
14
6
17
7 210
24
5 286
33
6 404 520 252
981200
000
228.
727
3
Chi 199 11 16 21 27 348 43 555 72 104 260 648 113500 589
(B) CALCULATION OF RICH OR POOR RATIO IN 1980, 1990, 2014.
Rich or Poor Ratio in 1980, 1990 and 2014.
Particulars 1980 1990 2014
India 494.09 540.54545 1102.45
china 228.73 589 4405.18
Working note:-1.
Source: Global Consumption and Income Project. All incomes expressed in 2005 USD
PPP.
Co
unt
ry
Ye
ar
De
cile
1
Inc
om
e
D
ec
ile
2
In
co
m
e
De
cile
3
Inc
om
e
De
cile
4
Inc
om
e
Dec
ile 5
Inco
me
De
cile
6
Inc
om
e
Dec
ile 7
Inco
me
De
cile
8
Inc
om
e
Dec
ile 9
Inco
me
Dec
ile
10
Inco
me
Me
an
Inc
om
e
Populati
on
Me
an
Chi
na
198
0 79
11
3
14
6
17
7 210
24
5 286
33
6 404 520 252
981200
000
228.
727
3
Chi 199 11 16 21 27 348 43 555 72 104 260 648 113500 589
Economic Growth and Inequality analysis 5 | P a g e
na 0 2 1 4 6 7 7 1 8 0000
Chi
na
201
4
44
8
92
7
14
40
20
08
265
9
34
45
445
7
59
11
847
3
186
89
484
6
136400
0000
440
5.18
2
Ind
ia
198
0
12
0
19
2
24
4
29
3 347
41
1 493
61
1 824
190
0 543
697200
000
494.
090
9
Ind
ia
199
0
12
6
20
0
25
2
30
4 361
42
8 517
64
8 889
222
1 595
870600
000
540.
545
5
Ind
ia
201
4
22
3
38
3
50
1
61
7 743
89
3
108
6
13
66
186
9
444
6
121
3
129500
0000
110
2.45
5
Working note:-2.
Economic Growth and Inequality analysis 6 | P a g e
1 2
0
500
1000
1500
2000
2500
Series1
Series2
Series3
Series4
Series5
1 2
0
500
1000
1500
2000
2500
Series1
Series2
Series3
Series4
Series5
Economic Growth and Inequality analysis 7 | P a g e
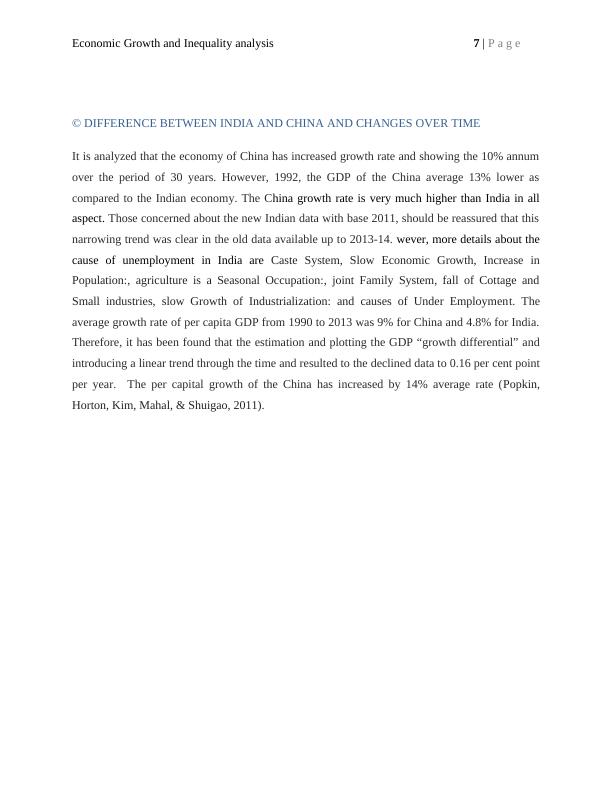
© DIFFERENCE BETWEEN INDIA AND CHINA AND CHANGES OVER TIME
It is analyzed that the economy of China has increased growth rate and showing the 10% annum
over the period of 30 years. However, 1992, the GDP of the China average 13% lower as
compared to the Indian economy. The China growth rate is very much higher than India in all
aspect. Those concerned about the new Indian data with base 2011, should be reassured that this
narrowing trend was clear in the old data available up to 2013-14. wever, more details about the
cause of unemployment in India are Caste System, Slow Economic Growth, Increase in
Population:, agriculture is a Seasonal Occupation:, joint Family System, fall of Cottage and
Small industries, slow Growth of Industrialization: and causes of Under Employment. The
average growth rate of per capita GDP from 1990 to 2013 was 9% for China and 4.8% for India.
Therefore, it has been found that the estimation and plotting the GDP “growth differential” and
introducing a linear trend through the time and resulted to the declined data to 0.16 per cent point
per year. The per capital growth of the China has increased by 14% average rate (Popkin,
Horton, Kim, Mahal, & Shuigao, 2011).
End of preview
Want to access all the pages? Upload your documents or become a member.
Related Documents
Ways to Define and Measure Inequalitylg...
|3
|580
|74
The Capital Revolutionlg...
|8
|968
|169
Financial Stability Assignment 2022lg...
|14
|4109
|3
Development Context in India: Poverty Problemlg...
|16
|4396
|185
Poverty: development problem in Indialg...
|16
|4303
|31
Indian Economy: A Macroeconomic Turnaroundlg...
|30
|1829
|313