Detailed Analysis: Australian Economy's Performance (2016-2017)
VerifiedAdded on 2020/04/07
|8
|2701
|34
Report
AI Summary
This report provides an in-depth analysis of the Australian economy, comparing its performance from the second quarter of 2016 to the end of the first quarter of 2017. It examines key economic indicators such as GDP growth, unemployment rates, inflation, and the balance of trade, comparing the data to set targets to assess the economic health. The report highlights that the GDP growth fluctuated, unemployment initially rose but then decreased, and inflation increased. It also addresses significant economic issues including the new tax system, wage rates, and population pressure. The analysis includes data from Tradingeconomics.com, Budget 2017-2018, and other sources, offering insights into the mining industry's contribution to GDP, the impact of part-time job growth on unemployment, and the effects of inflation on the standard of living. The report concludes by discussing the current economic challenges and the potential impact of government policies on the Australian economy.
Executive Summary
Australia, one of the most significant players in the global economic
scenario, is ranked twelfth in the world in terms of Nominal GDP and
nineteenth in terms of purchasing power parity, in the global
economy. The economy of Australia has been a stable one in a
general framework and has shown more or less consistent and
upward rising economic growth trends barring the few short term
and middle term fluctuations. This report highlights the economic
health of Australia over the past year. The state of the economy can
be measured by theeconomic indicators and comparing them to
their set targets, this will provide a vision whether they have been
achieved or not. This reports compares the performances of the economy of
the country from the second quarter of 2016 to the end of the first quarter of the
current year.Those indictors to measure state of economy include:
GDP (Gross Domestic Product): GDP growth in the last quarter of
2016 in October was negative -0.8%. It grew in the first quarter of
2017 and in the end of the second quarter GDP growth was 0.8%
( Tradingeconomics.com, 2017). It is expected that the real GDP will
grow 3% by 2018(Budget 2017-2018).
Unemployment: The unemployment rate increases from October
2016 to first quarter of 2017, from 5.6% to 5.9%
respectively(Tradingeconomics.com 2017). The rate of
Unemployment decline in June 2017 at 5.6%. The budgeted
unemployment rate by 2018 is 5.1% (Budget 2017-2018).
Inflation: In the end of July 2017, the inflation rate of Australia was
1.9% which is considerably high than the July 2016 at 1%. The
target rate for Inflation is 2-3% (Inflation target,2017).
Term of Trade: In July 2016 the term of trade was 90.2%, which
has been increased in July 2017 at around 13.4%. It is because of
high rate export and import.
Three issues:
This report also underpins the three economic issues including the
new tax system, the wage rates of the country and the rise in the
population pressure.
Paraphrase This Document
Need a fresh take? Get an instant paraphrase of this document with our AI Paraphraser
Introduction:
The purpose of this report is to understand the economy of Australia in the
macroeconomic environment. This report will compare state of the economy in 2016
with 2017.This will be done through examining the economic indicators; economic
growth(GDP) of Australia, unemployment rate, inflation and trade. This report also
highlights the three major issues that economy is facing including the new tax system,
the wage rates of the country and the rise in the population pressure.
GDP of Australia (2016-2017):
The GDP of a country is the sum of the values of all the final goods and
services that are produced within the geographical boundaries of the same country,
within a specified period of time, usually one economic year. The GDP can be
measured in terms of current price levels (Nominal GDP) as well as in real terms
(Real GDP). Australia enjoys a robust GDP of an average of 1343.6 billion USD,
much of which is contributed to the consistently increasing consumer expenditures in
the country (Boons et al. 2013).
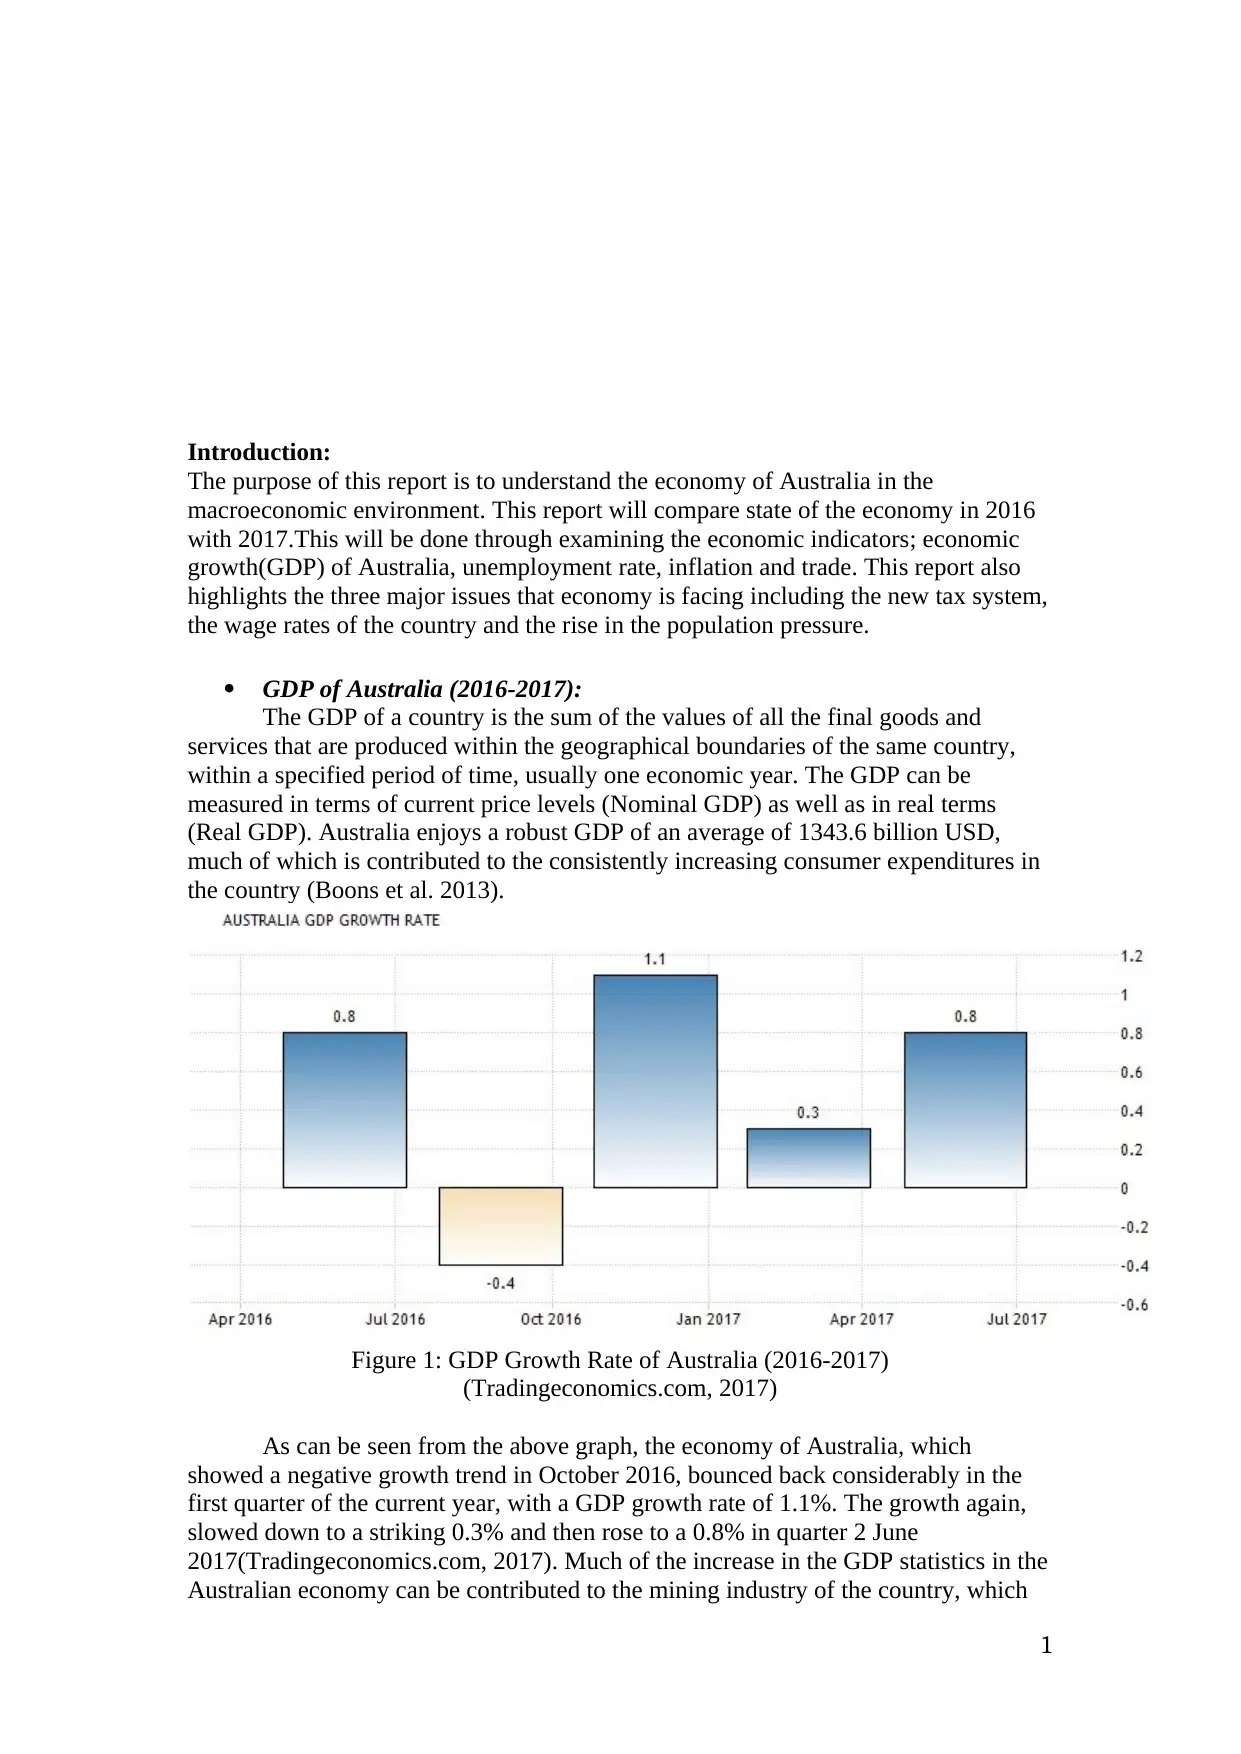
Figure 1: GDP Growth Rate of Australia (2016-2017)
(Tradingeconomics.com, 2017)
As can be seen from the above graph, the economy of Australia, which
showed a negative growth trend in October 2016, bounced back considerably in the
first quarter of the current year, with a GDP growth rate of 1.1%. The growth again,
slowed down to a striking 0.3% and then rose to a 0.8% in quarter 2 June
2017(Tradingeconomics.com, 2017). Much of the increase in the GDP statistics in the
Australian economy can be contributed to the mining industry of the country, which
1
The purpose of this report is to understand the economy of Australia in the
macroeconomic environment. This report will compare state of the economy in 2016
with 2017.This will be done through examining the economic indicators; economic
growth(GDP) of Australia, unemployment rate, inflation and trade. This report also
highlights the three major issues that economy is facing including the new tax system,
the wage rates of the country and the rise in the population pressure.
GDP of Australia (2016-2017):
The GDP of a country is the sum of the values of all the final goods and
services that are produced within the geographical boundaries of the same country,
within a specified period of time, usually one economic year. The GDP can be
measured in terms of current price levels (Nominal GDP) as well as in real terms
(Real GDP). Australia enjoys a robust GDP of an average of 1343.6 billion USD,
much of which is contributed to the consistently increasing consumer expenditures in
the country (Boons et al. 2013).
Figure 1: GDP Growth Rate of Australia (2016-2017)
(Tradingeconomics.com, 2017)
As can be seen from the above graph, the economy of Australia, which
showed a negative growth trend in October 2016, bounced back considerably in the
first quarter of the current year, with a GDP growth rate of 1.1%. The growth again,
slowed down to a striking 0.3% and then rose to a 0.8% in quarter 2 June
2017(Tradingeconomics.com, 2017). Much of the increase in the GDP statistics in the
Australian economy can be contributed to the mining industry of the country, which
1
specifically amounts to AUD$ 29393 million of the GDP in the first quarter of
2017(McCombieand Thirlwall2016). One of the other significant factor, which
contributes robustly to this GDP statistics, is the consumption expenditures of the
households, which in turn is a result of the increase in the spending in the non-
discretionary sectors, primarily including electricity and gas. The overall increase in
the expenditures of the household sectors in this period has been of the rate of 0.5%,
which is an immediate indicator of a fall in the rate of savings in the country as a
whole, which fell by 4.7%. The investment, however, contributes only 0.4% to the
growth of the nation in the current period. Apart from these factors, the increase in the
medical and social services and changes in the inventories also played their parts in
increasing the GDP of the country, with the latter increasing to AUD$ 2069 million
by the end of the first quarter of 2017(Gregory and Smith 2016). According to the
forecasts of the Reserve Bank of the country (RBA), the economy is expected to see a
growth of around 3% by the end of the current year (McLean2012). Much of the
turmoil in the growth dynamics of the economy is expected to be coming from the
post-mining boom conditions, which the economy is experiencing now (Kubiszewski
et al. 2013).
Changes in Unemployment rate between 2016 and 2017:
The rate of unemployment of Australia is taken to be the number of people
who are eligible to work but are unemployed, with respect to the population of the
country. The dynamics with respect to this indicator can be shown with the help of the
following diagram:
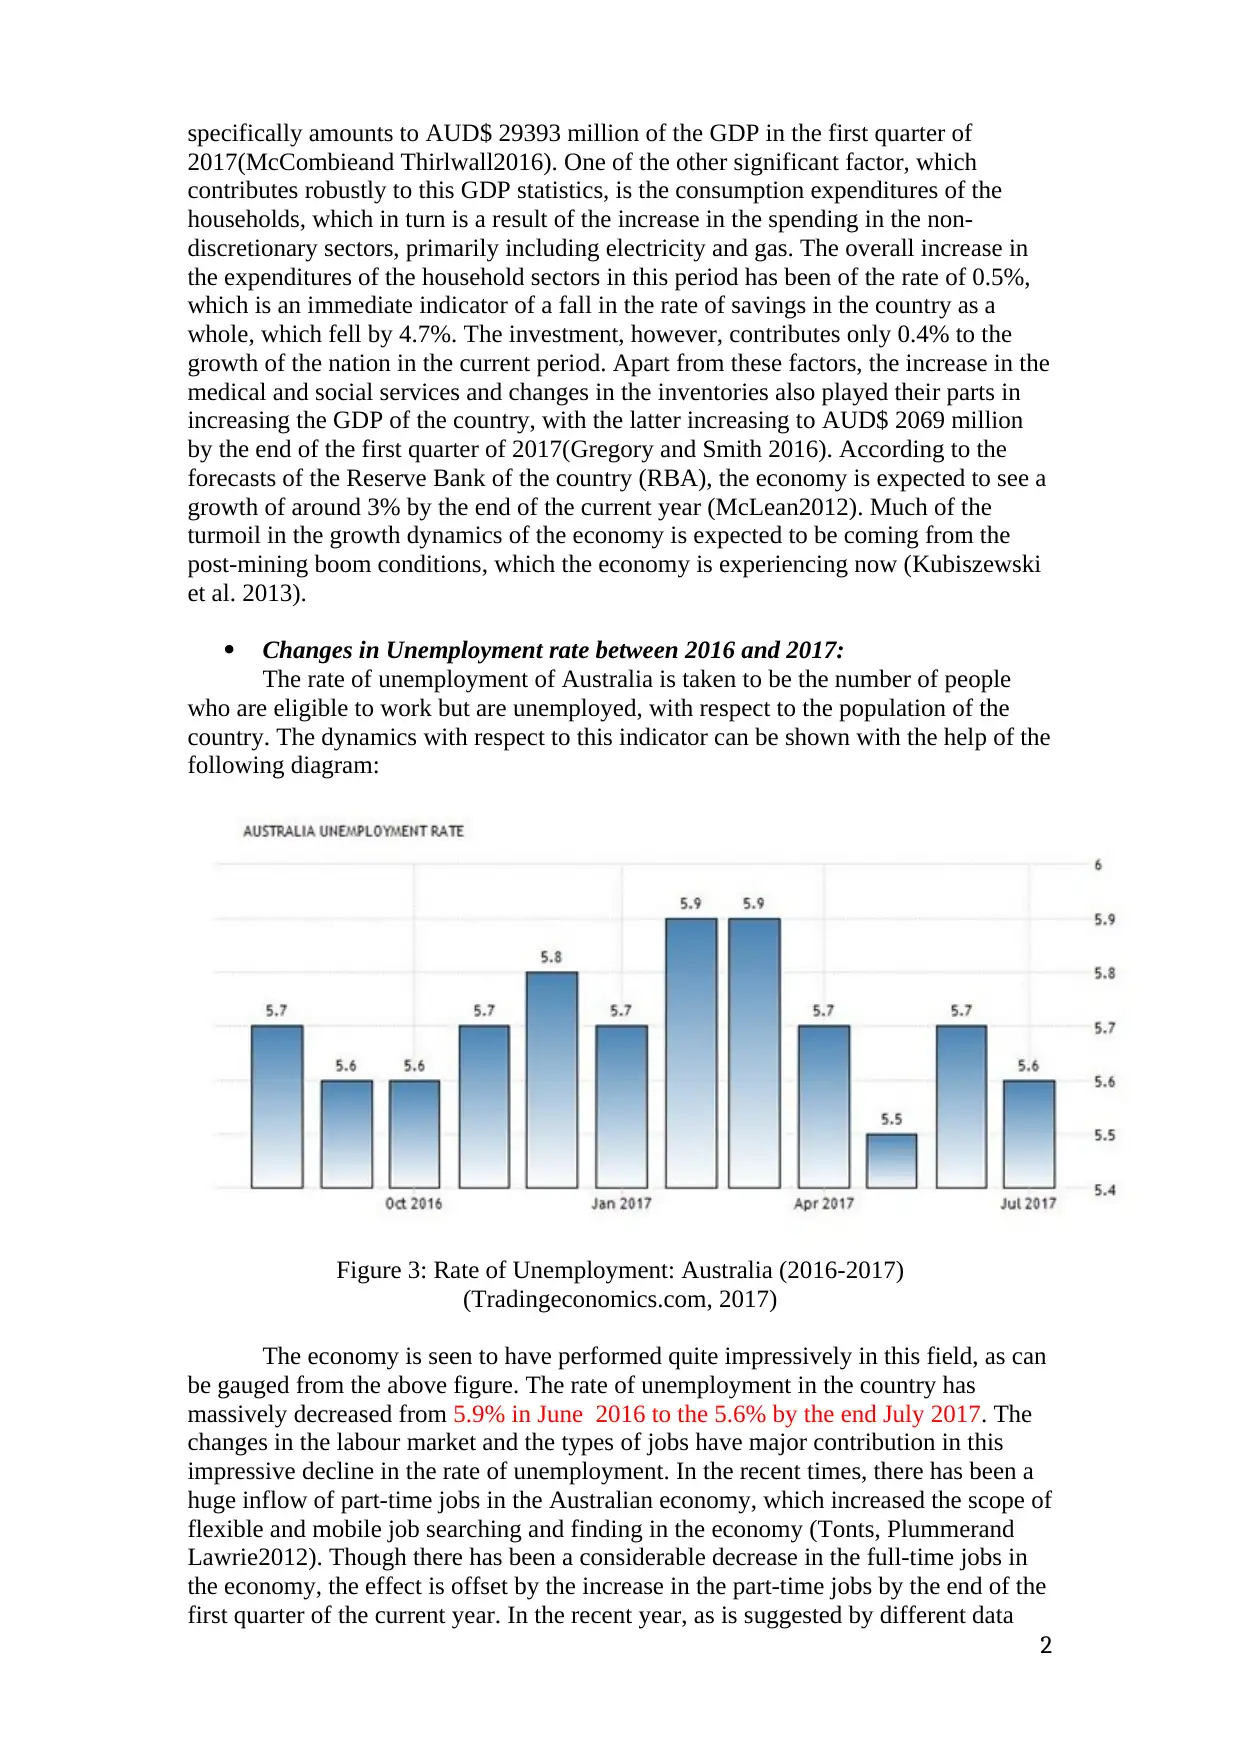
Figure 3: Rate of Unemployment: Australia (2016-2017)
(Tradingeconomics.com, 2017)
The economy is seen to have performed quite impressively in this field, as can
be gauged from the above figure. The rate of unemployment in the country has
massively decreased from 5.9% in June 2016 to the 5.6% by the end July 2017. The
changes in the labour market and the types of jobs have major contribution in this
impressive decline in the rate of unemployment. In the recent times, there has been a
huge inflow of part-time jobs in the Australian economy, which increased the scope of
flexible and mobile job searching and finding in the economy (Tonts, Plummerand
Lawrie2012). Though there has been a considerable decrease in the full-time jobs in
the economy, the effect is offset by the increase in the part-time jobs by the end of the
first quarter of the current year. In the recent year, as is suggested by different data
2
2017(McCombieand Thirlwall2016). One of the other significant factor, which
contributes robustly to this GDP statistics, is the consumption expenditures of the
households, which in turn is a result of the increase in the spending in the non-
discretionary sectors, primarily including electricity and gas. The overall increase in
the expenditures of the household sectors in this period has been of the rate of 0.5%,
which is an immediate indicator of a fall in the rate of savings in the country as a
whole, which fell by 4.7%. The investment, however, contributes only 0.4% to the
growth of the nation in the current period. Apart from these factors, the increase in the
medical and social services and changes in the inventories also played their parts in
increasing the GDP of the country, with the latter increasing to AUD$ 2069 million
by the end of the first quarter of 2017(Gregory and Smith 2016). According to the
forecasts of the Reserve Bank of the country (RBA), the economy is expected to see a
growth of around 3% by the end of the current year (McLean2012). Much of the
turmoil in the growth dynamics of the economy is expected to be coming from the
post-mining boom conditions, which the economy is experiencing now (Kubiszewski
et al. 2013).
Changes in Unemployment rate between 2016 and 2017:
The rate of unemployment of Australia is taken to be the number of people
who are eligible to work but are unemployed, with respect to the population of the
country. The dynamics with respect to this indicator can be shown with the help of the
following diagram:
Figure 3: Rate of Unemployment: Australia (2016-2017)
(Tradingeconomics.com, 2017)
The economy is seen to have performed quite impressively in this field, as can
be gauged from the above figure. The rate of unemployment in the country has
massively decreased from 5.9% in June 2016 to the 5.6% by the end July 2017. The
changes in the labour market and the types of jobs have major contribution in this
impressive decline in the rate of unemployment. In the recent times, there has been a
huge inflow of part-time jobs in the Australian economy, which increased the scope of
flexible and mobile job searching and finding in the economy (Tonts, Plummerand
Lawrie2012). Though there has been a considerable decrease in the full-time jobs in
the economy, the effect is offset by the increase in the part-time jobs by the end of the
first quarter of the current year. In the recent year, as is suggested by different data
2
⊘ This is a preview!⊘
Do you want full access?
Subscribe today to unlock all pages.
Trusted by 1+ million students worldwide
sources, 239,373 new jobs have been created, most of which are of part-time types,
which decreased unemployment significantly. The tax policy, which has been adopted
by the RBA, also contributes in increasing the labour force participation rate
considerably from the last year in the current year (Gregoryand Smith2016).
The unemployment rate, though has decreased, but the problem still remained due to
the presence of low wage rates and the Global Economic Crisis of 2007-2008 and a
significant migration of the domestic workers.
However, the comparatively less rate of unemployment in the current period indicates
towards the fact that the policies taken by the governing authorities of the country
regarding this aspect are being rightly implemented to a considerable extent and are
showing some extent.
Inflation rate comparison: Australia (2016-2017):
The consistent increase in the overall price levels of goods and services in an
economy within a particular period is known as inflation and it directly results in the
fall in the overall purchasing power of the residents of that particular economy. The
inflation rate in the country is measured by the ABS in terms of the CPI of the
country(Abs.gov.au, 2017).
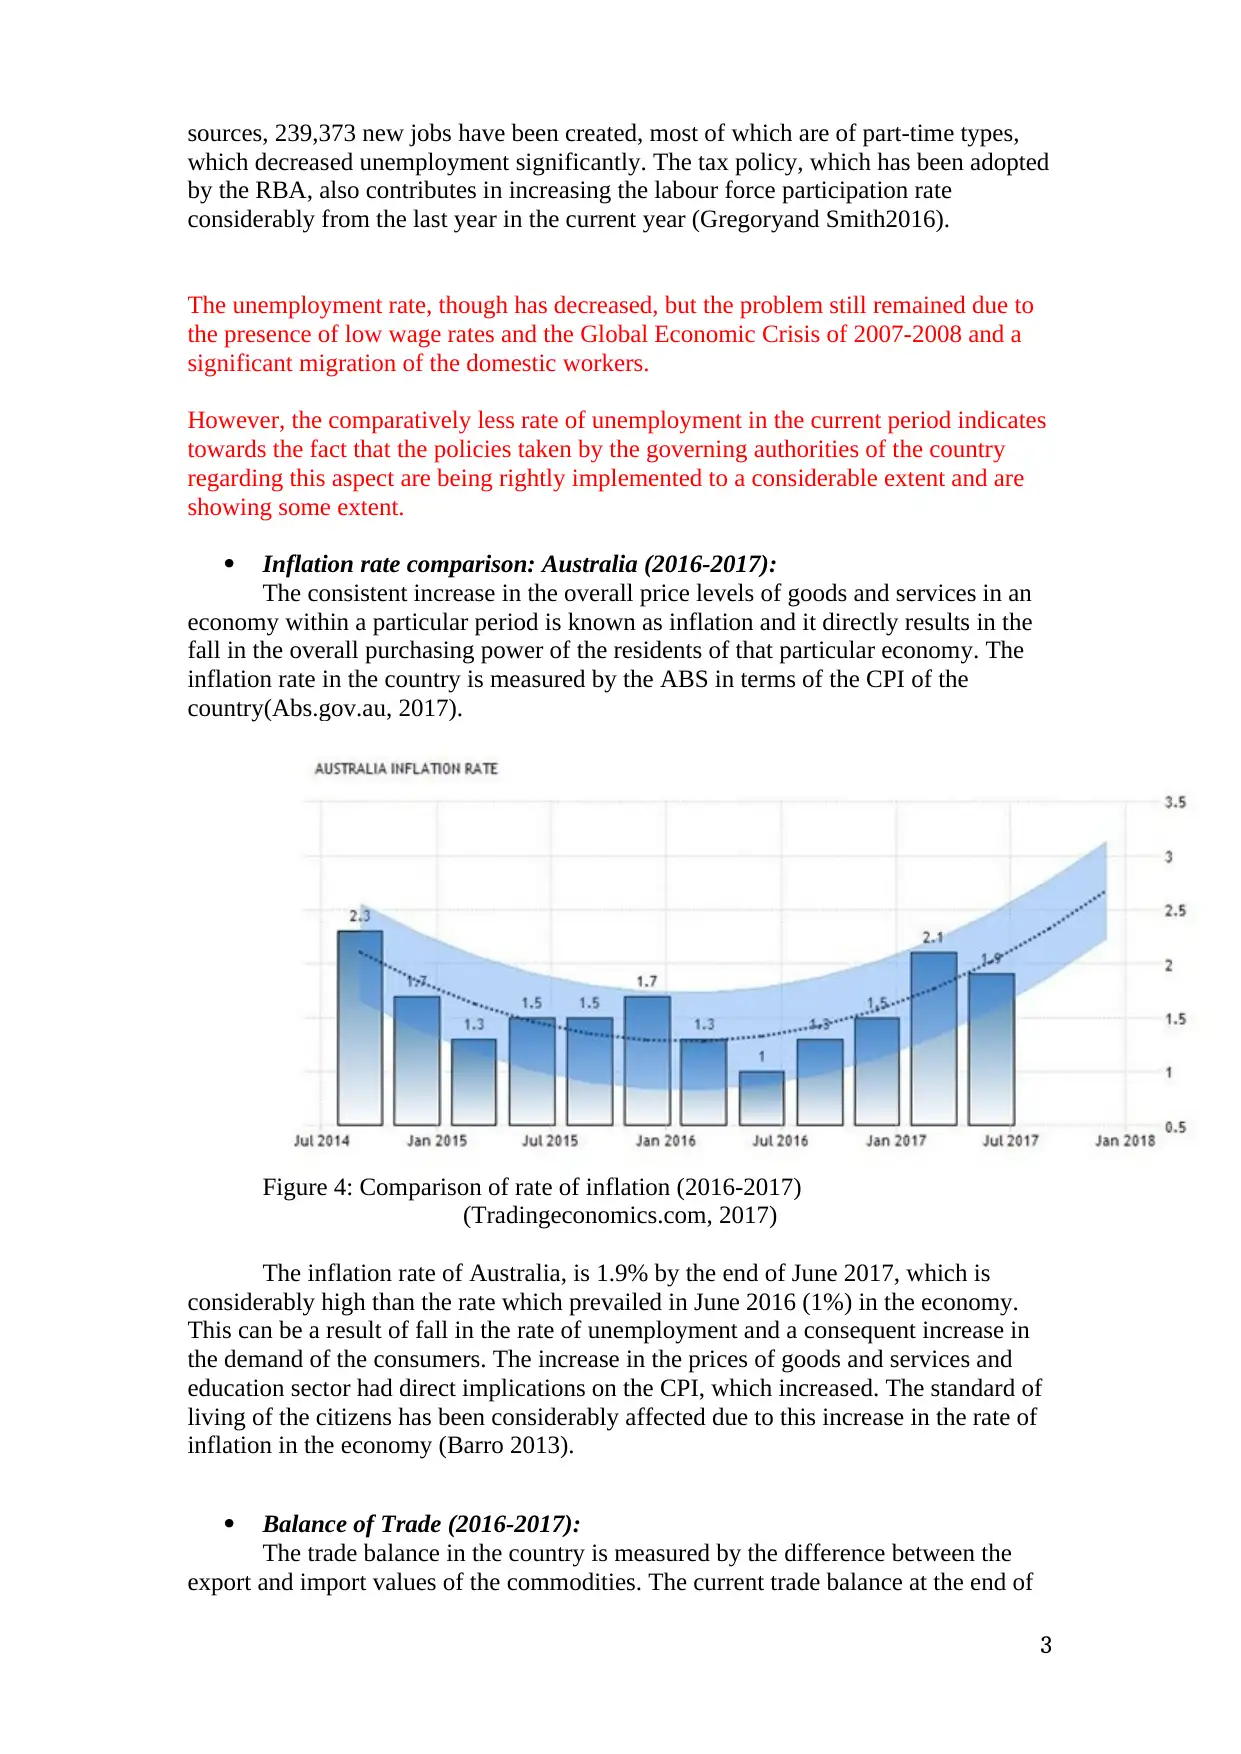
Figure 4: Comparison of rate of inflation (2016-2017)
(Tradingeconomics.com, 2017)
The inflation rate of Australia, is 1.9% by the end of June 2017, which is
considerably high than the rate which prevailed in June 2016 (1%) in the economy.
This can be a result of fall in the rate of unemployment and a consequent increase in
the demand of the consumers. The increase in the prices of goods and services and
education sector had direct implications on the CPI, which increased. The standard of
living of the citizens has been considerably affected due to this increase in the rate of
inflation in the economy (Barro 2013).
Balance of Trade (2016-2017):
The trade balance in the country is measured by the difference between the
export and import values of the commodities. The current trade balance at the end of
3
which decreased unemployment significantly. The tax policy, which has been adopted
by the RBA, also contributes in increasing the labour force participation rate
considerably from the last year in the current year (Gregoryand Smith2016).
The unemployment rate, though has decreased, but the problem still remained due to
the presence of low wage rates and the Global Economic Crisis of 2007-2008 and a
significant migration of the domestic workers.
However, the comparatively less rate of unemployment in the current period indicates
towards the fact that the policies taken by the governing authorities of the country
regarding this aspect are being rightly implemented to a considerable extent and are
showing some extent.
Inflation rate comparison: Australia (2016-2017):
The consistent increase in the overall price levels of goods and services in an
economy within a particular period is known as inflation and it directly results in the
fall in the overall purchasing power of the residents of that particular economy. The
inflation rate in the country is measured by the ABS in terms of the CPI of the
country(Abs.gov.au, 2017).
Figure 4: Comparison of rate of inflation (2016-2017)
(Tradingeconomics.com, 2017)
The inflation rate of Australia, is 1.9% by the end of June 2017, which is
considerably high than the rate which prevailed in June 2016 (1%) in the economy.
This can be a result of fall in the rate of unemployment and a consequent increase in
the demand of the consumers. The increase in the prices of goods and services and
education sector had direct implications on the CPI, which increased. The standard of
living of the citizens has been considerably affected due to this increase in the rate of
inflation in the economy (Barro 2013).
Balance of Trade (2016-2017):
The trade balance in the country is measured by the difference between the
export and import values of the commodities. The current trade balance at the end of
3
Paraphrase This Document
Need a fresh take? Get an instant paraphrase of this document with our AI Paraphraser
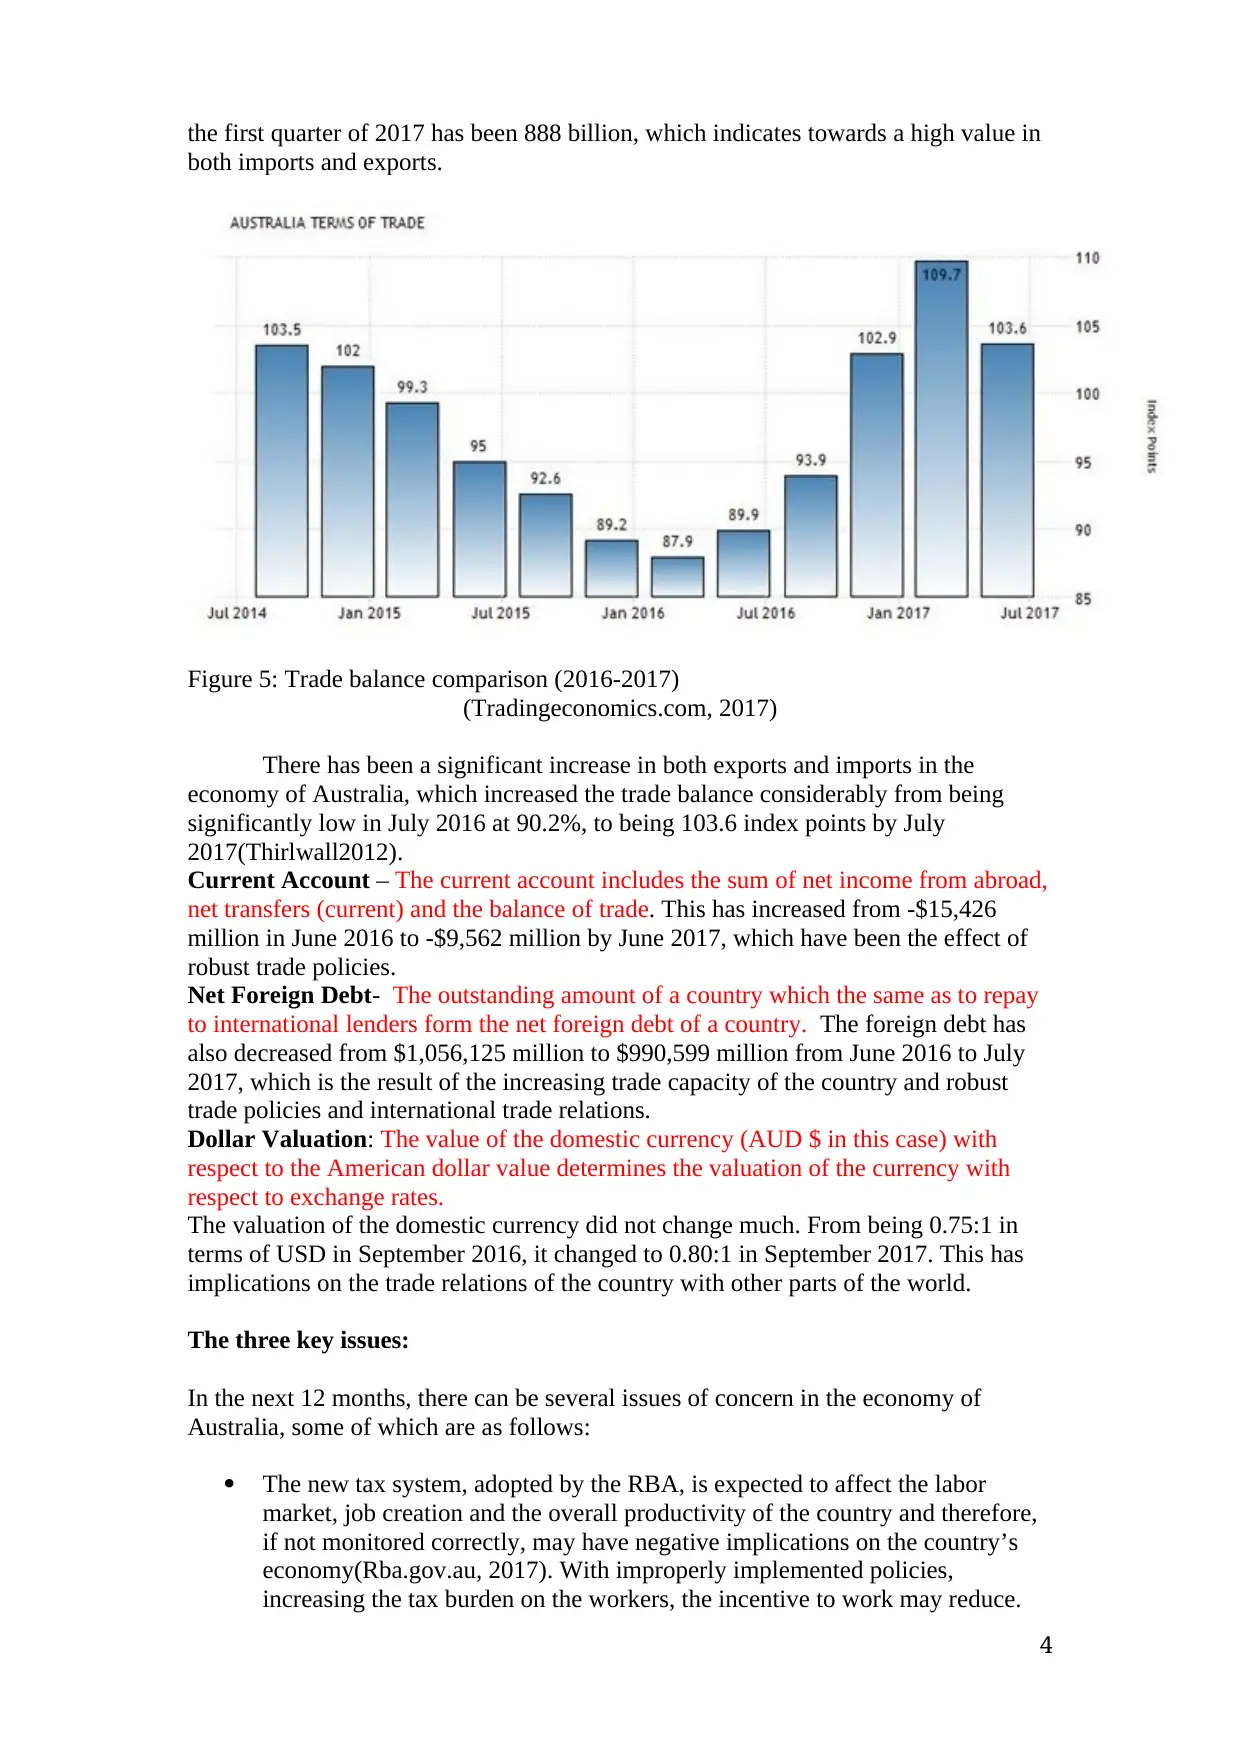
the first quarter of 2017 has been 888 billion, which indicates towards a high value in
both imports and exports.
Figure 5: Trade balance comparison (2016-2017)
(Tradingeconomics.com, 2017)
There has been a significant increase in both exports and imports in the
economy of Australia, which increased the trade balance considerably from being
significantly low in July 2016 at 90.2%, to being 103.6 index points by July
2017(Thirlwall2012).
Current Account – The current account includes the sum of net income from abroad,
net transfers (current) and the balance of trade. This has increased from -$15,426
million in June 2016 to -$9,562 million by June 2017, which have been the effect of
robust trade policies.
Net Foreign Debt- The outstanding amount of a country which the same as to repay
to international lenders form the net foreign debt of a country. The foreign debt has
also decreased from $1,056,125 million to $990,599 million from June 2016 to July
2017, which is the result of the increasing trade capacity of the country and robust
trade policies and international trade relations.
Dollar Valuation: The value of the domestic currency (AUD $ in this case) with
respect to the American dollar value determines the valuation of the currency with
respect to exchange rates.
The valuation of the domestic currency did not change much. From being 0.75:1 in
terms of USD in September 2016, it changed to 0.80:1 in September 2017. This has
implications on the trade relations of the country with other parts of the world.
The three key issues:
In the next 12 months, there can be several issues of concern in the economy of
Australia, some of which are as follows:
The new tax system, adopted by the RBA, is expected to affect the labor
market, job creation and the overall productivity of the country and therefore,
if not monitored correctly, may have negative implications on the country’s
economy(Rba.gov.au, 2017). With improperly implemented policies,
increasing the tax burden on the workers, the incentive to work may reduce.
4
The wage rates of the country, remaining significantly low with wages being
694.90 AUD$/week, as can be seen in the data provided by
Tradingeconomics.com (2017), there is a risk of future stagnation and increase
in unemployment in the country. These can thereby be hampering the
productivity in the next 12 months.
The rise in the population pressure and an increase in the medical cost burden
are collectively expected to raise the CPI of the country in the coming years.
With the decrease in unemployment and rise in demand, the overall price
levels are expected to increase, which may have negative implications on the
economy. The increase in the population has also exerted an upward pressure
on the housing prices of the economy, which is creating an issue of housing
affordability in the economy and is expected to become a bothering issue.
Conclusion:
As can be seen from the above discussion, there has been significant changes
in the economic performance of the country from the second quarter of 2016 to the
end of the first half of 2017. The housing sector turmoil, clubbed with the increase in
the population pressure and the burden of high price levels poses a serious cumulative
threat to the economy of the country in the coming years. However, the current
taxation and employment generation policies and strategies are showing positive
implications on the labour market of the economy and shows hope of recovery from
the problems faced by the Australian economy in the recent times. The recent
problems of inflation, low wage rate and an increased CPI can be ruled out to a
considerable extent with the help of robust monetary and fiscal policies on part of the
Australian government.
5
⊘ This is a preview!⊘
Do you want full access?
Subscribe today to unlock all pages.
Trusted by 1+ million students worldwide
References
Australian GDP Growth rate 1959-2017, Trending Economics, viewed at 14
September 2017,
<https://tradingeconomics.com/australia/gdp-growth>.
Abs.gov.au (2017). Australian Bureau of Statistics, Australian Government, viewed at
20 September 2017<http://www.abs.gov.au>
Australian Unemployment Rate 1978-2017, Trending Economics, viewed at 14
September 2017
<https://tradingeconomics.com/australia/unemployment-rate>
Barro, R.J., 2013. Inflation and Economic Growth. Annals of Economics &
Finance, 14(1).
Boons, F., Montalvo, C., Quist, J. and Wagner, M., 2013. Sustainable innovation,
business models and economic performance: an overview. Journal of Cleaner
Production, 45, pp.1-8.
The Budget: Budget Overview 2016-2017, Australian Government viewed at 15
September 2017,
<http://www.budget.gov.au/2016-17/content/glossies/overview/downloads/
Budget2016-17-Overview.pdf>.
Gregory, R.G. and Smith, R.E., 2016. 15 Unemployment, Inflation and Job Creation
Policies in Australia. Inflation and Unemployment: Theory, Experience and Policy
Making, p.325.
Kubiszewski, I., Costanza, R., Franco, C., Lawn, P., Talberth, J., Jackson, T. and
Aylmer, C., 2013. Beyond GDP: Measuring and achieving global genuine progress.
Ecological Economics, 93, pp.57-68.
Inflation Target 2017, Reserve Bank of Australia, viewed 18 September 2017,
<http://www.rba.gov.au/inflation/inflation-target.html>
McCombie, J. and Thirlwall, A.P., 2016. Economic growth and the balance-of-
payments constraint. Springer.
McLean, I.W., 2012. Why Australia prospered: The shifting sources of economic
growth. Princeton University Press.
Rba.gov.au (2017). Reserve Bank of Australia, viewed at 19 September 2017
<http://www.rba.gov.au>
Shimer, R., 2012. Reassessing the ins and outs of unemployment. Review of Economic
Dynamics, 15(2), pp.127-148.
6
Paraphrase This Document
Need a fresh take? Get an instant paraphrase of this document with our AI Paraphraser
Thirlwall, A.P., 2012. Balance of payments constrained growth models: history and
overview. In Models of Balance of Payments Constrained Growth(pp. 11-49).
Palgrave Macmillan UK.
Tonts, M., Plummer, P. and Lawrie, M., 2012. Socio-economic wellbeing in
Australian mining towns: A comparative analysis. Journal of Rural Studies, 28(3),
pp.288-301.
Tradingeconomics.com (2017). Australia Gross National Income, viewed at 19 Sep
2017,
<https://tradingeconomics.com/australia/gross-national-product>
7
1 out of 8
Related Documents


Your All-in-One AI-Powered Toolkit for Academic Success.
+13062052269
info@desklib.com
Available 24*7 on WhatsApp / Email
![[object Object]](/_next/static/media/star-bottom.7253800d.svg)
Unlock your academic potential
Copyright © 2020–2026 A2Z Services. All Rights Reserved. Developed and managed by ZUCOL.