Economic Performance of Singapore: A Detailed Analysis (2005-2014)
VerifiedAdded on 2023/06/08
|10
|2827
|75
Report
AI Summary
This economics report provides a comprehensive analysis of Singapore's economic performance from 2005 to 2014. It begins with an introduction to Singapore's economic significance as a global hub and examines its free-market economy. The report then delves into the production output performance analysis, focusing on GDP, GDP growth rate, and GDP per capita, using data and figures to illustrate trends and fluctuations, including the impact of the Global Financial Crisis (GFC). Furthermore, it analyzes the unemployment rate, discussing frictional, cyclical, and structural unemployment and their trends over the decade. The report also assesses inflation, consumer prices, and the government's monetary and fiscal policies to maintain economic stability and achieve full employment. The conclusion summarizes the findings, highlighting Singapore's resilience and potential for future growth. This report is a valuable resource for understanding Singapore's economic journey during this period.
Running head: ECONOMICS ASSIGNMENT
Economics Assignment
Name of the student
Name of the university
Author Note
Economics Assignment
Name of the student
Name of the university
Author Note
Paraphrase This Document
Need a fresh take? Get an instant paraphrase of this document with our AI Paraphraser
1ECONOMICS ASSIGNMENT
Introduction:
The Republic of Singapore is an island country, situated in Southeast Asia
with huge economic significance. The country becomes aglobal hub of commerce,
transport and finance and for this; the World Economic Forum recognises it as
“technology-ready” nation. This highly developed economy of free-market is one of
the most competitive countries that have largest market of foreign exchange
(Hornidge & Kurfürst, 2015).This least corrupted country has developed
economically with low rates of tax and higher rates of per-capita income based on
Purchasing Power Parity (PPP). Moreover,public sector companies have played
significant role to develop the economic condition of this country. Singapore has
become the financier across the world by doing foreign direct investment (FDI)
outflow. Singapore also receives huge amount offoreign investment from global
institutions and investors due to its positive business environment (Eudelle &
Shrestha, 2017). Through exporting goods like electronics, services and chemicals,
this country earns huge amount of revenue and this in turn helps domestic
companies to importraw goods and natural resources by large amount.Additionally,
recent growth in the tourism industry has helped it to become where it is now.
Though the economy has enhanced itself during the last ten years by a large extent,
yet there is considerable amount of fluctuation in the market. This report is aimed to
analyse the economic performance of the Singapore for the time period 2005 to
2014 and trace out the performance of the different macroeconomic indicators so as
to argue whether the performance of the state is strong or weak.
Production Output Performance Analysis:
Performance analysis of the Singaporean economy can be done through the
utilisation of Gross domestic product (GDP), GDP per capita and GDP growth rate.
These basic macroeconomic indicators provide monetary value of entire final goods
and services that a country produces during a particular time and it shows country’s
economic activity during one financial year (Chang & Li, 2018).
2ECONOMICS ASSIGNMENT
2005 2006 2007 2008 2009 2010 2011 2012 2013 2014
0
2000000000
4000000000
6000000000
8000000000
10000000000
12000000000
14000000000
16000000000
18000000000
GDP of Singapore
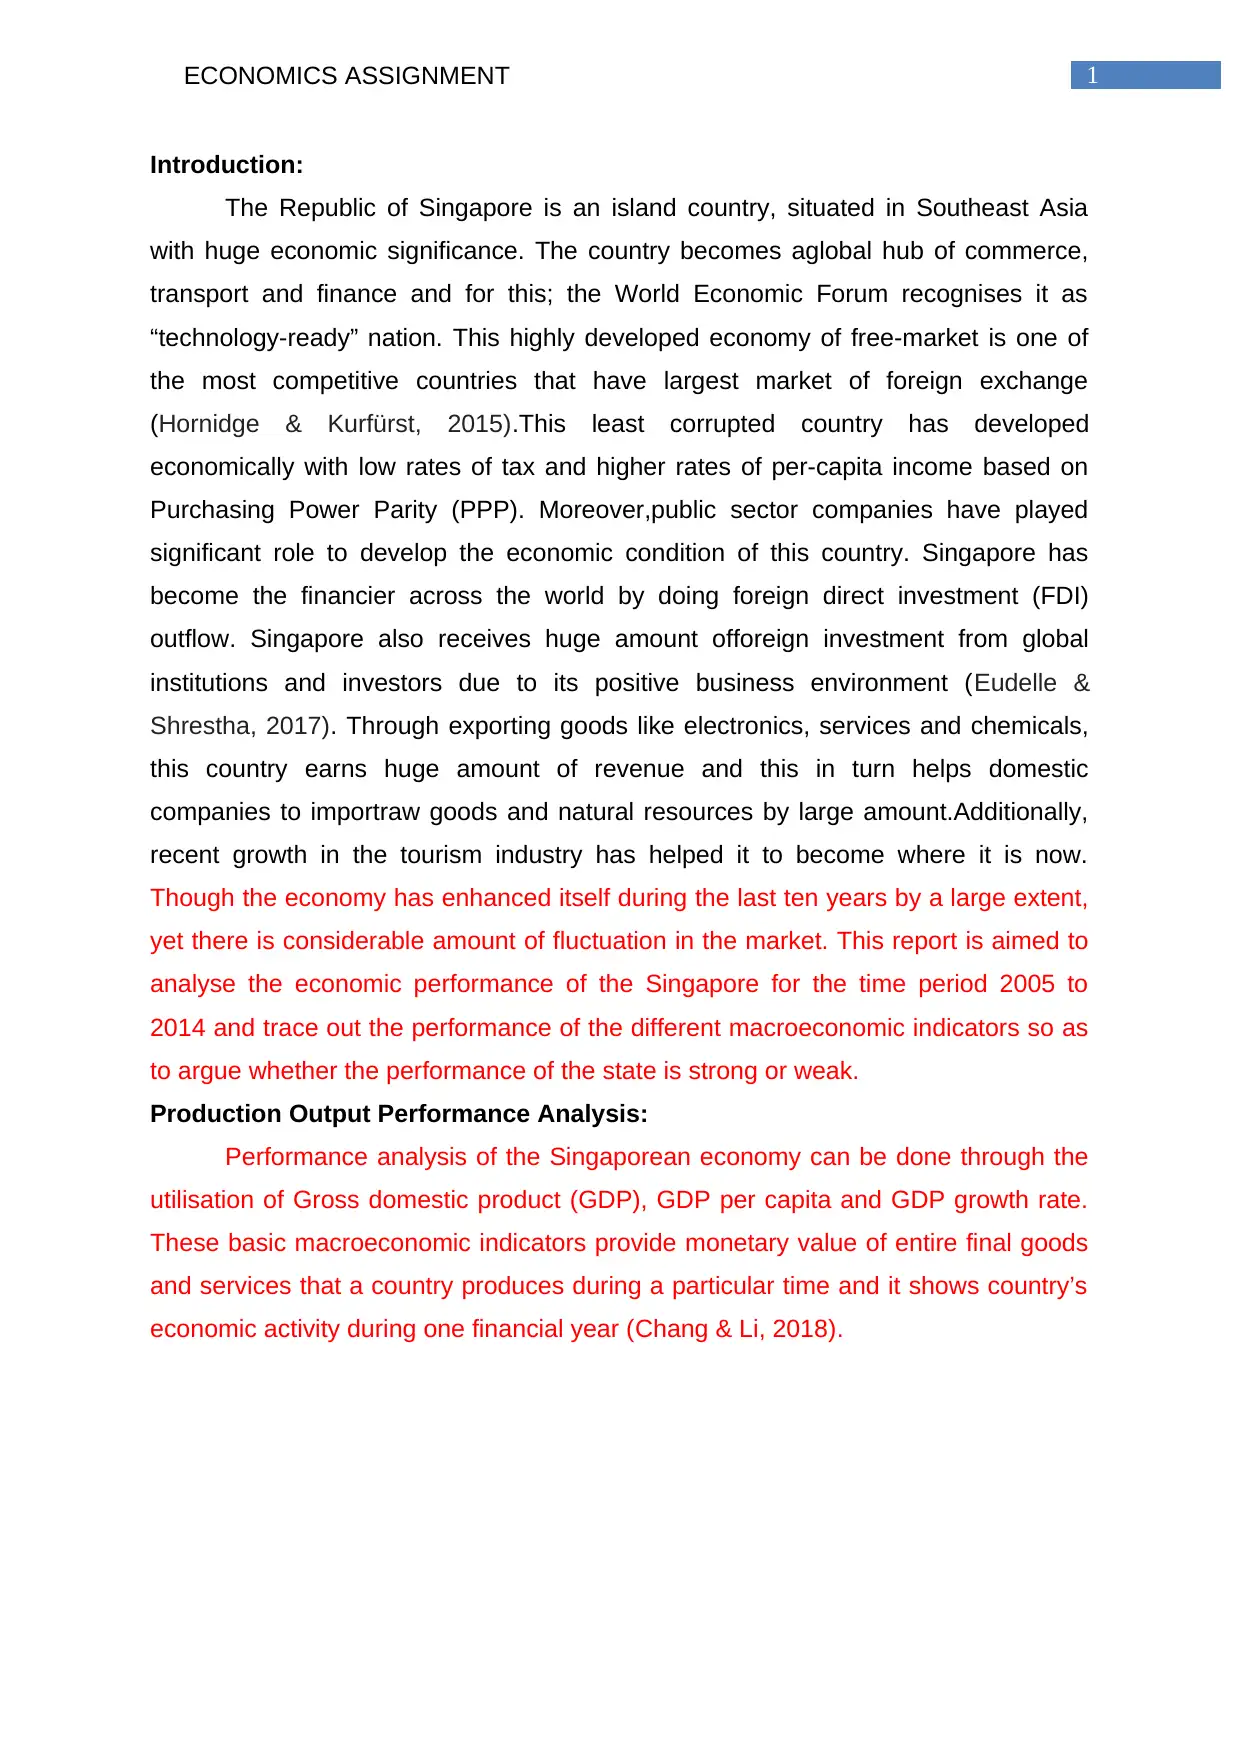
Figure 1: GDP of Singapore
Source: (data.worldbank.org, 2018)
As it can be seen from the above figure, GDP of Singapore during the
selected time frame has face good amount of growth with certain amount of
fluctuation during 2008 owing to Global Financial Crisis (GFC) and during 2011
owing to structural reform within the state(Feldstein, 2017). With the upward trend
GDP figure of the Singaporean economy showcase that the economy in the coming
days will expand further.
2005 2006 2007 2008 2009 2010 2011 2012 2013 2014
-2
0
2
4
6
8
10
12
14
16
18
GDP growth (annual %)
GDP growth (annual %)
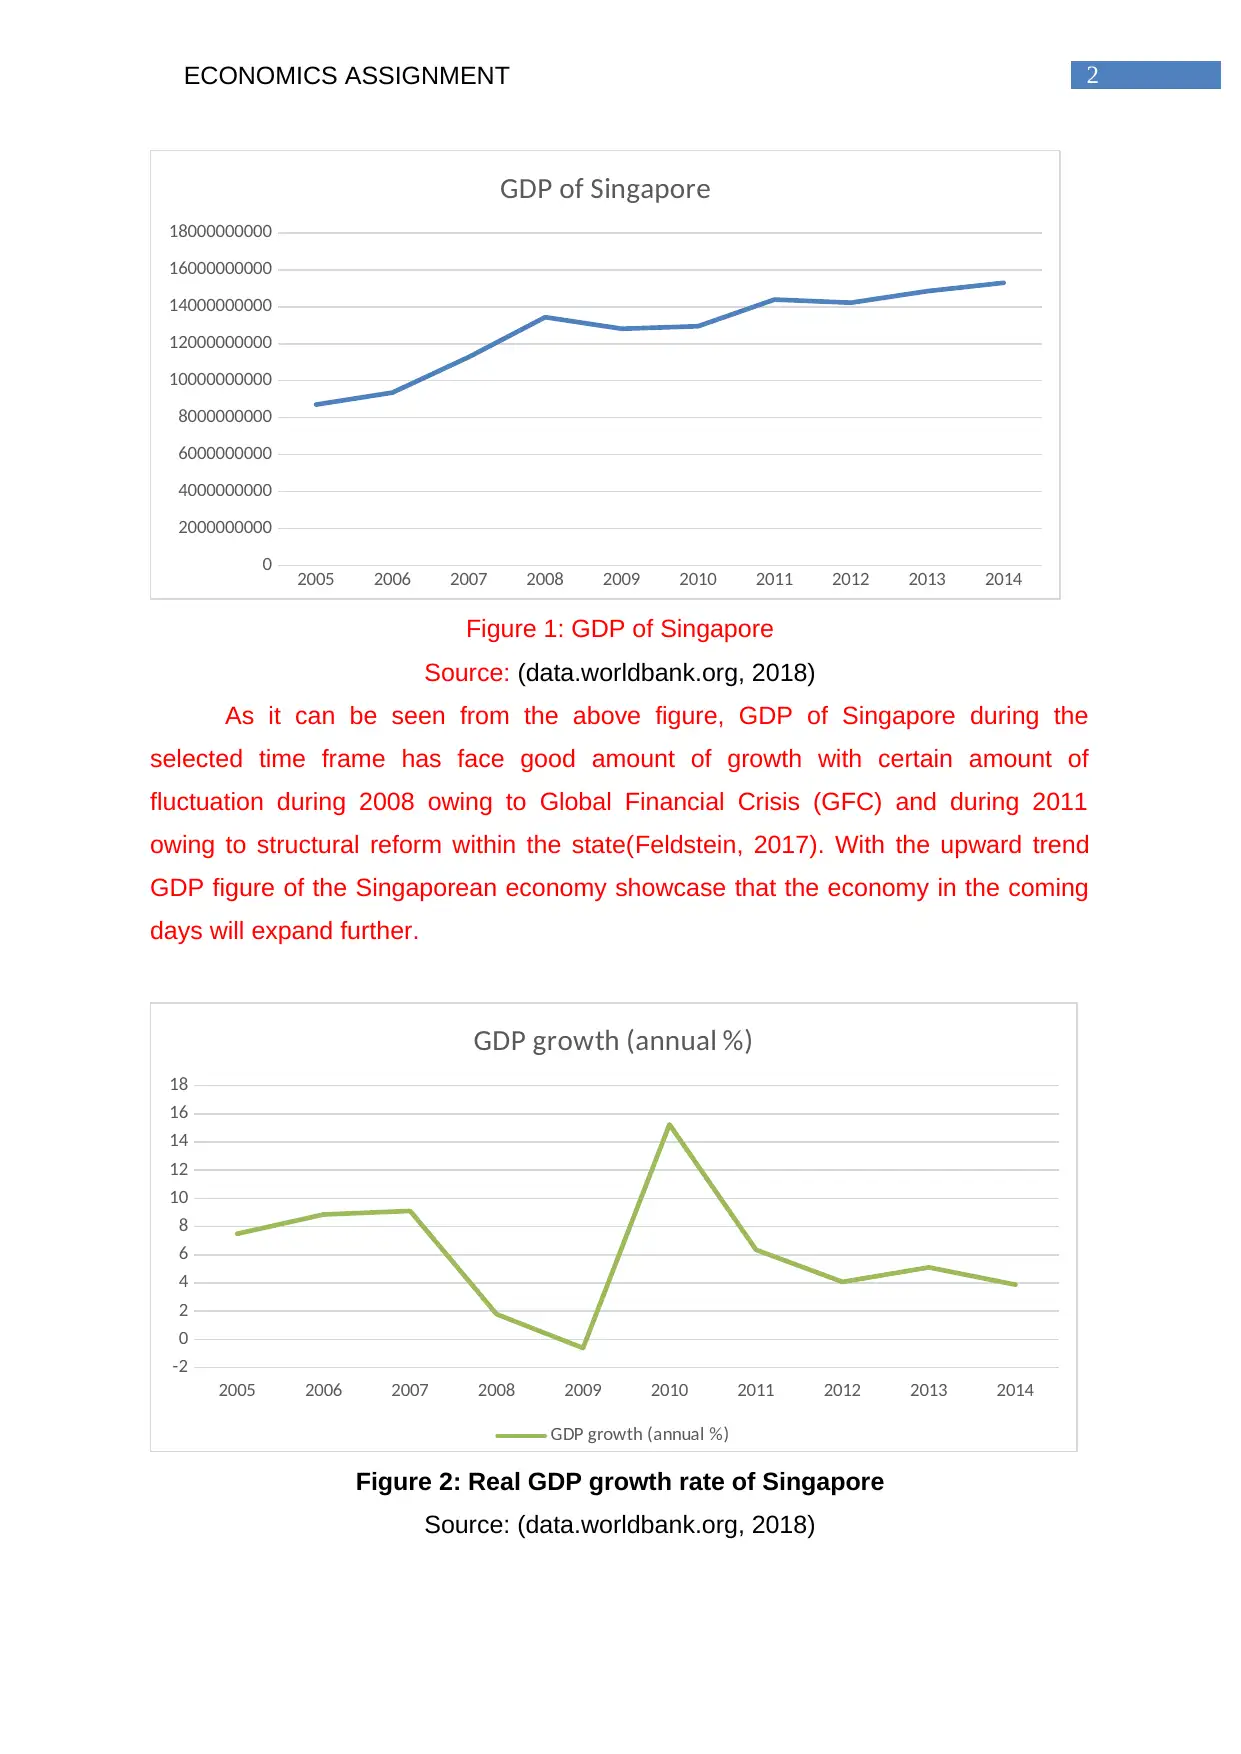
Figure 2: Real GDP growth rate of Singapore
Source: (data.worldbank.org, 2018)
2005 2006 2007 2008 2009 2010 2011 2012 2013 2014
0
2000000000
4000000000
6000000000
8000000000
10000000000
12000000000
14000000000
16000000000
18000000000
GDP of Singapore
Figure 1: GDP of Singapore
Source: (data.worldbank.org, 2018)
As it can be seen from the above figure, GDP of Singapore during the
selected time frame has face good amount of growth with certain amount of
fluctuation during 2008 owing to Global Financial Crisis (GFC) and during 2011
owing to structural reform within the state(Feldstein, 2017). With the upward trend
GDP figure of the Singaporean economy showcase that the economy in the coming
days will expand further.
2005 2006 2007 2008 2009 2010 2011 2012 2013 2014
-2
0
2
4
6
8
10
12
14
16
18
GDP growth (annual %)
GDP growth (annual %)
Figure 2: Real GDP growth rate of Singapore
Source: (data.worldbank.org, 2018)
⊘ This is a preview!⊘
Do you want full access?
Subscribe today to unlock all pages.
Trusted by 1+ million students worldwide
3ECONOMICS ASSIGNMENT
According to above figure, GDP growth rate of Singapore has increased
during 2005, 2006 and 2007. However, after 2007, the growth rate has fallen
drastically and has become negative in 2009. The country has experienced such
negative economic outcomes due to the (GFC) that has affected other countries
adversely as well. Before, financial crisis, GDP of Singapore has increased by 6% on
average until 2007;however, this growth rate has decreased to 0.6% in 2008.
Contrary to this, in 2010 the country has successfully recover its economic condition
and after this year, the economy has maintained a stable growth trend. This GDP
growth trend has become 4.1% between 2011 and 2013 (data.worldbank.org, 2018).
After 2010, again the GDP growth rate has decreased significantly due to the
structural reform of the domestic economy. Hence, this economic growth rate has
fluctuated due to changing economic conditions of exporting countries.
2005 2006 2007 2008 2009 2010 2011 2012 2013 2014
0
10000
20000
30000
40000
50000
60000
70000
80000
GDP per capita
Singaore GDP per capita (current US$)
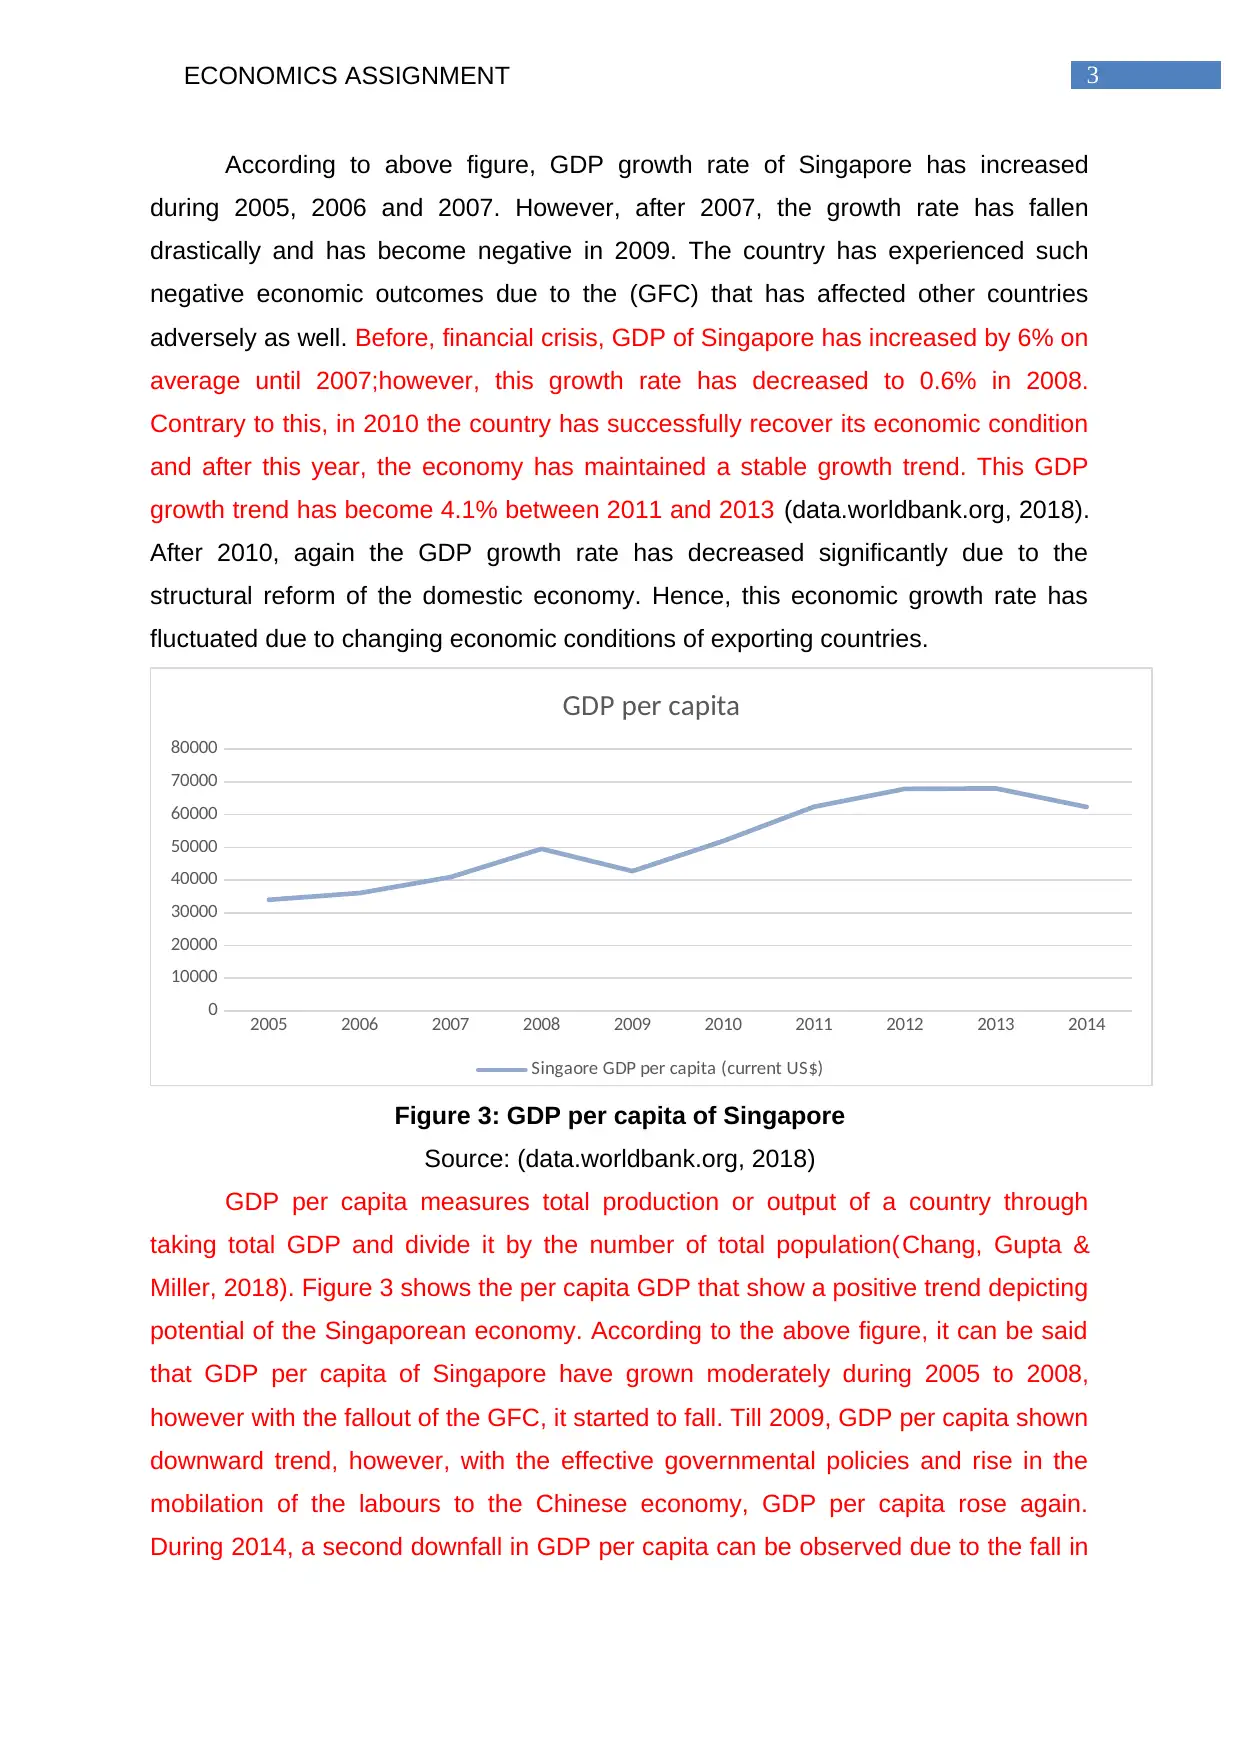
Figure 3: GDP per capita of Singapore
Source: (data.worldbank.org, 2018)
GDP per capita measures total production or output of a country through
taking total GDP and divide it by the number of total population(Chang, Gupta &
Miller, 2018). Figure 3 shows the per capita GDP that show a positive trend depicting
potential of the Singaporean economy. According to the above figure, it can be said
that GDP per capita of Singapore have grown moderately during 2005 to 2008,
however with the fallout of the GFC, it started to fall. Till 2009, GDP per capita shown
downward trend, however, with the effective governmental policies and rise in the
mobilation of the labours to the Chinese economy, GDP per capita rose again.
During 2014, a second downfall in GDP per capita can be observed due to the fall in
According to above figure, GDP growth rate of Singapore has increased
during 2005, 2006 and 2007. However, after 2007, the growth rate has fallen
drastically and has become negative in 2009. The country has experienced such
negative economic outcomes due to the (GFC) that has affected other countries
adversely as well. Before, financial crisis, GDP of Singapore has increased by 6% on
average until 2007;however, this growth rate has decreased to 0.6% in 2008.
Contrary to this, in 2010 the country has successfully recover its economic condition
and after this year, the economy has maintained a stable growth trend. This GDP
growth trend has become 4.1% between 2011 and 2013 (data.worldbank.org, 2018).
After 2010, again the GDP growth rate has decreased significantly due to the
structural reform of the domestic economy. Hence, this economic growth rate has
fluctuated due to changing economic conditions of exporting countries.
2005 2006 2007 2008 2009 2010 2011 2012 2013 2014
0
10000
20000
30000
40000
50000
60000
70000
80000
GDP per capita
Singaore GDP per capita (current US$)
Figure 3: GDP per capita of Singapore
Source: (data.worldbank.org, 2018)
GDP per capita measures total production or output of a country through
taking total GDP and divide it by the number of total population(Chang, Gupta &
Miller, 2018). Figure 3 shows the per capita GDP that show a positive trend depicting
potential of the Singaporean economy. According to the above figure, it can be said
that GDP per capita of Singapore have grown moderately during 2005 to 2008,
however with the fallout of the GFC, it started to fall. Till 2009, GDP per capita shown
downward trend, however, with the effective governmental policies and rise in the
mobilation of the labours to the Chinese economy, GDP per capita rose again.
During 2014, a second downfall in GDP per capita can be observed due to the fall in
Paraphrase This Document
Need a fresh take? Get an instant paraphrase of this document with our AI Paraphraser
4ECONOMICS ASSIGNMENT
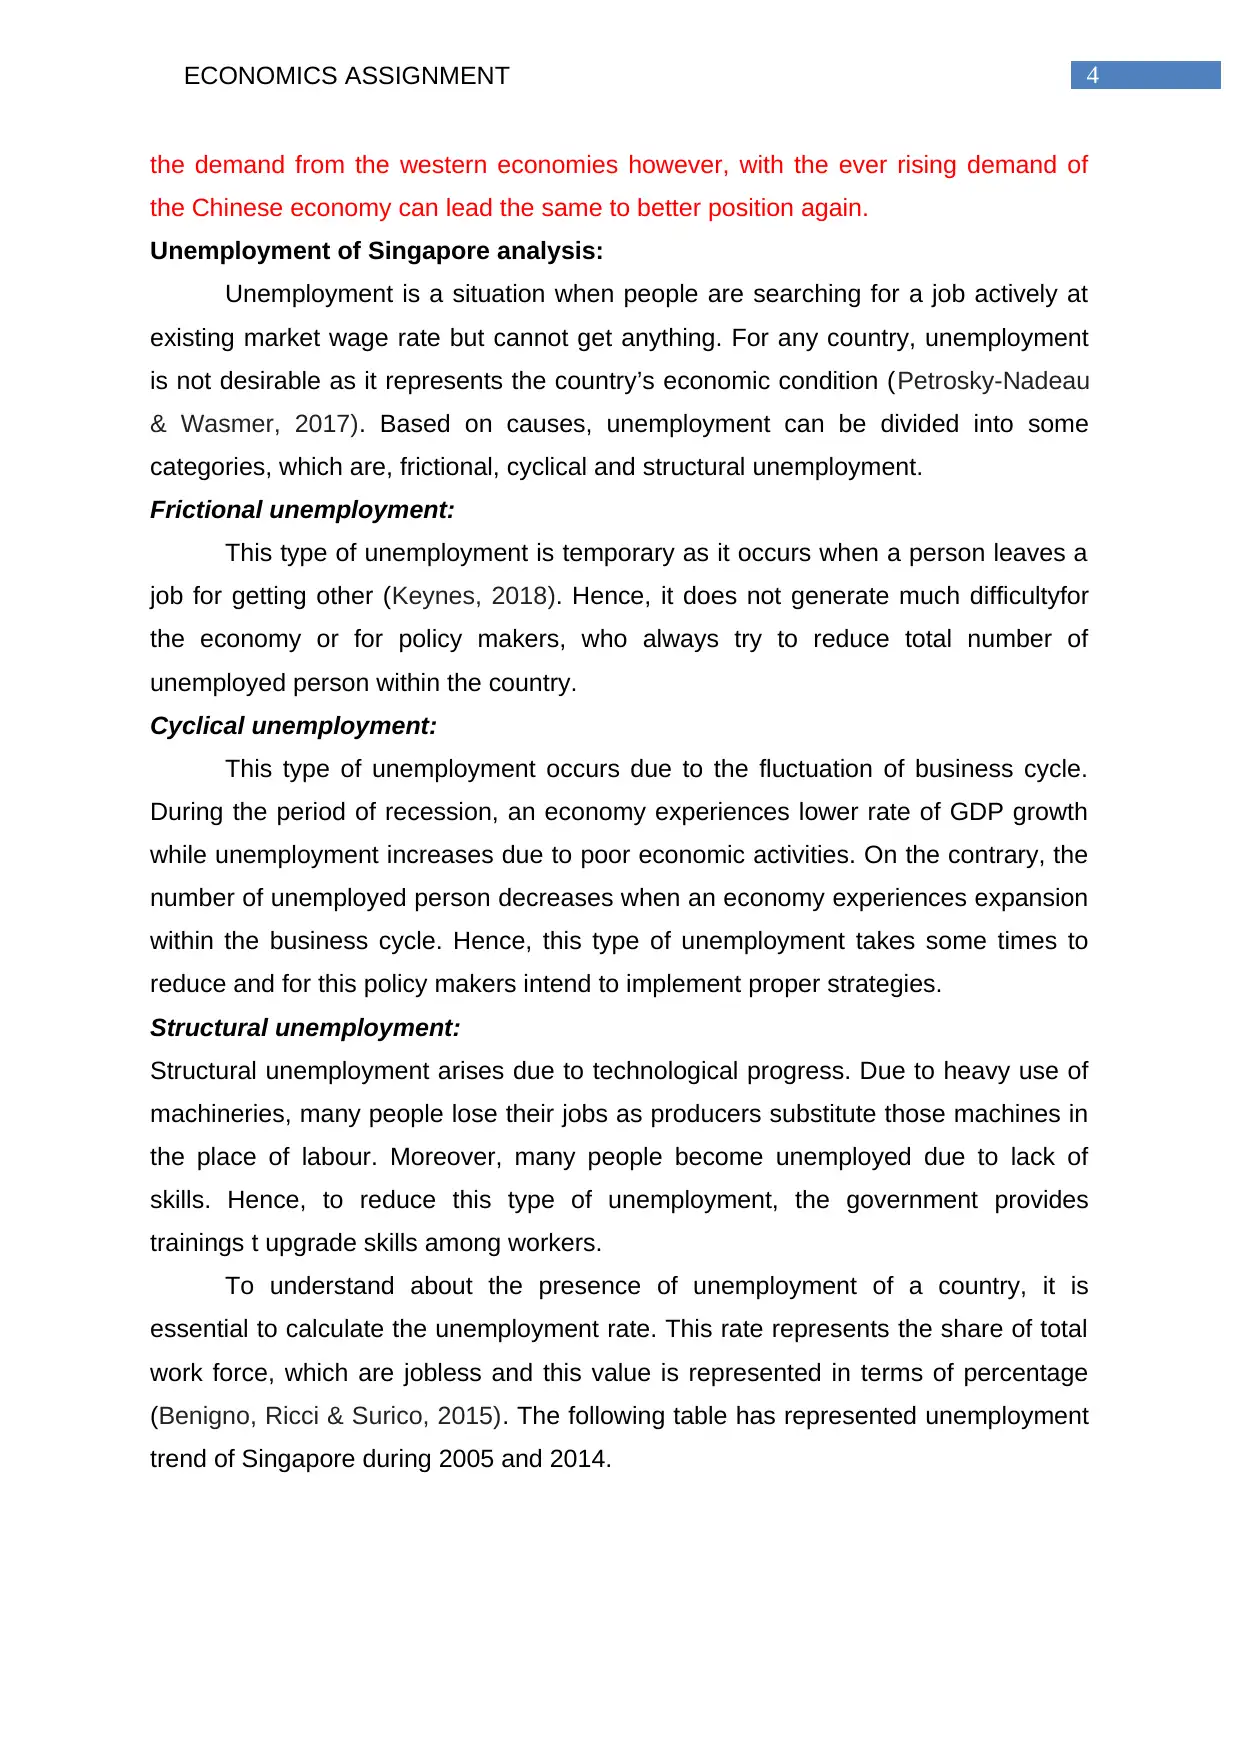
the demand from the western economies however, with the ever rising demand of
the Chinese economy can lead the same to better position again.
Unemployment of Singapore analysis:
Unemployment is a situation when people are searching for a job actively at
existing market wage rate but cannot get anything. For any country, unemployment
is not desirable as it represents the country’s economic condition (Petrosky-Nadeau
& Wasmer, 2017). Based on causes, unemployment can be divided into some
categories, which are, frictional, cyclical and structural unemployment.
Frictional unemployment:
This type of unemployment is temporary as it occurs when a person leaves a
job for getting other (Keynes, 2018). Hence, it does not generate much difficultyfor
the economy or for policy makers, who always try to reduce total number of
unemployed person within the country.
Cyclical unemployment:
This type of unemployment occurs due to the fluctuation of business cycle.
During the period of recession, an economy experiences lower rate of GDP growth
while unemployment increases due to poor economic activities. On the contrary, the
number of unemployed person decreases when an economy experiences expansion
within the business cycle. Hence, this type of unemployment takes some times to
reduce and for this policy makers intend to implement proper strategies.
Structural unemployment:
Structural unemployment arises due to technological progress. Due to heavy use of
machineries, many people lose their jobs as producers substitute those machines in
the place of labour. Moreover, many people become unemployed due to lack of
skills. Hence, to reduce this type of unemployment, the government provides
trainings t upgrade skills among workers.
To understand about the presence of unemployment of a country, it is
essential to calculate the unemployment rate. This rate represents the share of total
work force, which are jobless and this value is represented in terms of percentage
(Benigno, Ricci & Surico, 2015). The following table has represented unemployment
trend of Singapore during 2005 and 2014.
5ECONOMICS ASSIGNMENT
2005 2006 2007 2008 2009 2010 2011 2012 2013 2014
0
1
2
3
4
5
6
Unemployment, total (% of total labor force)
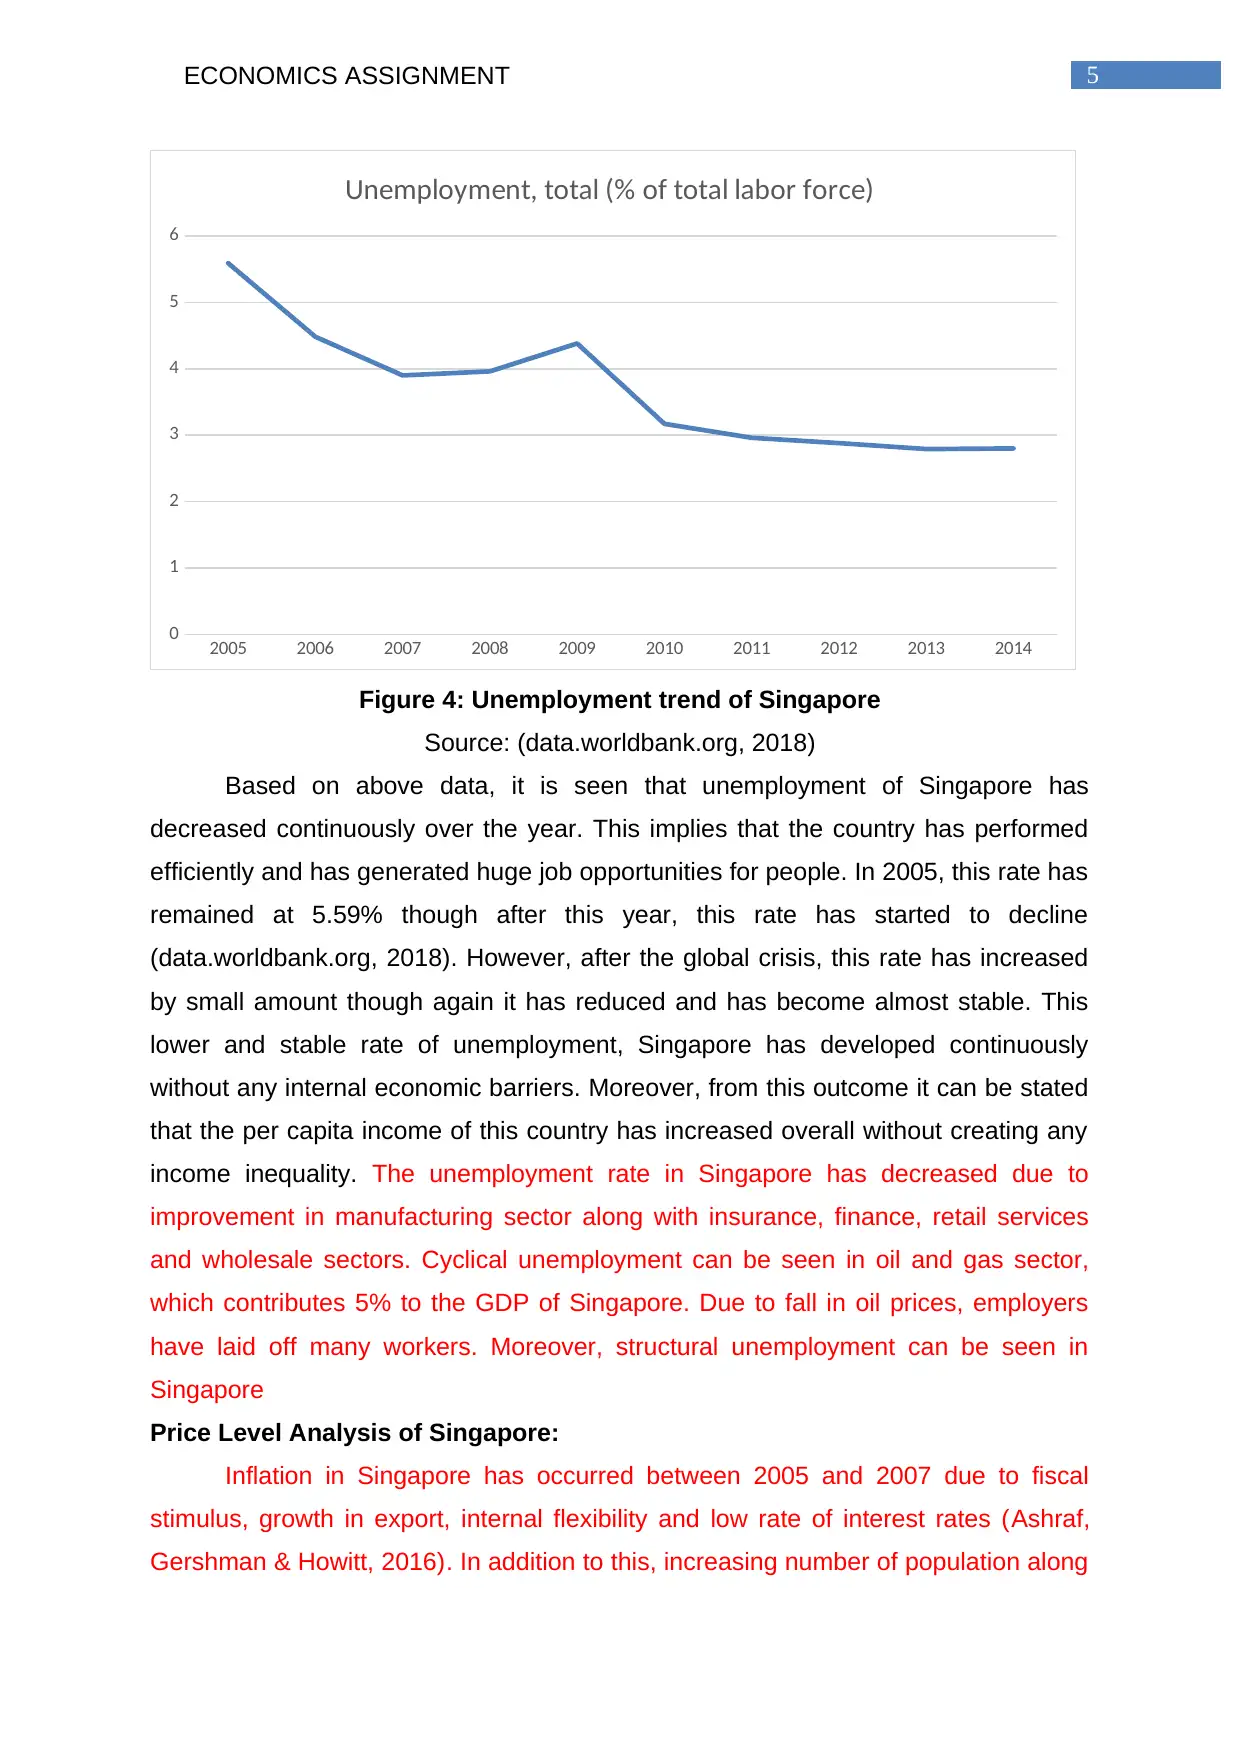
Figure 4: Unemployment trend of Singapore
Source: (data.worldbank.org, 2018)
Based on above data, it is seen that unemployment of Singapore has
decreased continuously over the year. This implies that the country has performed
efficiently and has generated huge job opportunities for people. In 2005, this rate has
remained at 5.59% though after this year, this rate has started to decline
(data.worldbank.org, 2018). However, after the global crisis, this rate has increased
by small amount though again it has reduced and has become almost stable. This
lower and stable rate of unemployment, Singapore has developed continuously
without any internal economic barriers. Moreover, from this outcome it can be stated
that the per capita income of this country has increased overall without creating any
income inequality. The unemployment rate in Singapore has decreased due to
improvement in manufacturing sector along with insurance, finance, retail services
and wholesale sectors. Cyclical unemployment can be seen in oil and gas sector,
which contributes 5% to the GDP of Singapore. Due to fall in oil prices, employers
have laid off many workers. Moreover, structural unemployment can be seen in
Singapore
Price Level Analysis of Singapore:
Inflation in Singapore has occurred between 2005 and 2007 due to fiscal
stimulus, growth in export, internal flexibility and low rate of interest rates (Ashraf,
Gershman & Howitt, 2016). In addition to this, increasing number of population along
2005 2006 2007 2008 2009 2010 2011 2012 2013 2014
0
1
2
3
4
5
6
Unemployment, total (% of total labor force)
Figure 4: Unemployment trend of Singapore
Source: (data.worldbank.org, 2018)
Based on above data, it is seen that unemployment of Singapore has
decreased continuously over the year. This implies that the country has performed
efficiently and has generated huge job opportunities for people. In 2005, this rate has
remained at 5.59% though after this year, this rate has started to decline
(data.worldbank.org, 2018). However, after the global crisis, this rate has increased
by small amount though again it has reduced and has become almost stable. This
lower and stable rate of unemployment, Singapore has developed continuously
without any internal economic barriers. Moreover, from this outcome it can be stated
that the per capita income of this country has increased overall without creating any
income inequality. The unemployment rate in Singapore has decreased due to
improvement in manufacturing sector along with insurance, finance, retail services
and wholesale sectors. Cyclical unemployment can be seen in oil and gas sector,
which contributes 5% to the GDP of Singapore. Due to fall in oil prices, employers
have laid off many workers. Moreover, structural unemployment can be seen in
Singapore
Price Level Analysis of Singapore:
Inflation in Singapore has occurred between 2005 and 2007 due to fiscal
stimulus, growth in export, internal flexibility and low rate of interest rates (Ashraf,
Gershman & Howitt, 2016). In addition to this, increasing number of population along
⊘ This is a preview!⊘
Do you want full access?
Subscribe today to unlock all pages.
Trusted by 1+ million students worldwide
6ECONOMICS ASSIGNMENT
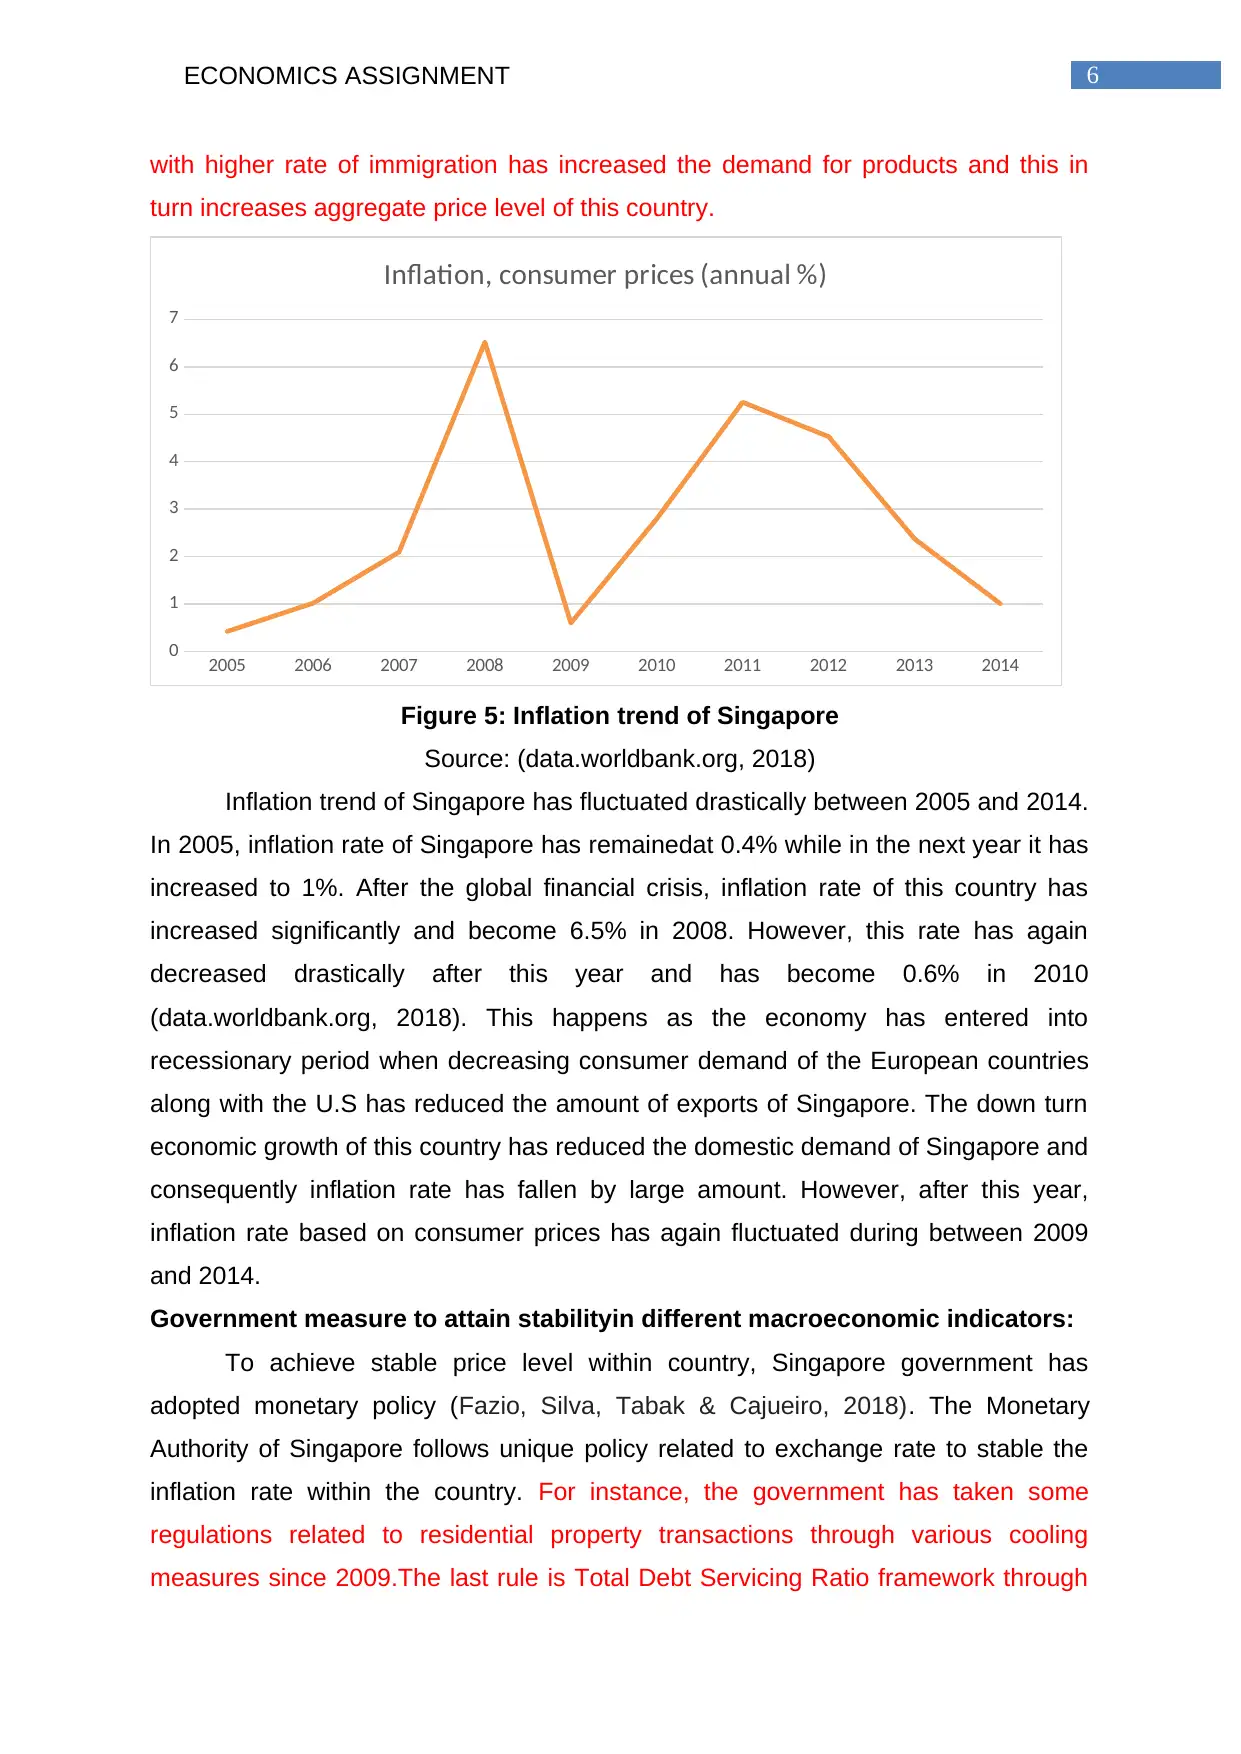
with higher rate of immigration has increased the demand for products and this in
turn increases aggregate price level of this country.
2005 2006 2007 2008 2009 2010 2011 2012 2013 2014
0
1
2
3
4
5
6
7
Inflation, consumer prices (annual %)
Figure 5: Inflation trend of Singapore
Source: (data.worldbank.org, 2018)
Inflation trend of Singapore has fluctuated drastically between 2005 and 2014.
In 2005, inflation rate of Singapore has remainedat 0.4% while in the next year it has
increased to 1%. After the global financial crisis, inflation rate of this country has
increased significantly and become 6.5% in 2008. However, this rate has again
decreased drastically after this year and has become 0.6% in 2010
(data.worldbank.org, 2018). This happens as the economy has entered into
recessionary period when decreasing consumer demand of the European countries
along with the U.S has reduced the amount of exports of Singapore. The down turn
economic growth of this country has reduced the domestic demand of Singapore and
consequently inflation rate has fallen by large amount. However, after this year,
inflation rate based on consumer prices has again fluctuated during between 2009
and 2014.
Government measure to attain stabilityin different macroeconomic indicators:
To achieve stable price level within country, Singapore government has
adopted monetary policy (Fazio, Silva, Tabak & Cajueiro, 2018). The Monetary
Authority of Singapore follows unique policy related to exchange rate to stable the
inflation rate within the country. For instance, the government has taken some
regulations related to residential property transactions through various cooling
measures since 2009.The last rule is Total Debt Servicing Ratio framework through
Paraphrase This Document
Need a fresh take? Get an instant paraphrase of this document with our AI Paraphraser
7ECONOMICS ASSIGNMENT
which the monetary authority has restricted financial institutions from lending a
person, who has more than 60% debt repayment. Moreover, the government has
also increased the amount of down payment at the time of car purchase.
To achieve full employment, the government of Singapore has adopted
expansionary monetary policy, supply side policies to control cyclical unemployment
(Keynes, 2018). In addition to this, the government has adopted labour policies to
reduce structural unemployment and frictional unemployment. As the job structure in
Singapore has changed, demand for new and skilled workers have been increased.
For this, proper modular courses are implemented to train workers. Moreover, new
jobs are created through businesses and investments to expand existing business.
Finding replacement works for workers, who have lost their jobs, are other important
issue that the government has intended to solve. In addition to this, minimum wage
theory has been utilised by the government so as to entice the labour market and
reduce the rate of unemployment. With the governmental fiscal expenditure growth
and reformation in the economy post GFC has aided the economy to become where
it is now.
Conclusion:
In conclusion, it can be said that Singapore economy has earned significance
importance within the South East Asian region with its rising importance and trading
potential. Though GFChas affected the country adversely and for this GDP growth
rate has fluctuated drastically during 2005 and 2014, yet with robust domestic
economy, it has survived the same swiftly. GDP per capita over the successive years
has increased and performed efficiently so as to provide a healthy standard of living
to the citizens. Unemployment has decreased for the same period while inflation rate
has fluctuated by large extend.In this country, cyclical employment has occurred due
to fall in oil and gas prices in global market; however,structural unemployment can
be seen as well. Minimum wage practice from the government has helped to provide
boost to the labour market and per capita income has also increased. To conclude, it
can be stated that the performance of the Singaporean economy is stable as of now,
however, it has potential to grow much bigger compared to its present situation with
the rise in the trading with countries like China, India, US, And European Union
states.
8ECONOMICS ASSIGNMENT
References:
Ashraf, Q., Gershman, B., & Howitt, P. (2016). How inflation affects macroeconomic
performance: an agent-based computational investigation. Macroeconomic
dynamics, 20(2), 558-581.
Benigno, P., Ricci, L. A., & Surico, P. (2015). Unemployment and productivity in the
long run: the role of macroeconomic volatility. Review of Economics and
Statistics, 97(3), 698-709.
Chang, A. C., & Li, P. (2018). Measurement Error in Macroeconomic Data and
Economics Research: Data Revisions, Gross Domestic Product, and Gross
Domestic Income. Economic Inquiry, 56(3), 1846-1869.
Chang, S., Gupta, R., & Miller, S. M. (2018). Causality between per capita real gdp
and income inequality in the US: Evidence from a wavelet analysis. Social
Indicators Research, 135(1), 269-289.
Eudelle, P., & Shrestha, A. (2017). Foreign Direct Investment and Economic Growth:
The Cases of Singapore and Oman. Global Policy, 8(3), 402-405.
Fazio, D. M., Silva, T. C., Tabak, B. M., & Cajueiro, D. O. (2018). Inflation Targeting
and Financial Stability: does the quality of institutions matter?. Economic
Modelling, 71, 1-15.
Feldstein, M. (2017). Underestimating the real growth of GDP, personal income, and
productivity. Journal of Economic Perspectives, 31(2), 145-64.
GDP growth (annual %) | Data. (2018). Retrieved from
https://data.worldbank.org/indicator/NY.GDP.MKTP.KD.ZG?
end=2014&locations=SG&start=2005
GDP per capita (current US$) | Data. (2018). Retrieved from
https://data.worldbank.org/indicator/NY.GDP.PCAP.CD?
end=2014&locations=SG-AU&start=2005
Hornidge, A. K., & Kurfürst, S. (2015). Envisioning the Future. Negotiating Public
Space in Hanoi and Singapore. Internationales Asienforum, 42(3-4), 345-369.
Isik, C., Dogru, T., & Turk, E. S. (2018). A nexus of linear and non ‐linear
relationships between tourism demand, renewable energy consumption, and
economic growth: Theory and evidence. International Journal of Tourism
Research, 20(1), 38-49.
Keynes, J. M. (2018). The general theory of employment, interest, and money.
Springer.
⊘ This is a preview!⊘
Do you want full access?
Subscribe today to unlock all pages.
Trusted by 1+ million students worldwide
9ECONOMICS ASSIGNMENT
Petrosky-Nadeau, N., & Wasmer, E. (2017). Labor, Credit, and Goods Markets: The
Macroeconomics of Search and Unemployment. MIT Press.
Unemployment, total (% of total labor force) (modeled ILO estimate) | Data. (2018).
Retrieved from https://data.worldbank.org/indicator/SL.UEM.TOTL.ZS?
end=2014&locations=SG&start=2005
1 out of 10