Economics and Quantitative Analysis: Assignment Solution - Semester 1
VerifiedAdded on 2022/12/14
|8
|1065
|496
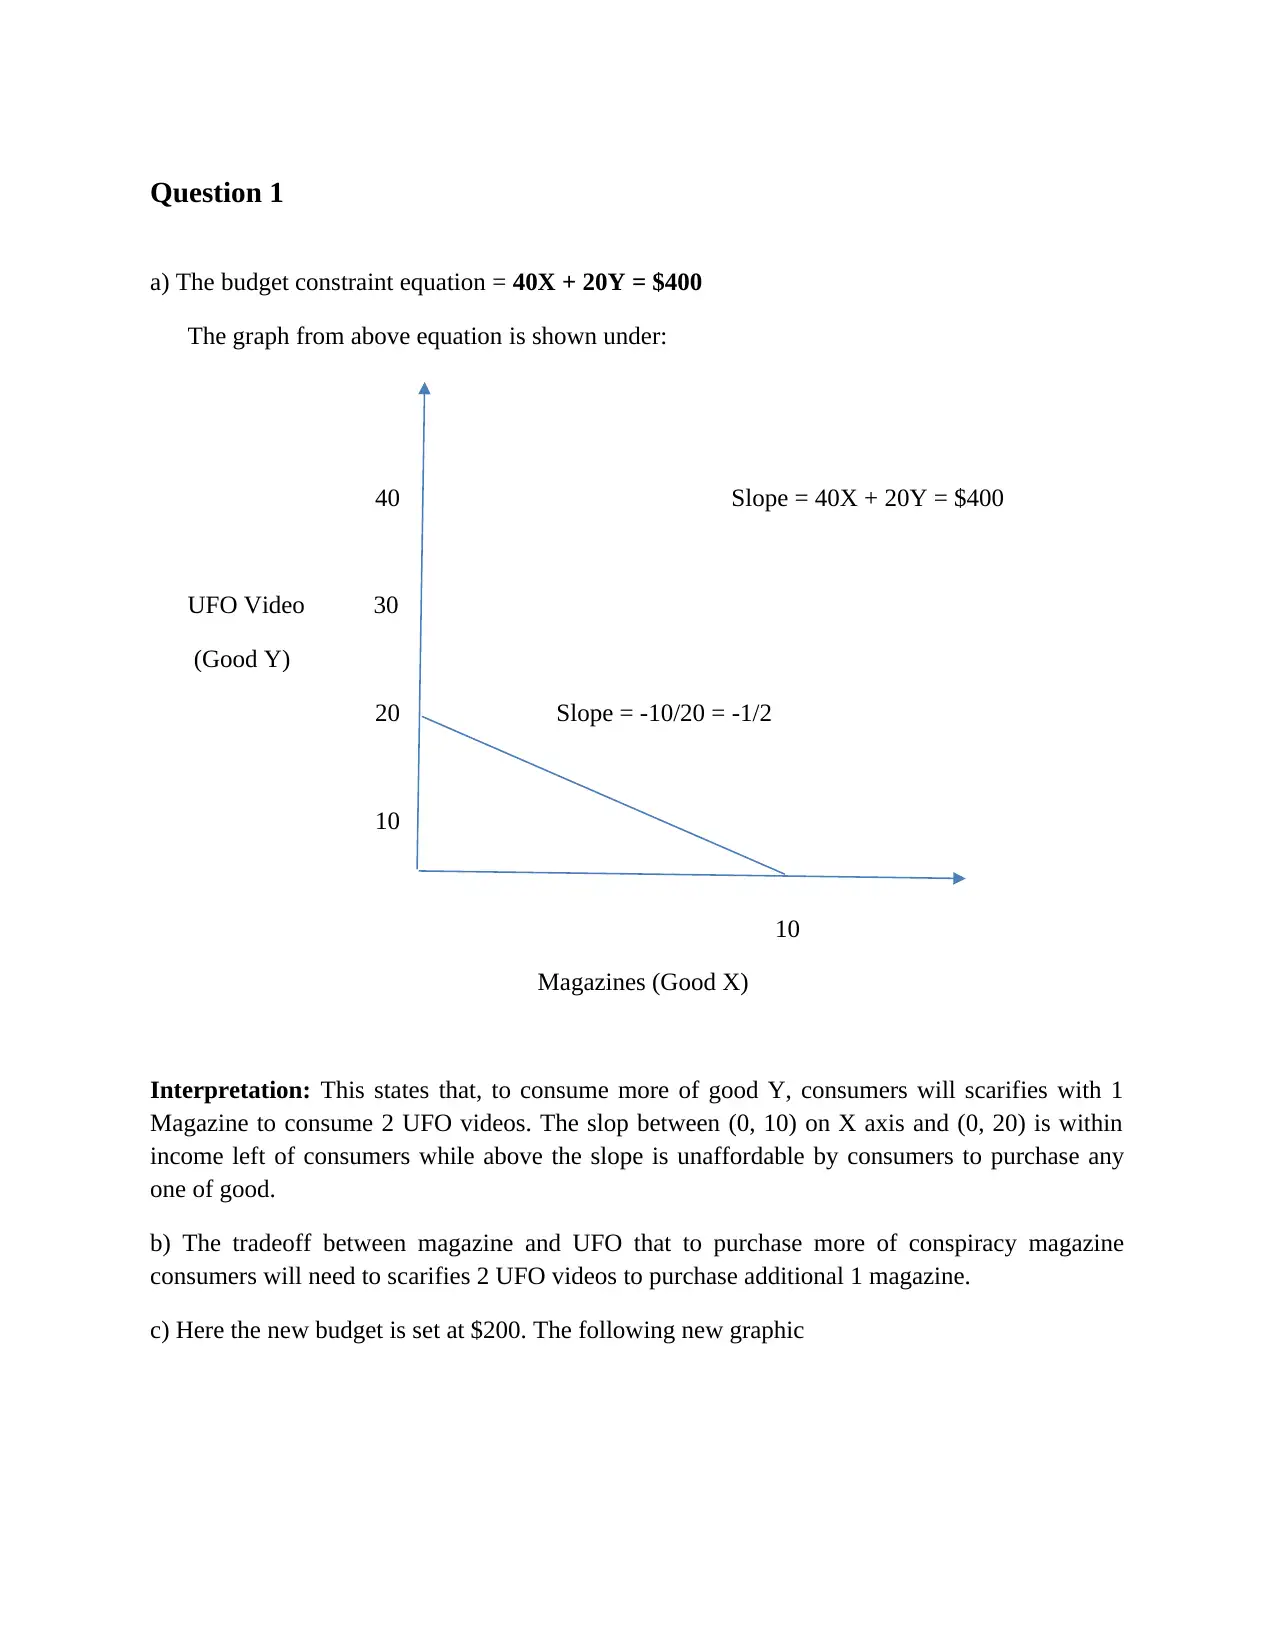
Homework Assignment
AI Summary
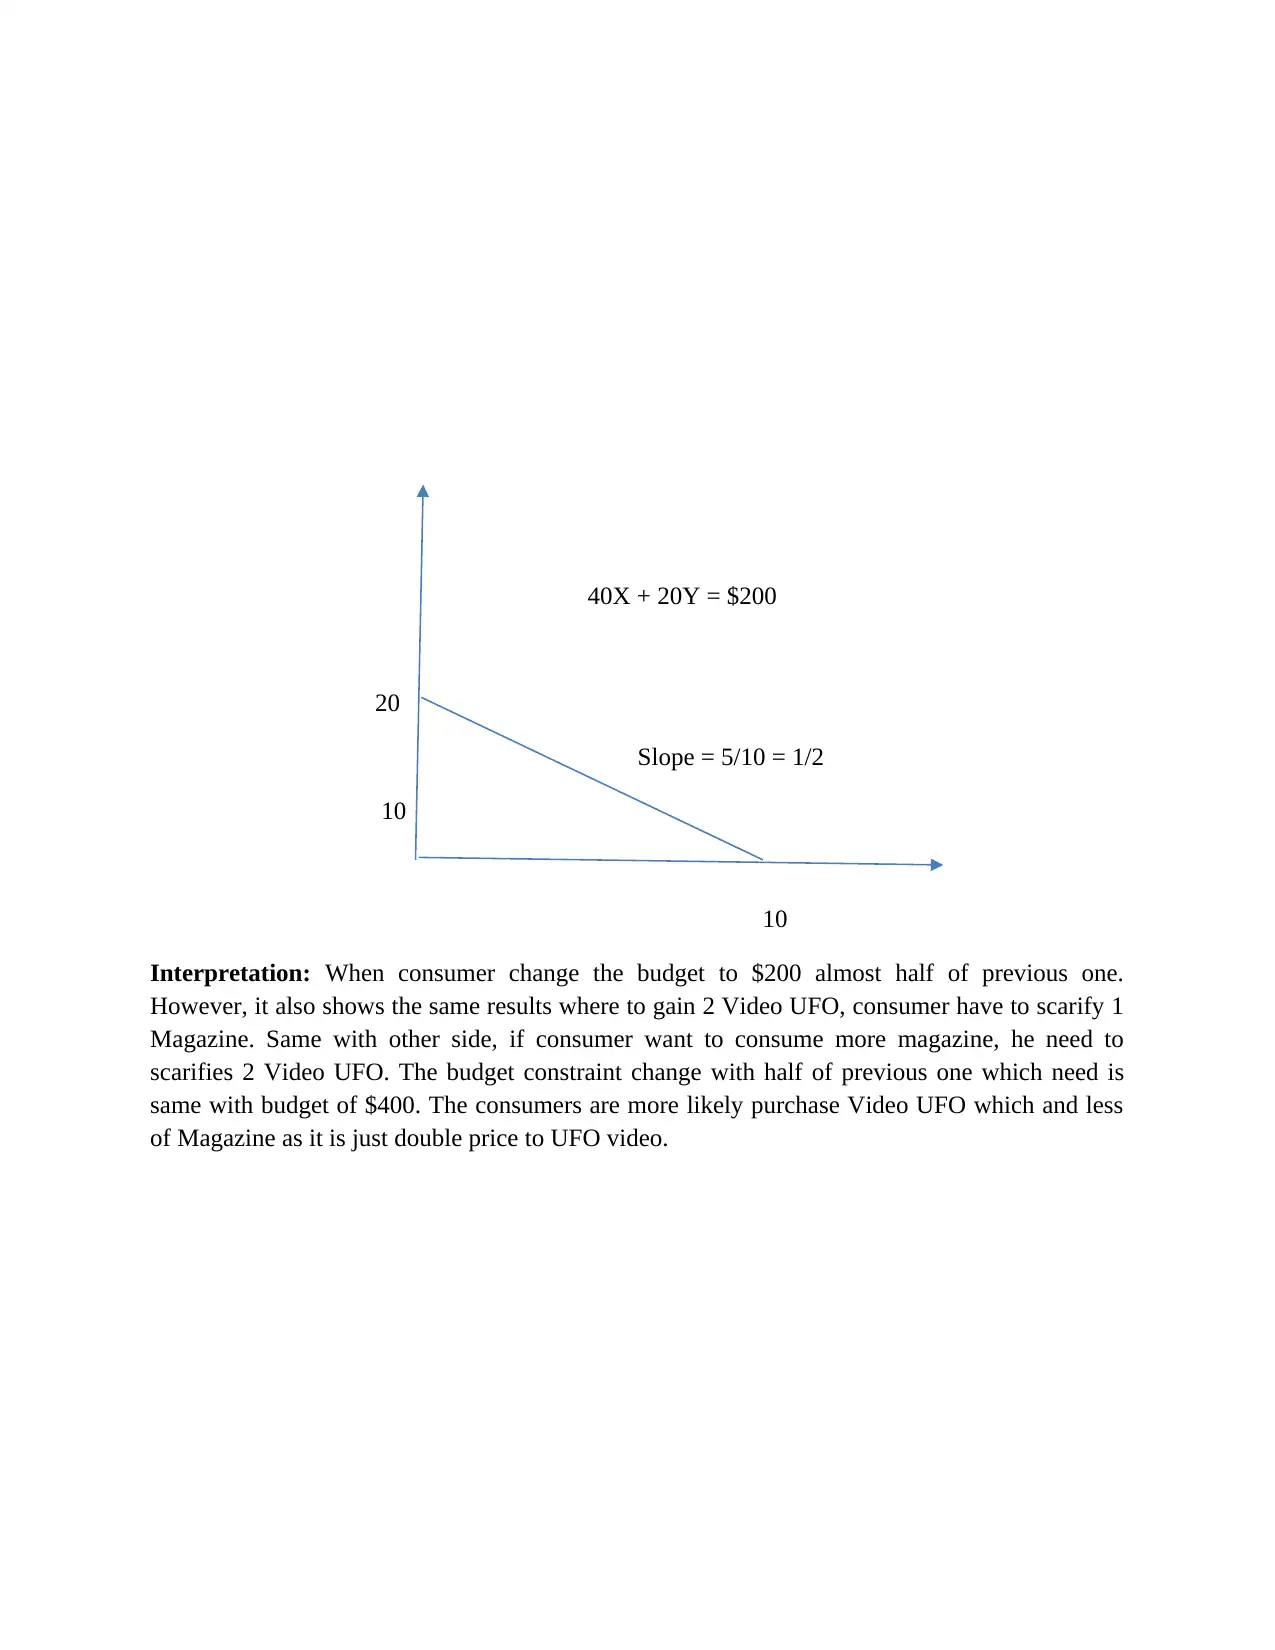
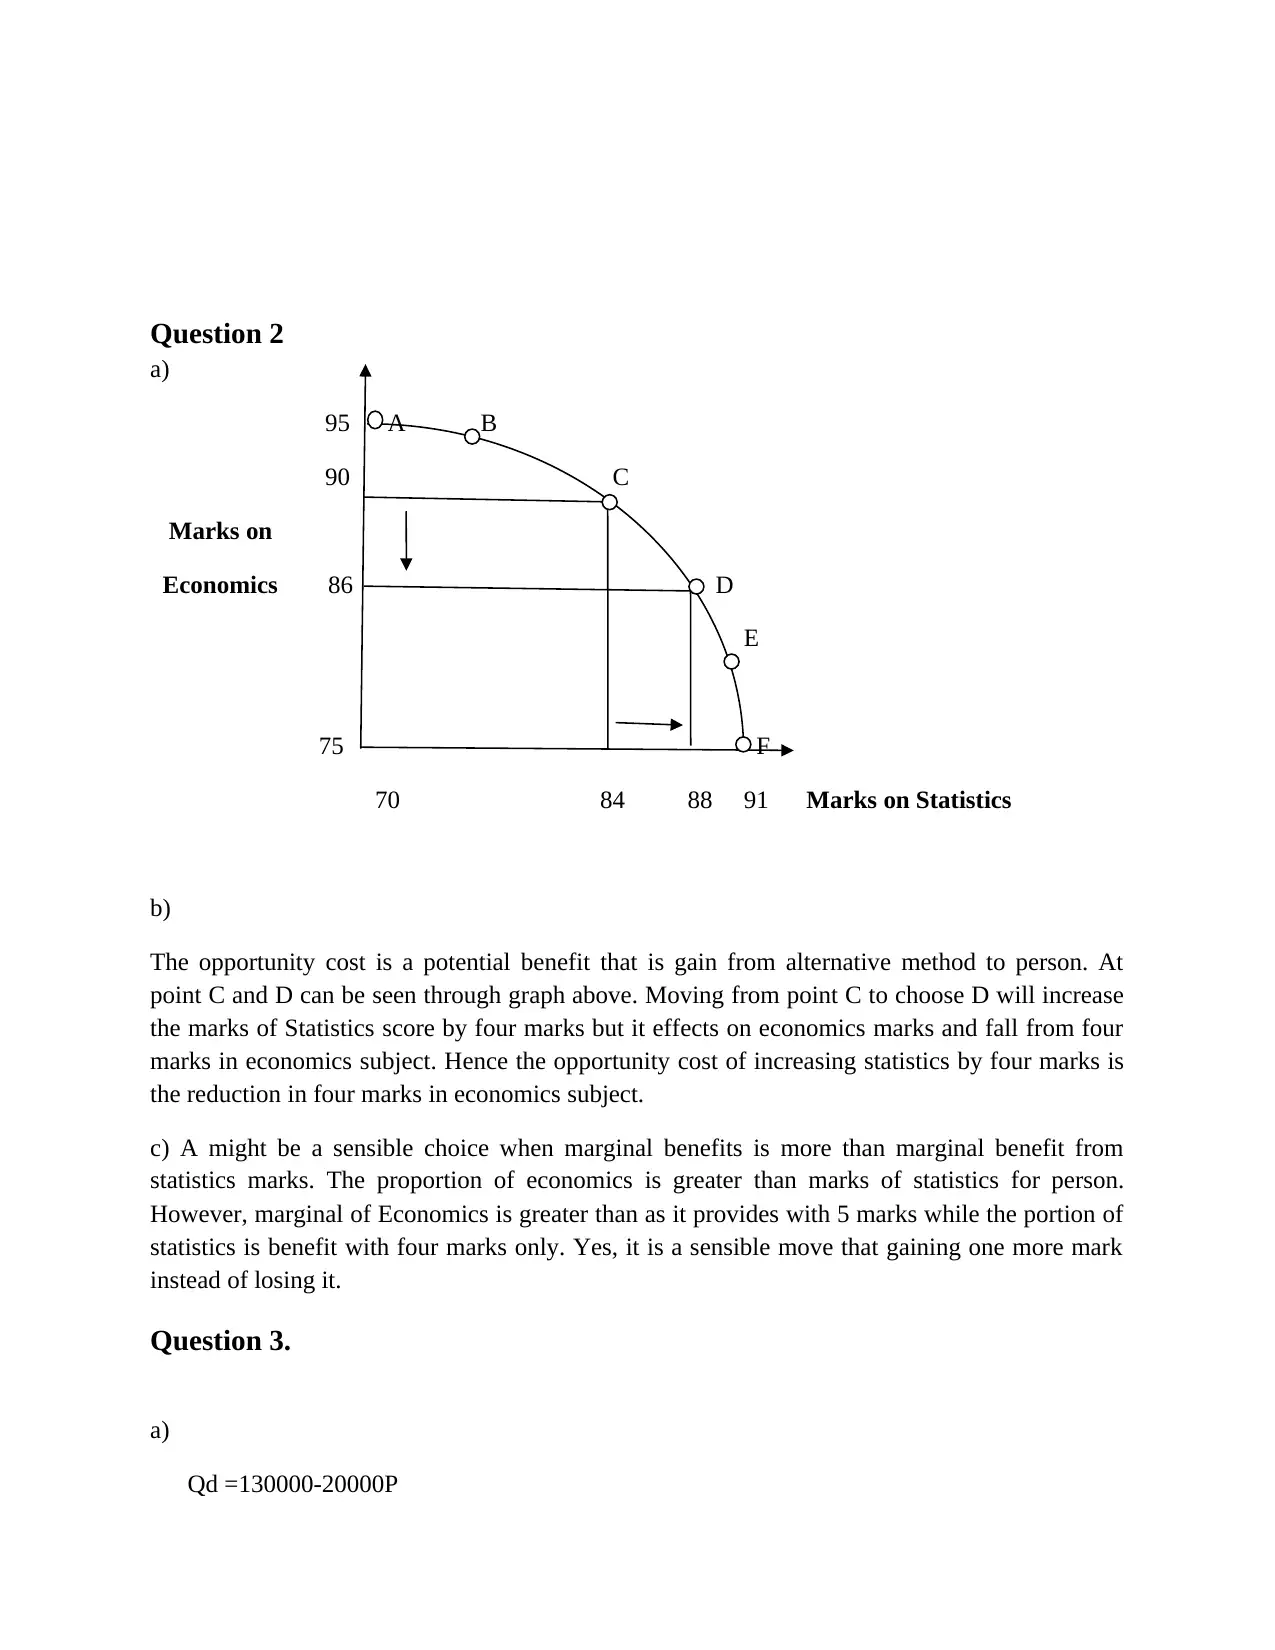
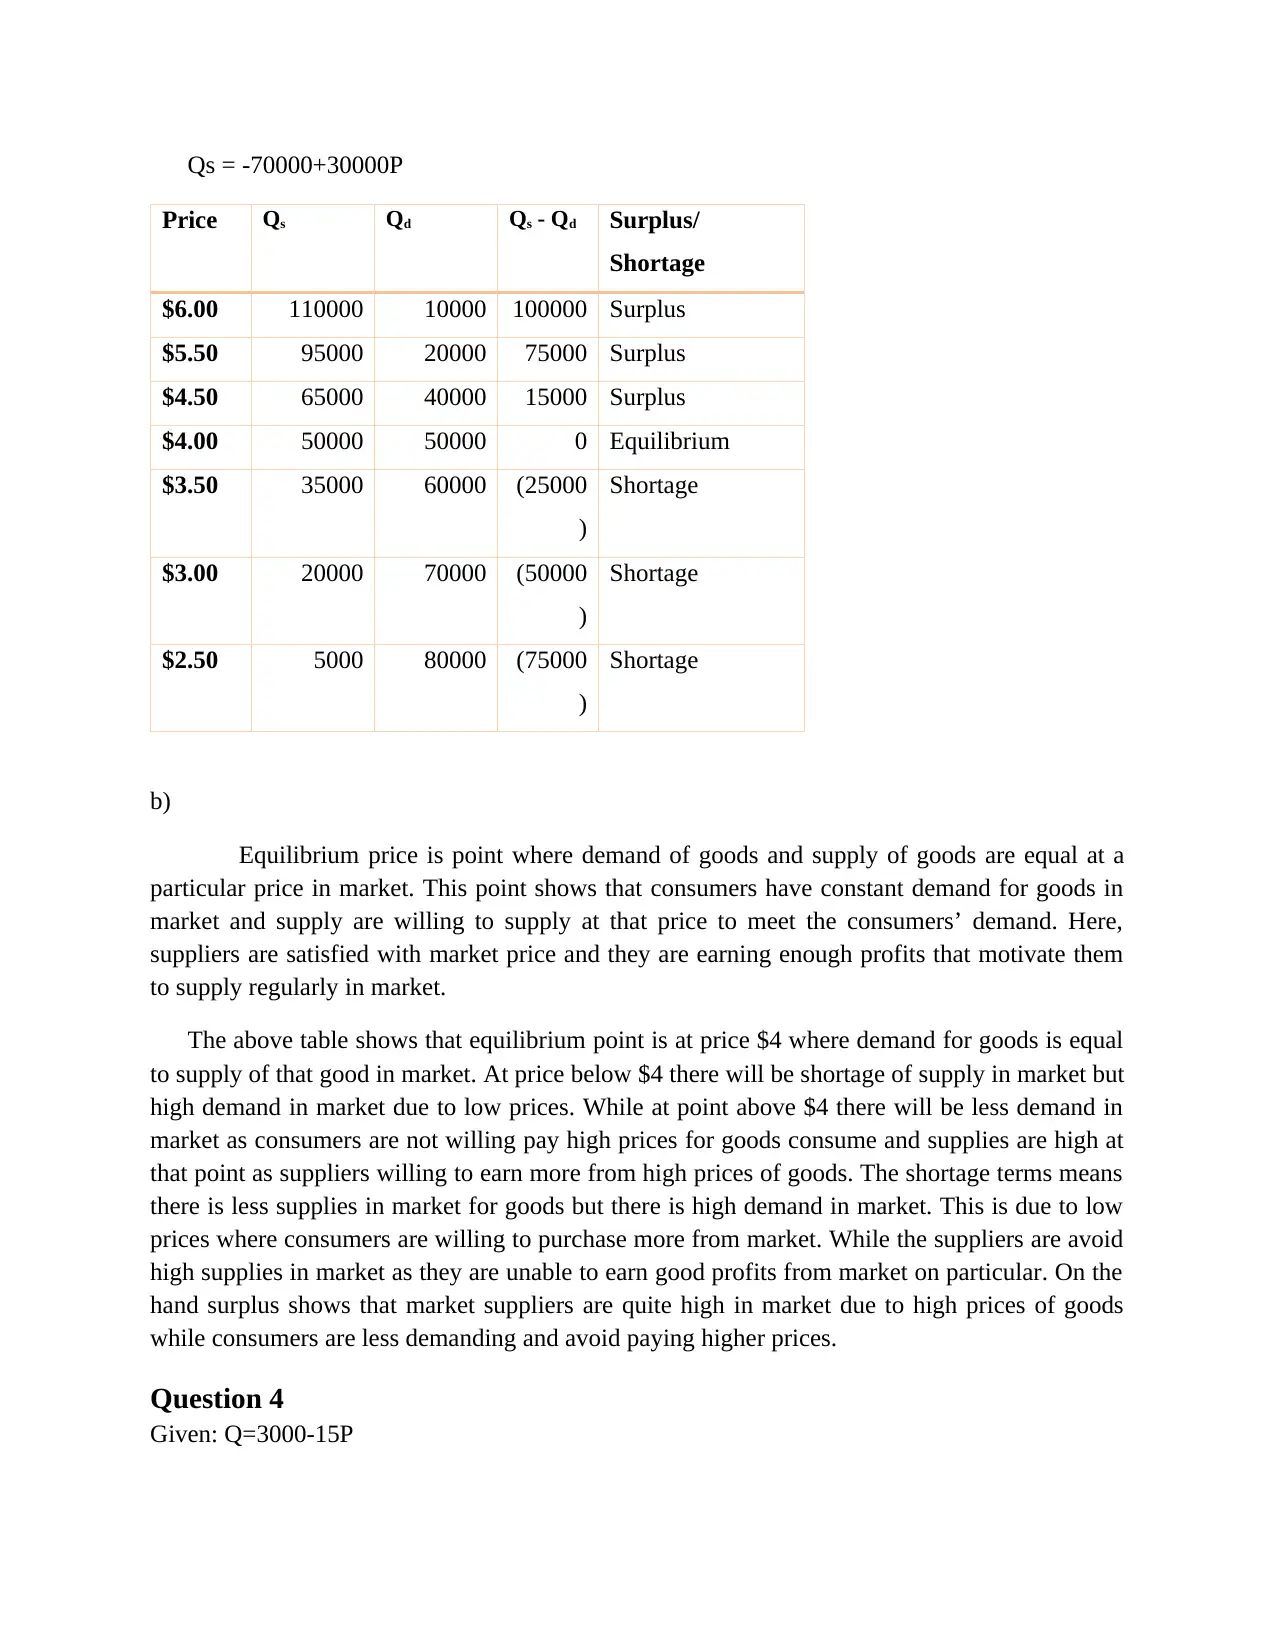
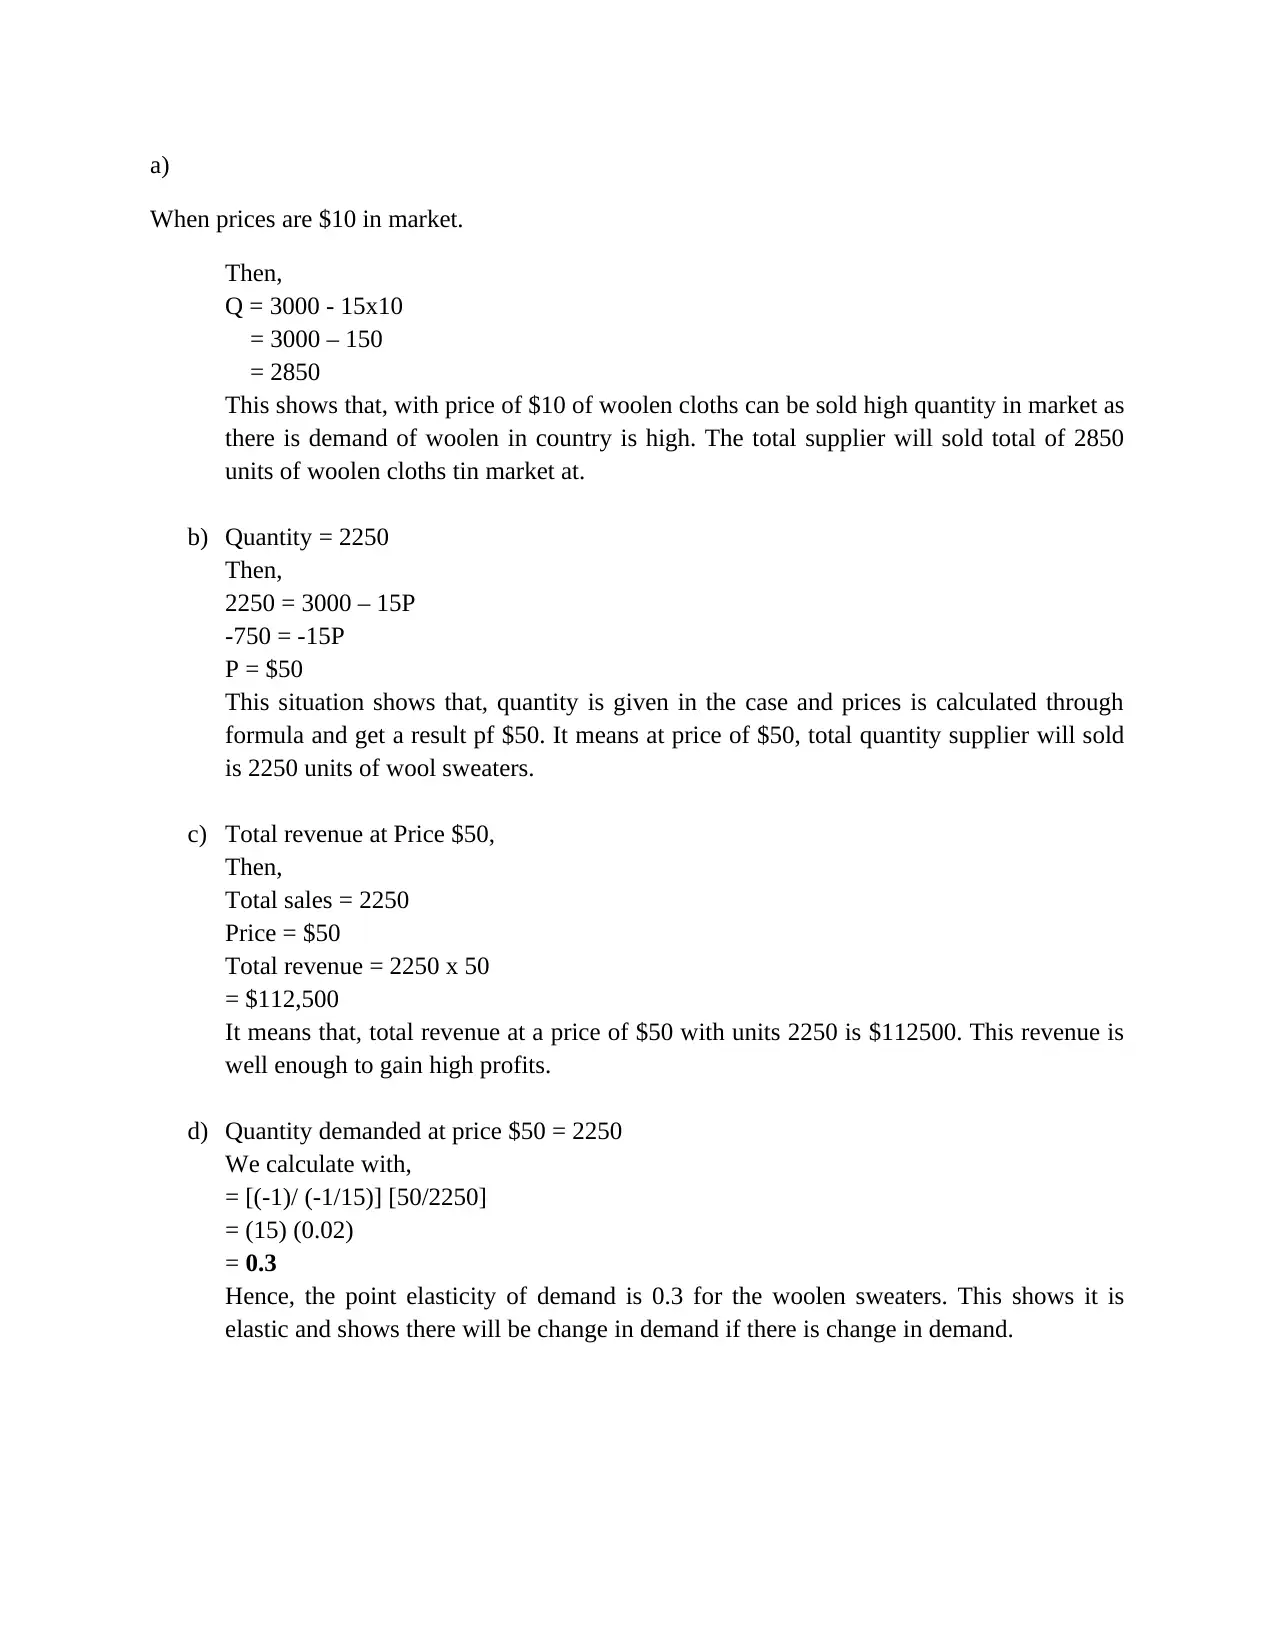
This document presents a comprehensive solution to an economics and quantitative analysis assignment. The solution includes detailed answers to questions on budget constraints, opportunity cost, supply and demand, and price elasticity of demand. Question 1 explores budget constraints, illustrating the trade-offs consumers face when making purchasing decisions with a limited budget and analyzing the impact of budget changes. Question 2 examines opportunity cost using a graph, demonstrating the trade-offs between marks in economics and statistics. Question 3 delves into supply and demand, calculating equilibrium price and analyzing market shortages and surpluses. Finally, Question 4 focuses on demand equations and elasticity, calculating quantity demanded, total revenue, and the point elasticity of demand for a product. The assignment covers important economic concepts and provides a detailed, step-by-step solution for students to understand the concepts.


1 out of 8
Your All-in-One AI-Powered Toolkit for Academic Success.
+13062052269
info@desklib.com
Available 24*7 on WhatsApp / Email
![[object Object]](/_next/static/media/star-bottom.7253800d.svg)
Copyright © 2020–2025 A2Z Services. All Rights Reserved. Developed and managed by ZUCOL.