Analysis of Australian Economic Performance: 2012-2017 (Economics)
VerifiedAdded on 2021/06/16
|21
|3736
|31
Report
AI Summary
This report provides a detailed analysis of Australia's economic performance from 2012 to 2017. It examines key macroeconomic indicators, including Gross Domestic Product (GDP) and its growth rates, inflation rates, unemployment rates, and consumption expenditure. The report explores the dynamics of these indicators, highlighting fluctuations and trends over the five-year period. Furthermore, it delves into the policy framework that has shaped Australia's economic landscape and discusses industrial growth, particularly the reasons behind the service sector's expansion. The analysis offers insights into Australia's economic stability and growth in the context of global economic dynamics.
Running head: ECONOMICS ASSIGNMENT
Economics Assignment
Name of the Student
Name of the University
Author Note
Economics Assignment
Name of the Student
Name of the University
Author Note
Paraphrase This Document
Need a fresh take? Get an instant paraphrase of this document with our AI Paraphraser
1ECONOMICS ASSIGNMENT
Table of Contents
Introduction................................................................................................................................2
Australia: Economic Overview..................................................................................................3
Australian economic trends in the last five years (2012-2017)..................................................4
Dynamics in the Gross Domestic Product and its growth rates in Australia (2012-2017)....4
Rate of Inflation in Australia over the last five years............................................................7
Unemployment Rate in the last five years.............................................................................9
Consumption expenditure....................................................................................................10
Economic Interpretation.......................................................................................................11
Policy Framework....................................................................................................................11
Industrial Growth (2012-2017)................................................................................................14
Reasons for service sector growth........................................................................................15
Conclusion................................................................................................................................16
References................................................................................................................................18
2ECONOMICS ASSIGNMENT
Introduction
In the last few decades, the global economic scenario has experienced huge
development and dynamics in its domain which can be attributed to the growth and
modifications of the economies of the different countries as well as to the international
phenomena of immense significance like that of Globalization, trade liberalizations, industrial
and technological innovations and others, which in turn has led to the increase in the
inclusion and integration as well as connectivity of the different economies across the globe
with time1.
Over the years, different economies have emerged as influencing and globally
dominating economies and many lost their positions as globally dominant economies over
time. However, there have always been several economies in the global economic scenario,
who have maintained their economic growth and prosperity consistently, despite discrete
fluctuations and dynamics2. Australia has been one such globally dominant economies, which
have over the years developed impressively, showing positive and robust performance in
almost all the economic indicators and a high growth trend in the economy as a whole, much
of which can be attributed to the increasing growth of industrial and commercial prospects,
the country’s robust economic ties with other major countries across the globe and the stable
and robust government and policy framework which has over the years contributed in
developing the country as a whole3.
In this context, the concerned report tries to explore and study the economic trends
and the overall performance of the economy of Australia in the last five years, that is in the
period of 2012-2017, taking into account the fact that in the contemporary period the country
1 Mander, Jerry, ed. The case against the global economy: and for a turn towards localization. Routledge, 2014.
2 Mosco, Vincent. "Political Economy." The Routledge Companion to Global Popular Culture. Routledge, 2014.
35-44.
3 Dyster, Barrie, and David Meredith. Australia in the global economy: continuity and change. Cambridge
University Press, 2012.
⊘ This is a preview!⊘
Do you want full access?
Subscribe today to unlock all pages.
Trusted by 1+ million students worldwide
3ECONOMICS ASSIGNMENT
has experienced considerable fluctuations in the economic domain due to both endogenous
activities as well as exogenous factors happening outside the economy itself but having
considerable impacts on the economy. The report tries to observe the dynamics in the major
macroeconomic parameters in the country during the concerned period and also tries to
analyse the policy framework present in the country in this respect. Apart from that the report
discusses the industrial shifts and industries which have been growing in the contemporary
period, thereby exploring the reasons behind the growth of the same.
Australia: Economic Overview
As discussed above, the economy of Australia is an example of a highly developed
and visibly stable and probably the largest mixed economy in the global scenario. The
country, ranking fourth globally in terms of Nominal GDP and second in terms of total
wealth of the adult population, is known for its gradual growth and visible stability which in
turn have contributed to the industrial development and the economic prosperity of the
country4. The country has enjoyed the status of a mining and technological giant in the global
framework for decades and has developed huge multi-lateral and prosperous long-term trade
and commerce relationships with all parts of the globe which has also contributed to the
increasing development of the economy.
Keeping this into consideration, the following section of the report tries to analyse and
interpret the dynamics which the economy of the country has been experiencing in the last
five years, by observing the trends in the performance of the major economic indicators of the
country.
4 Groenewegen, Peter, and Bruce McFarlane. A History of Australian Economic Thought (Routledge Revivals).
Routledge, 2014.
Paraphrase This Document
Need a fresh take? Get an instant paraphrase of this document with our AI Paraphraser
4ECONOMICS ASSIGNMENT
Australian economic trends in the last five years (2012-2017)
The economic growth and performance of a country can be measured and analysing
the trends or movements of some macroeconomic indicators of immense significance for the
economy, which primarily include the indicators like GDP, inflation, unemployment and
others. These indicators and their dynamics collectively as well as individually reflect the
how well the economy in consideration is performing.
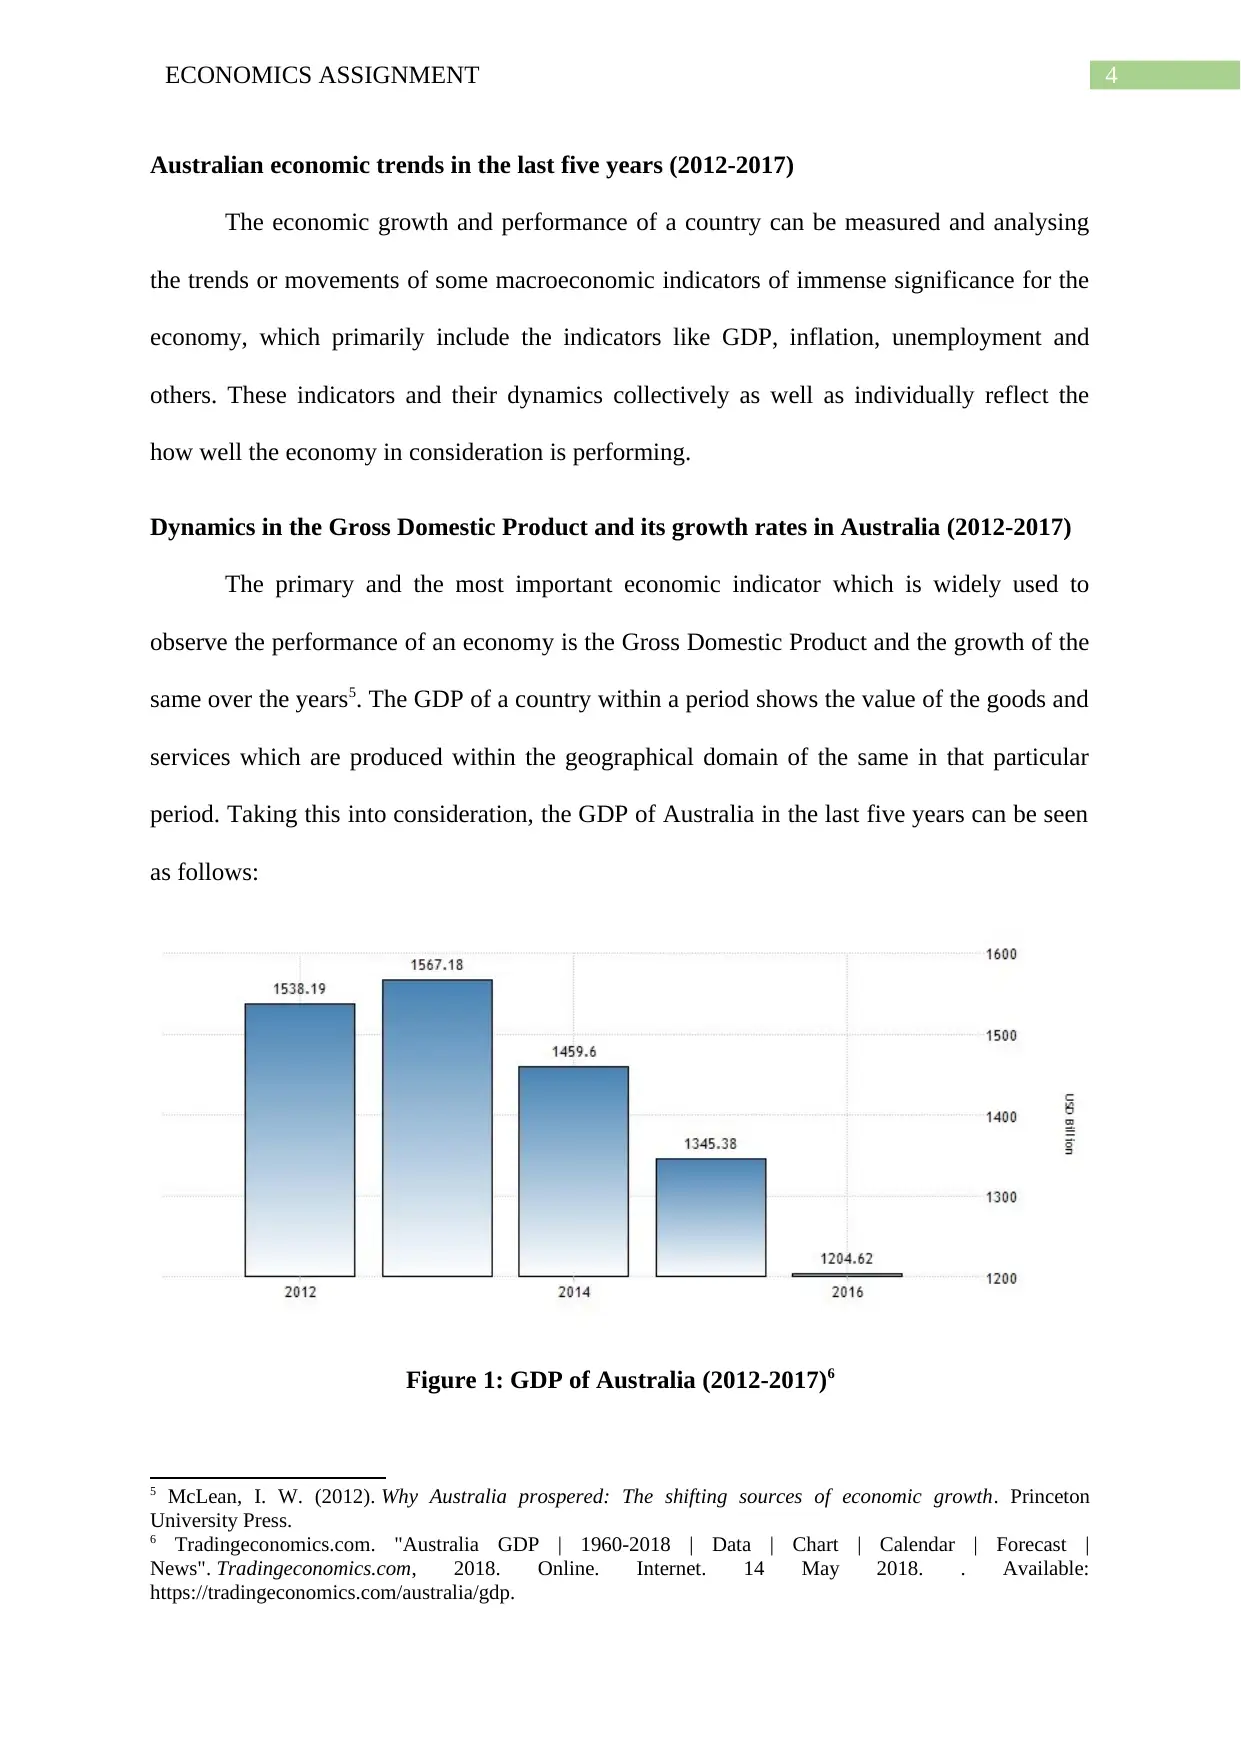
Dynamics in the Gross Domestic Product and its growth rates in Australia (2012-2017)
The primary and the most important economic indicator which is widely used to
observe the performance of an economy is the Gross Domestic Product and the growth of the
same over the years5. The GDP of a country within a period shows the value of the goods and
services which are produced within the geographical domain of the same in that particular
period. Taking this into consideration, the GDP of Australia in the last five years can be seen
as follows:
Figure 1: GDP of Australia (2012-2017)6
5 McLean, I. W. (2012). Why Australia prospered: The shifting sources of economic growth. Princeton
University Press.
6 Tradingeconomics.com. "Australia GDP | 1960-2018 | Data | Chart | Calendar | Forecast |
News". Tradingeconomics.com, 2018. Online. Internet. 14 May 2018. . Available:
https://tradingeconomics.com/australia/gdp.
Australian economic trends in the last five years (2012-2017)
The economic growth and performance of a country can be measured and analysing
the trends or movements of some macroeconomic indicators of immense significance for the
economy, which primarily include the indicators like GDP, inflation, unemployment and
others. These indicators and their dynamics collectively as well as individually reflect the
how well the economy in consideration is performing.
Dynamics in the Gross Domestic Product and its growth rates in Australia (2012-2017)
The primary and the most important economic indicator which is widely used to
observe the performance of an economy is the Gross Domestic Product and the growth of the
same over the years5. The GDP of a country within a period shows the value of the goods and
services which are produced within the geographical domain of the same in that particular
period. Taking this into consideration, the GDP of Australia in the last five years can be seen
as follows:
Figure 1: GDP of Australia (2012-2017)6
5 McLean, I. W. (2012). Why Australia prospered: The shifting sources of economic growth. Princeton
University Press.
6 Tradingeconomics.com. "Australia GDP | 1960-2018 | Data | Chart | Calendar | Forecast |
News". Tradingeconomics.com, 2018. Online. Internet. 14 May 2018. . Available:
https://tradingeconomics.com/australia/gdp.
5ECONOMICS ASSIGNMENT
In spite of the considerable stability in the economic growth of the country over the
years, in the last few years, the GDP of the country is surprisingly found to be decreasing
gradually. In the last five years, the GDP of the country decreased from 1538 billion to
almost 1204 billion which is quite unusual for the country, given the fact that the country had
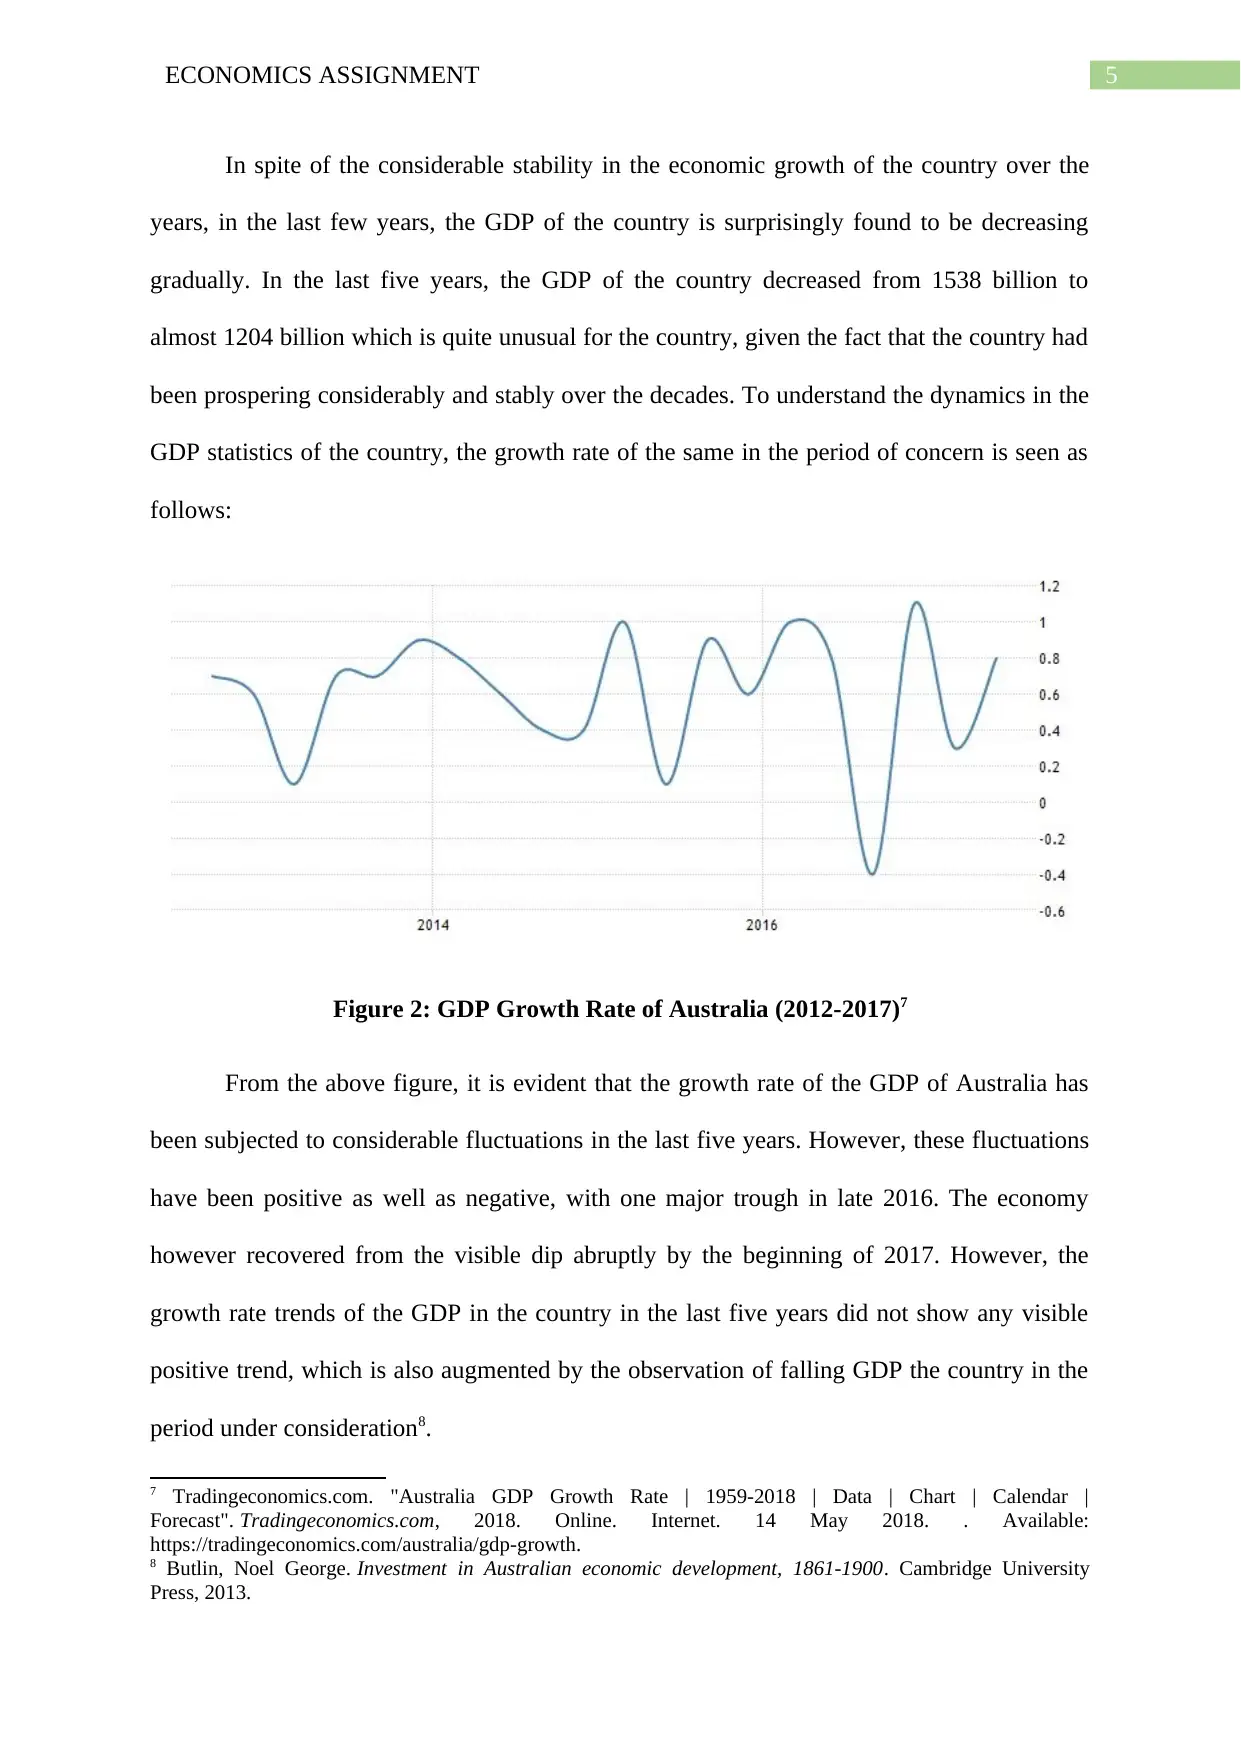
been prospering considerably and stably over the decades. To understand the dynamics in the
GDP statistics of the country, the growth rate of the same in the period of concern is seen as
follows:
Figure 2: GDP Growth Rate of Australia (2012-2017)7
From the above figure, it is evident that the growth rate of the GDP of Australia has
been subjected to considerable fluctuations in the last five years. However, these fluctuations
have been positive as well as negative, with one major trough in late 2016. The economy
however recovered from the visible dip abruptly by the beginning of 2017. However, the
growth rate trends of the GDP in the country in the last five years did not show any visible
positive trend, which is also augmented by the observation of falling GDP the country in the
period under consideration8.
7 Tradingeconomics.com. "Australia GDP Growth Rate | 1959-2018 | Data | Chart | Calendar |
Forecast". Tradingeconomics.com, 2018. Online. Internet. 14 May 2018. . Available:
https://tradingeconomics.com/australia/gdp-growth.
8 Butlin, Noel George. Investment in Australian economic development, 1861-1900. Cambridge University
Press, 2013.
In spite of the considerable stability in the economic growth of the country over the
years, in the last few years, the GDP of the country is surprisingly found to be decreasing
gradually. In the last five years, the GDP of the country decreased from 1538 billion to
almost 1204 billion which is quite unusual for the country, given the fact that the country had
been prospering considerably and stably over the decades. To understand the dynamics in the
GDP statistics of the country, the growth rate of the same in the period of concern is seen as
follows:
Figure 2: GDP Growth Rate of Australia (2012-2017)7
From the above figure, it is evident that the growth rate of the GDP of Australia has
been subjected to considerable fluctuations in the last five years. However, these fluctuations
have been positive as well as negative, with one major trough in late 2016. The economy
however recovered from the visible dip abruptly by the beginning of 2017. However, the
growth rate trends of the GDP in the country in the last five years did not show any visible
positive trend, which is also augmented by the observation of falling GDP the country in the
period under consideration8.
7 Tradingeconomics.com. "Australia GDP Growth Rate | 1959-2018 | Data | Chart | Calendar |
Forecast". Tradingeconomics.com, 2018. Online. Internet. 14 May 2018. . Available:
https://tradingeconomics.com/australia/gdp-growth.
8 Butlin, Noel George. Investment in Australian economic development, 1861-1900. Cambridge University
Press, 2013.
⊘ This is a preview!⊘
Do you want full access?
Subscribe today to unlock all pages.
Trusted by 1+ million students worldwide
6ECONOMICS ASSIGNMENT
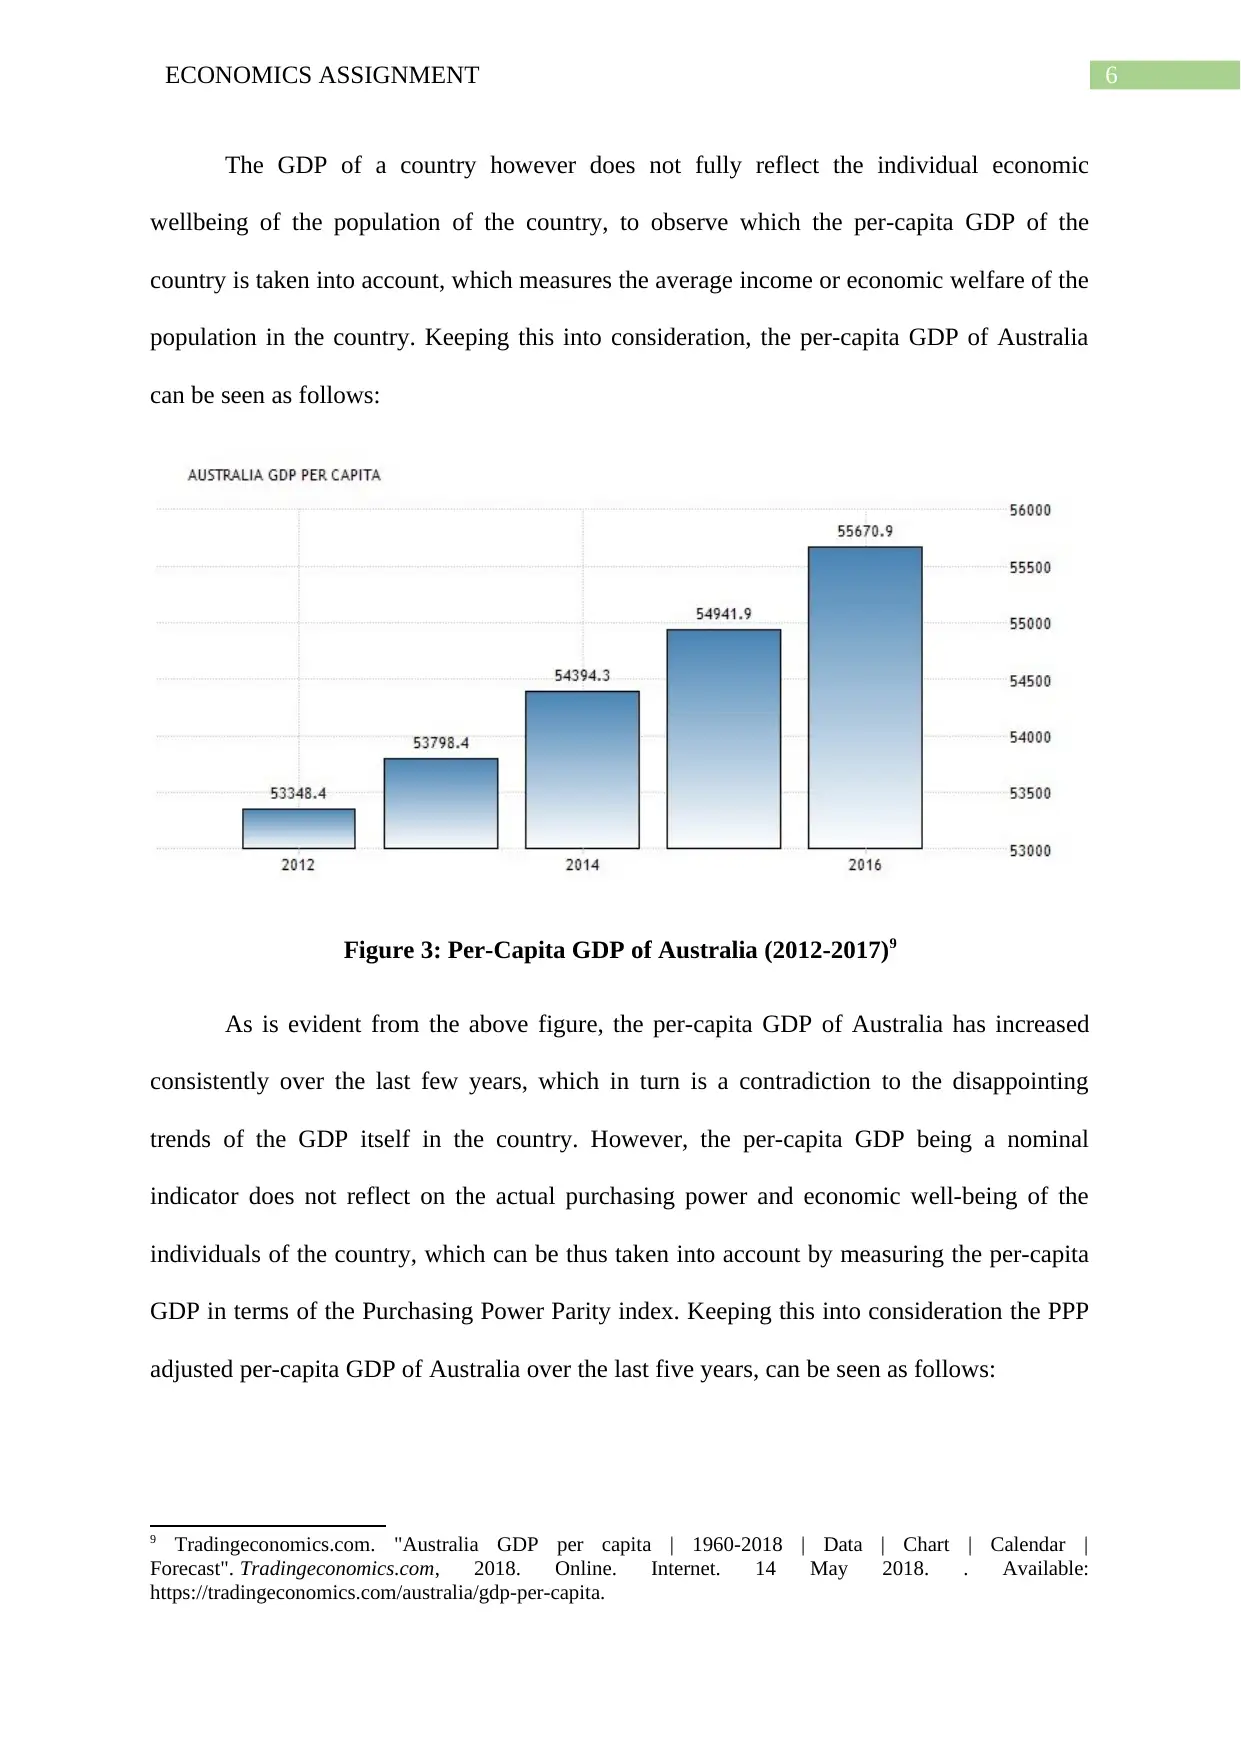
The GDP of a country however does not fully reflect the individual economic
wellbeing of the population of the country, to observe which the per-capita GDP of the
country is taken into account, which measures the average income or economic welfare of the
population in the country. Keeping this into consideration, the per-capita GDP of Australia
can be seen as follows:
Figure 3: Per-Capita GDP of Australia (2012-2017)9
As is evident from the above figure, the per-capita GDP of Australia has increased
consistently over the last few years, which in turn is a contradiction to the disappointing
trends of the GDP itself in the country. However, the per-capita GDP being a nominal
indicator does not reflect on the actual purchasing power and economic well-being of the
individuals of the country, which can be thus taken into account by measuring the per-capita
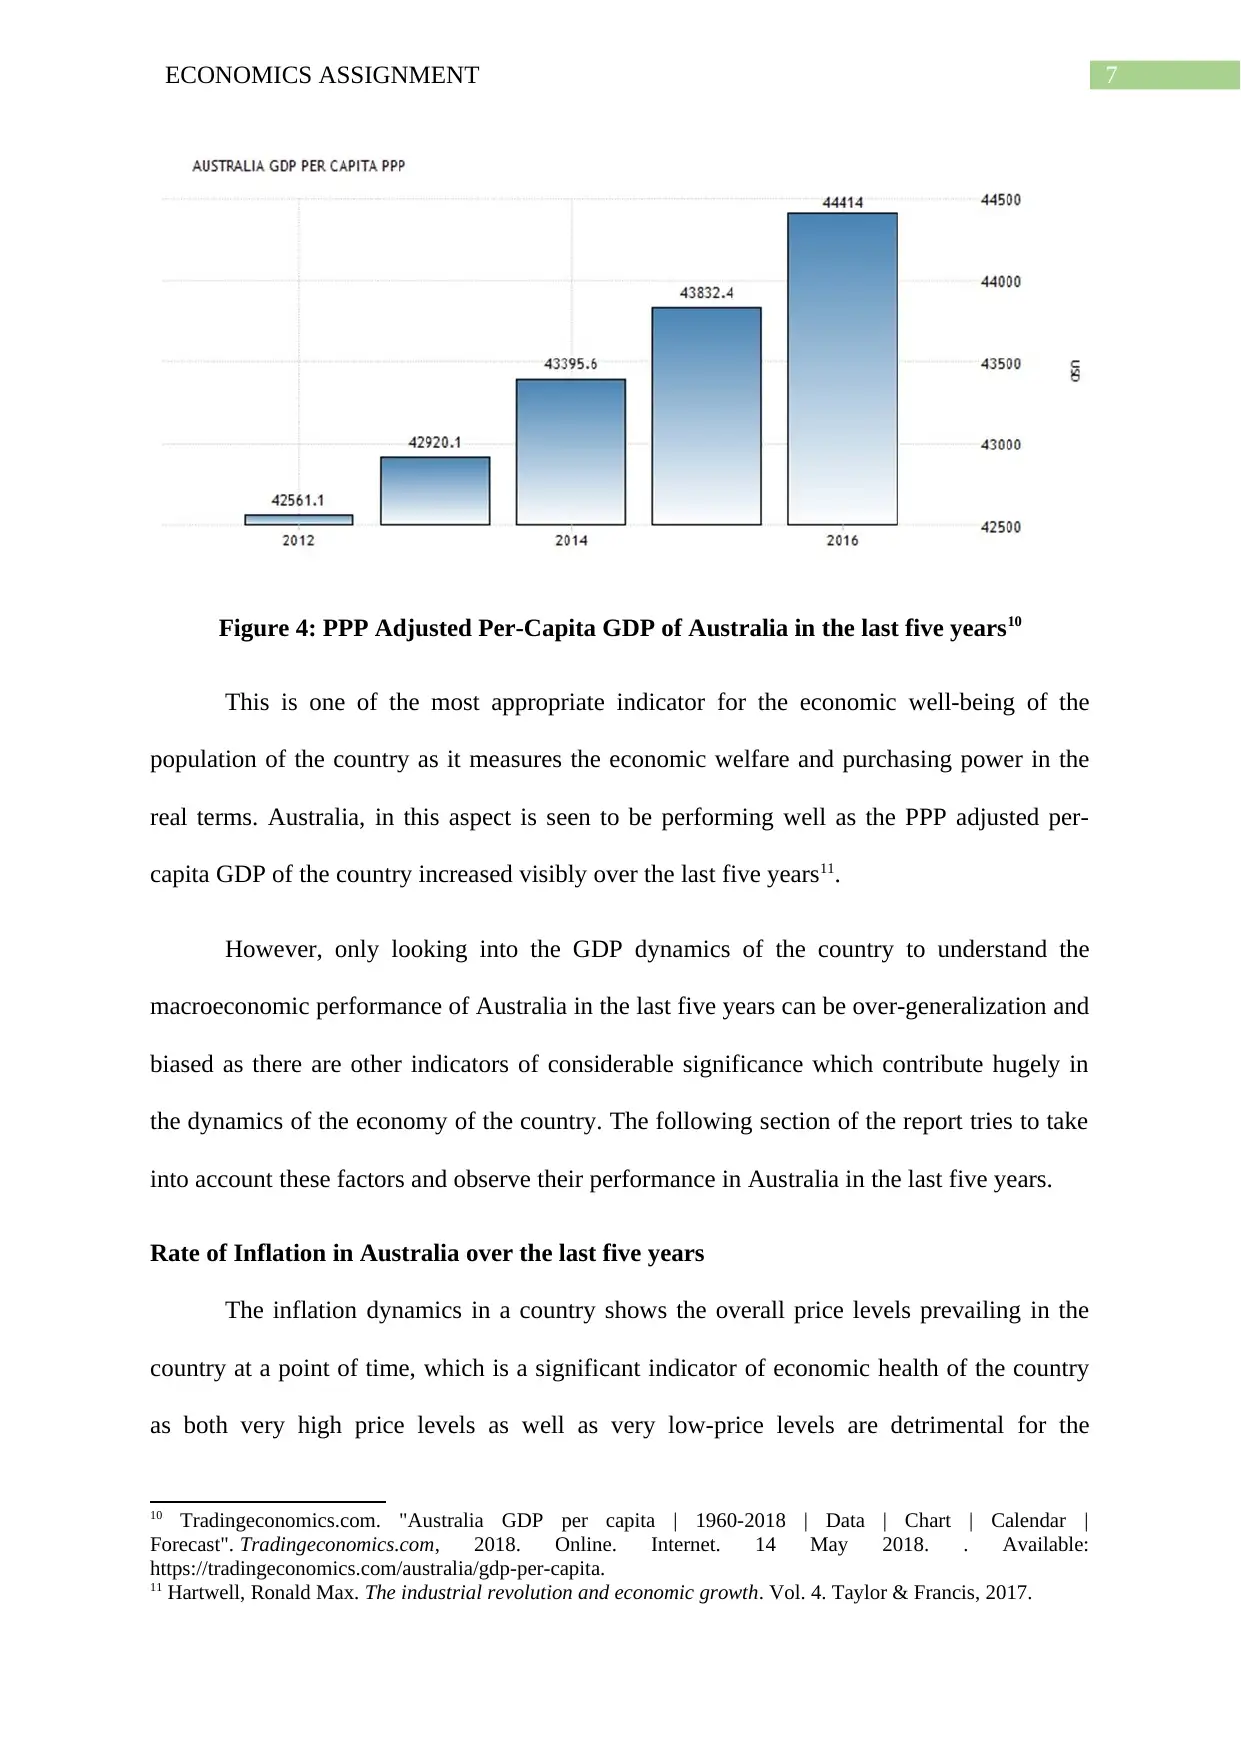
GDP in terms of the Purchasing Power Parity index. Keeping this into consideration the PPP
adjusted per-capita GDP of Australia over the last five years, can be seen as follows:
9 Tradingeconomics.com. "Australia GDP per capita | 1960-2018 | Data | Chart | Calendar |
Forecast". Tradingeconomics.com, 2018. Online. Internet. 14 May 2018. . Available:
https://tradingeconomics.com/australia/gdp-per-capita.
The GDP of a country however does not fully reflect the individual economic
wellbeing of the population of the country, to observe which the per-capita GDP of the
country is taken into account, which measures the average income or economic welfare of the
population in the country. Keeping this into consideration, the per-capita GDP of Australia
can be seen as follows:
Figure 3: Per-Capita GDP of Australia (2012-2017)9
As is evident from the above figure, the per-capita GDP of Australia has increased
consistently over the last few years, which in turn is a contradiction to the disappointing
trends of the GDP itself in the country. However, the per-capita GDP being a nominal
indicator does not reflect on the actual purchasing power and economic well-being of the
individuals of the country, which can be thus taken into account by measuring the per-capita
GDP in terms of the Purchasing Power Parity index. Keeping this into consideration the PPP
adjusted per-capita GDP of Australia over the last five years, can be seen as follows:
9 Tradingeconomics.com. "Australia GDP per capita | 1960-2018 | Data | Chart | Calendar |
Forecast". Tradingeconomics.com, 2018. Online. Internet. 14 May 2018. . Available:
https://tradingeconomics.com/australia/gdp-per-capita.
Paraphrase This Document
Need a fresh take? Get an instant paraphrase of this document with our AI Paraphraser
7ECONOMICS ASSIGNMENT
Figure 4: PPP Adjusted Per-Capita GDP of Australia in the last five years10
This is one of the most appropriate indicator for the economic well-being of the
population of the country as it measures the economic welfare and purchasing power in the
real terms. Australia, in this aspect is seen to be performing well as the PPP adjusted per-
capita GDP of the country increased visibly over the last five years11.
However, only looking into the GDP dynamics of the country to understand the
macroeconomic performance of Australia in the last five years can be over-generalization and
biased as there are other indicators of considerable significance which contribute hugely in
the dynamics of the economy of the country. The following section of the report tries to take
into account these factors and observe their performance in Australia in the last five years.
Rate of Inflation in Australia over the last five years
The inflation dynamics in a country shows the overall price levels prevailing in the
country at a point of time, which is a significant indicator of economic health of the country
as both very high price levels as well as very low-price levels are detrimental for the
10 Tradingeconomics.com. "Australia GDP per capita | 1960-2018 | Data | Chart | Calendar |
Forecast". Tradingeconomics.com, 2018. Online. Internet. 14 May 2018. . Available:
https://tradingeconomics.com/australia/gdp-per-capita.
11 Hartwell, Ronald Max. The industrial revolution and economic growth. Vol. 4. Taylor & Francis, 2017.
8ECONOMICS ASSIGNMENT
economic well-being and prosperity of the population of the country. While a very high price
level can lead to lack of purchasing power of the consumers a very low level of price can lead
to lack of production and economic stagnation.
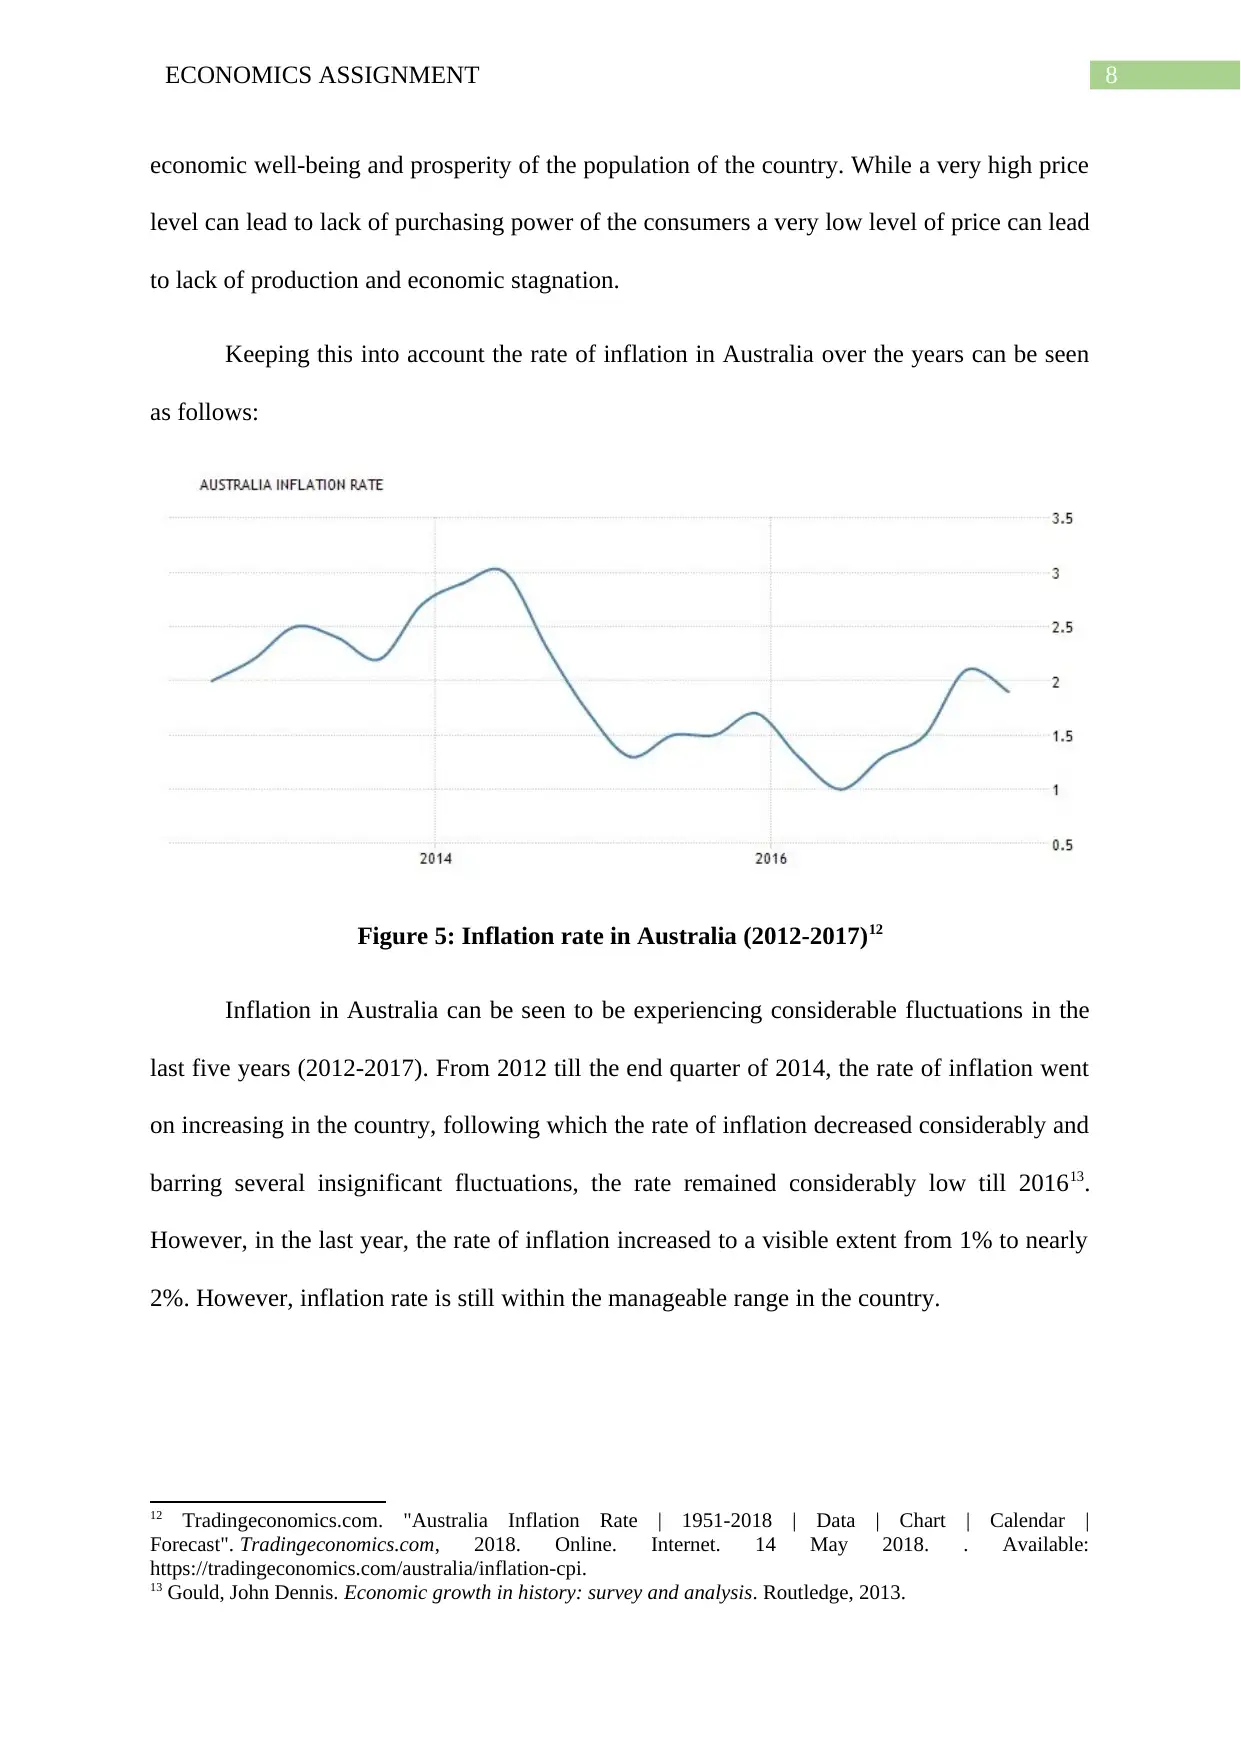
Keeping this into account the rate of inflation in Australia over the years can be seen
as follows:
Figure 5: Inflation rate in Australia (2012-2017)12
Inflation in Australia can be seen to be experiencing considerable fluctuations in the
last five years (2012-2017). From 2012 till the end quarter of 2014, the rate of inflation went
on increasing in the country, following which the rate of inflation decreased considerably and
barring several insignificant fluctuations, the rate remained considerably low till 201613.
However, in the last year, the rate of inflation increased to a visible extent from 1% to nearly
2%. However, inflation rate is still within the manageable range in the country.
12 Tradingeconomics.com. "Australia Inflation Rate | 1951-2018 | Data | Chart | Calendar |
Forecast". Tradingeconomics.com, 2018. Online. Internet. 14 May 2018. . Available:
https://tradingeconomics.com/australia/inflation-cpi.
13 Gould, John Dennis. Economic growth in history: survey and analysis. Routledge, 2013.
economic well-being and prosperity of the population of the country. While a very high price
level can lead to lack of purchasing power of the consumers a very low level of price can lead
to lack of production and economic stagnation.
Keeping this into account the rate of inflation in Australia over the years can be seen
as follows:
Figure 5: Inflation rate in Australia (2012-2017)12
Inflation in Australia can be seen to be experiencing considerable fluctuations in the
last five years (2012-2017). From 2012 till the end quarter of 2014, the rate of inflation went
on increasing in the country, following which the rate of inflation decreased considerably and
barring several insignificant fluctuations, the rate remained considerably low till 201613.
However, in the last year, the rate of inflation increased to a visible extent from 1% to nearly
2%. However, inflation rate is still within the manageable range in the country.
12 Tradingeconomics.com. "Australia Inflation Rate | 1951-2018 | Data | Chart | Calendar |
Forecast". Tradingeconomics.com, 2018. Online. Internet. 14 May 2018. . Available:
https://tradingeconomics.com/australia/inflation-cpi.
13 Gould, John Dennis. Economic growth in history: survey and analysis. Routledge, 2013.
⊘ This is a preview!⊘
Do you want full access?
Subscribe today to unlock all pages.
Trusted by 1+ million students worldwide
9ECONOMICS ASSIGNMENT
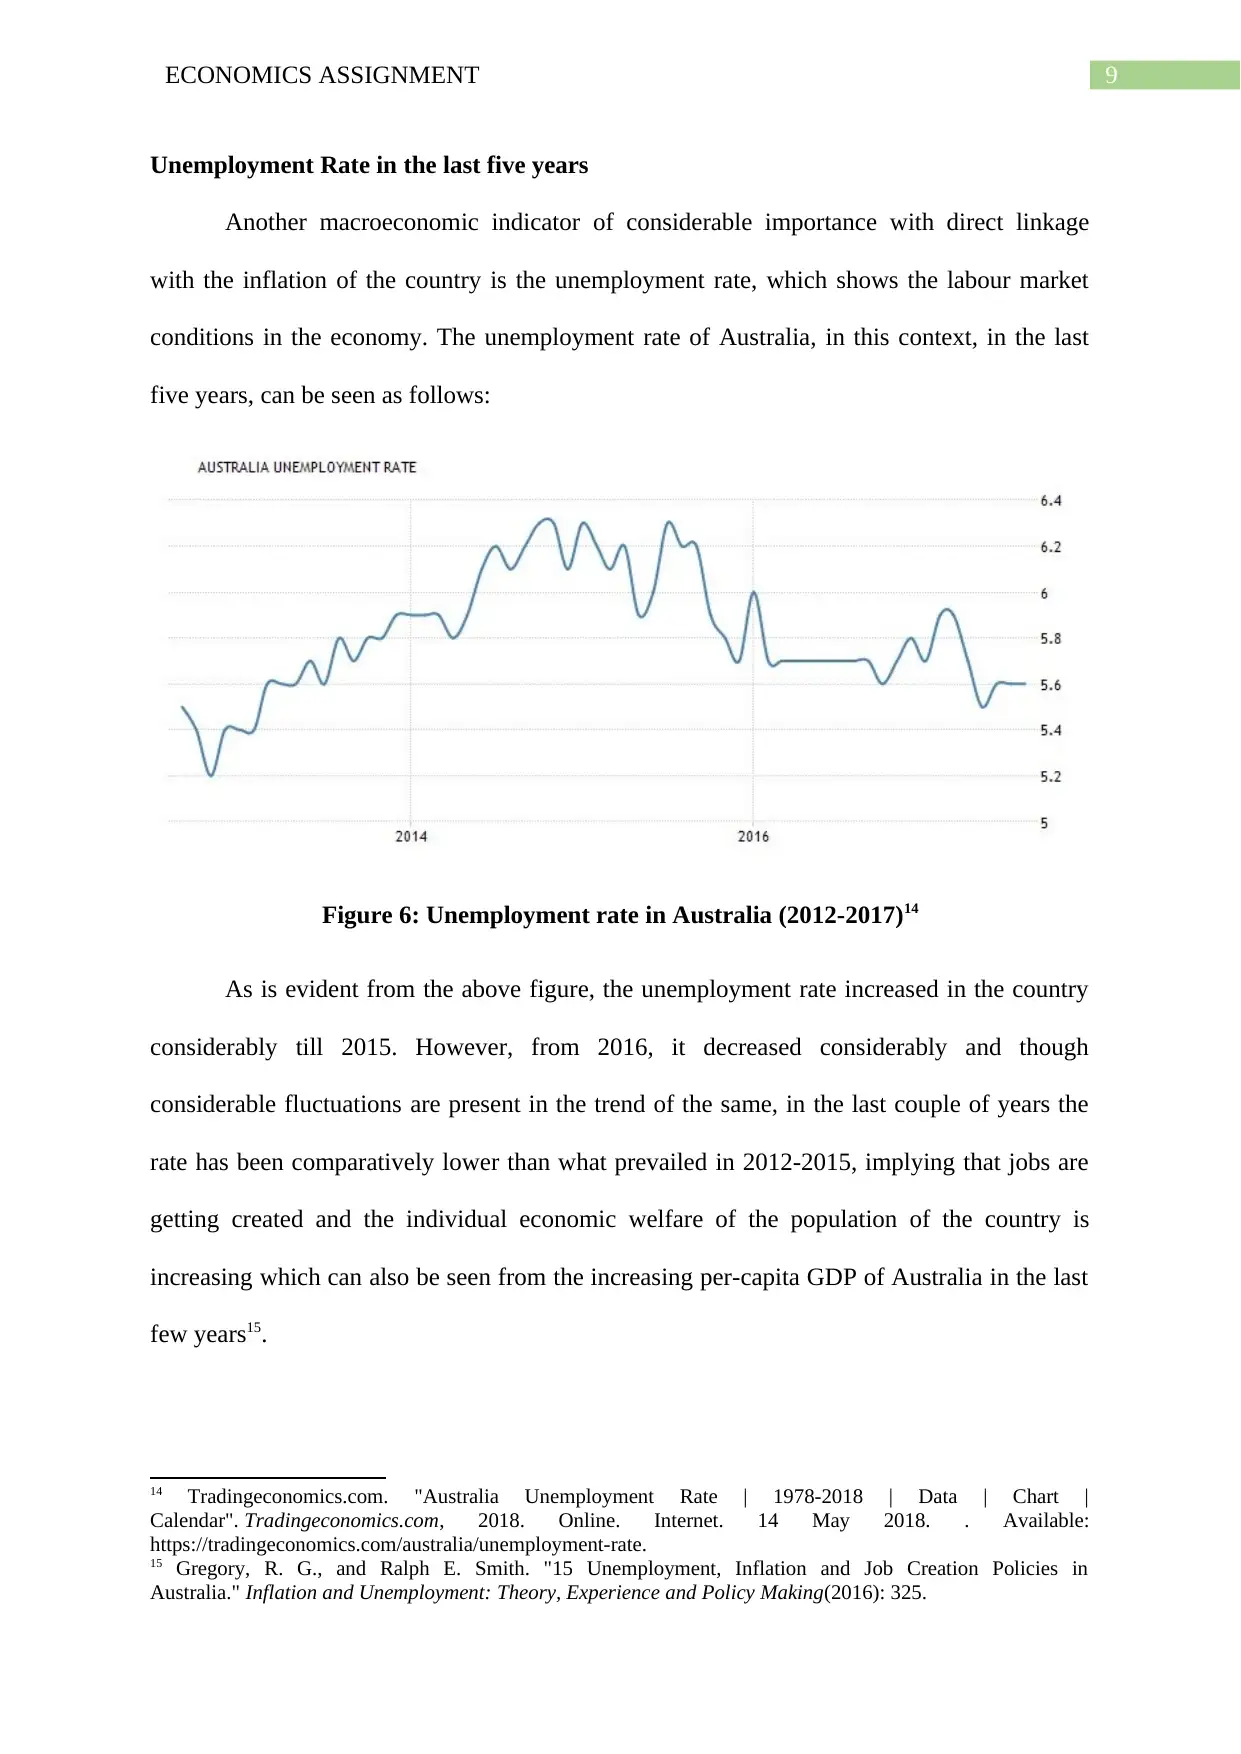
Unemployment Rate in the last five years
Another macroeconomic indicator of considerable importance with direct linkage
with the inflation of the country is the unemployment rate, which shows the labour market
conditions in the economy. The unemployment rate of Australia, in this context, in the last
five years, can be seen as follows:
Figure 6: Unemployment rate in Australia (2012-2017)14
As is evident from the above figure, the unemployment rate increased in the country
considerably till 2015. However, from 2016, it decreased considerably and though
considerable fluctuations are present in the trend of the same, in the last couple of years the
rate has been comparatively lower than what prevailed in 2012-2015, implying that jobs are
getting created and the individual economic welfare of the population of the country is
increasing which can also be seen from the increasing per-capita GDP of Australia in the last
few years15.
14 Tradingeconomics.com. "Australia Unemployment Rate | 1978-2018 | Data | Chart |
Calendar". Tradingeconomics.com, 2018. Online. Internet. 14 May 2018. . Available:
https://tradingeconomics.com/australia/unemployment-rate.
15 Gregory, R. G., and Ralph E. Smith. "15 Unemployment, Inflation and Job Creation Policies in
Australia." Inflation and Unemployment: Theory, Experience and Policy Making(2016): 325.
Paraphrase This Document
Need a fresh take? Get an instant paraphrase of this document with our AI Paraphraser
10ECONOMICS ASSIGNMENT
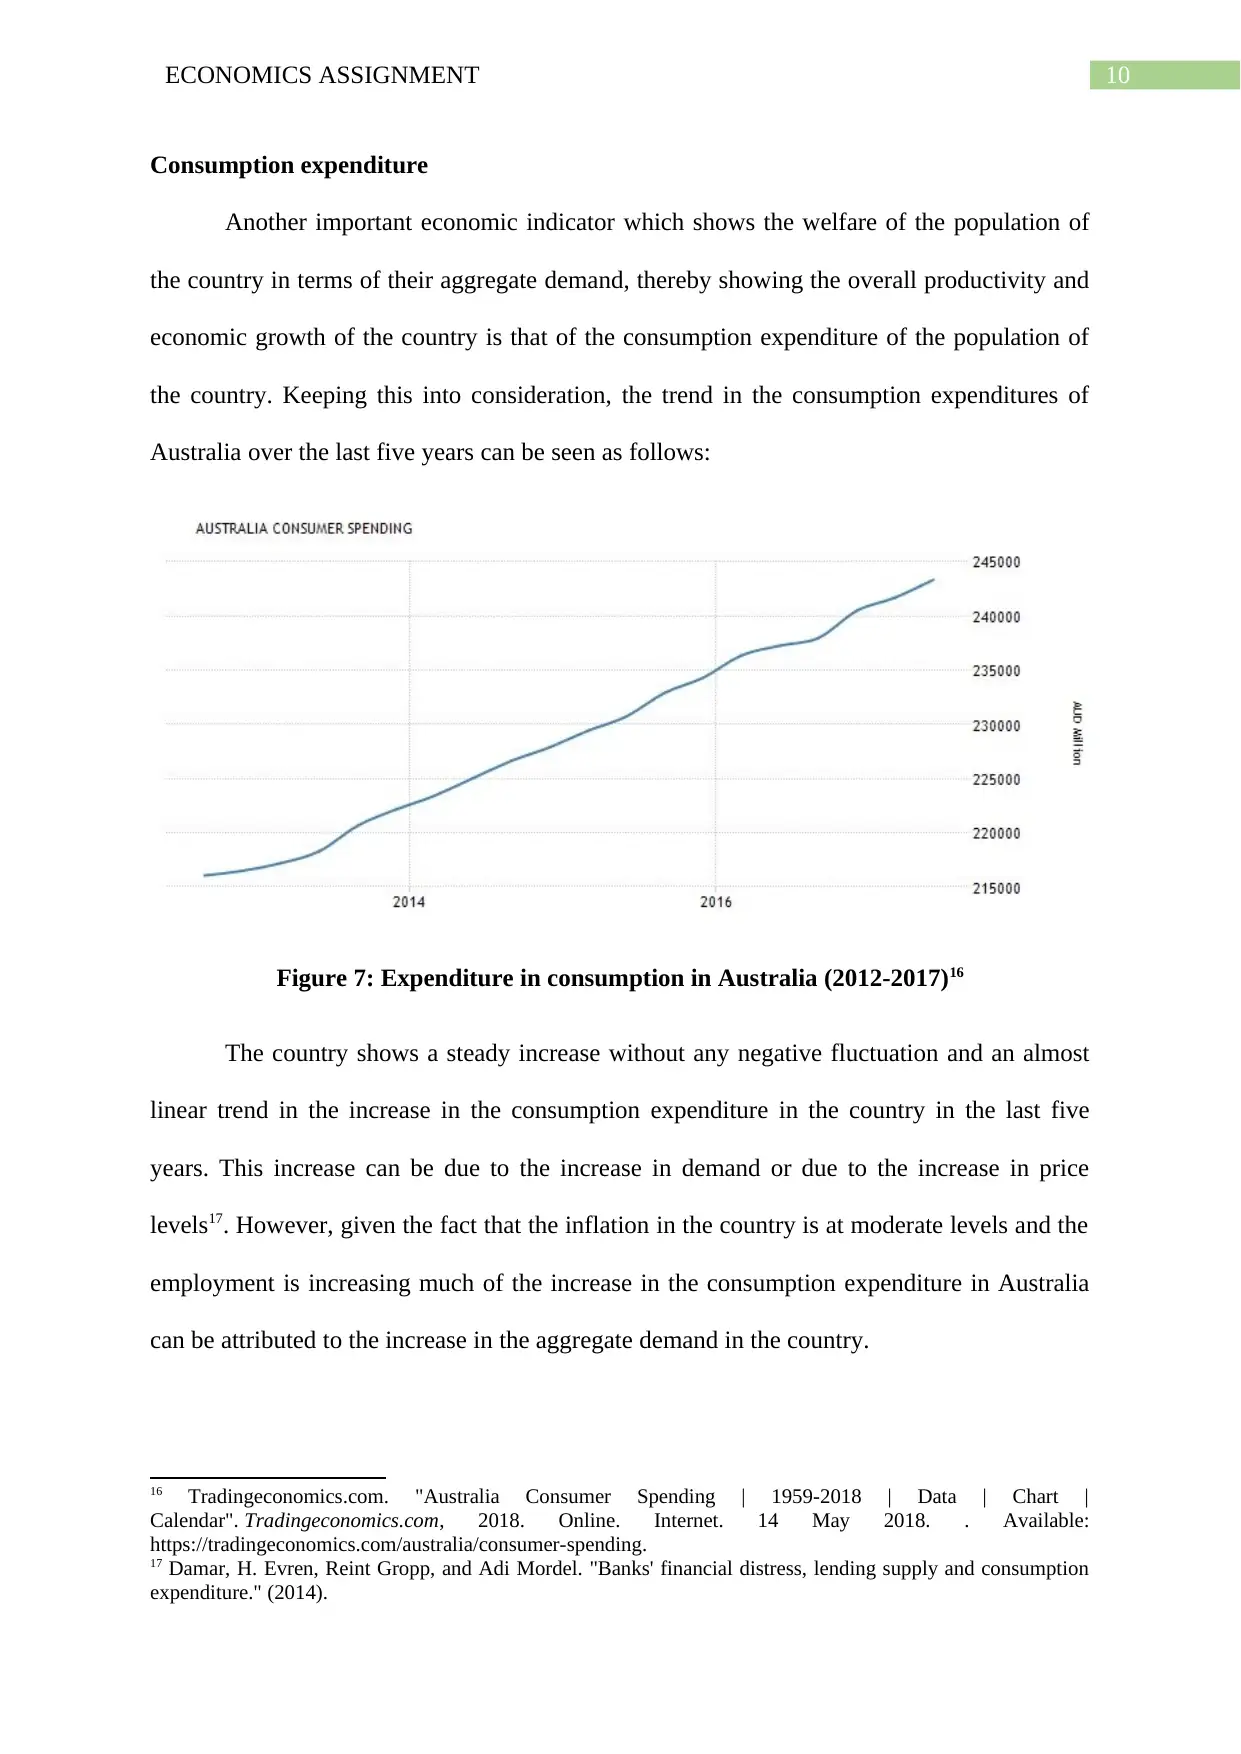
Consumption expenditure
Another important economic indicator which shows the welfare of the population of
the country in terms of their aggregate demand, thereby showing the overall productivity and
economic growth of the country is that of the consumption expenditure of the population of
the country. Keeping this into consideration, the trend in the consumption expenditures of
Australia over the last five years can be seen as follows:
Figure 7: Expenditure in consumption in Australia (2012-2017)16
The country shows a steady increase without any negative fluctuation and an almost
linear trend in the increase in the consumption expenditure in the country in the last five
years. This increase can be due to the increase in demand or due to the increase in price
levels17. However, given the fact that the inflation in the country is at moderate levels and the
employment is increasing much of the increase in the consumption expenditure in Australia
can be attributed to the increase in the aggregate demand in the country.
16 Tradingeconomics.com. "Australia Consumer Spending | 1959-2018 | Data | Chart |
Calendar". Tradingeconomics.com, 2018. Online. Internet. 14 May 2018. . Available:
https://tradingeconomics.com/australia/consumer-spending.
17 Damar, H. Evren, Reint Gropp, and Adi Mordel. "Banks' financial distress, lending supply and consumption
expenditure." (2014).
11ECONOMICS ASSIGNMENT
Economic Interpretation
From the trends observed in the different macroeconomic indicators for Australia over
the last five years, it can be asserted that despite the decrease in the overall GDP of the
country, the overall economy of Australia has been performing more or less impressively as
can be seen from the stability of the inflation rate, increasing level of consumption
expenditure and a falling unemployment rate in the country along with an increasing PPP
adjusted per-capita GDP of the country.
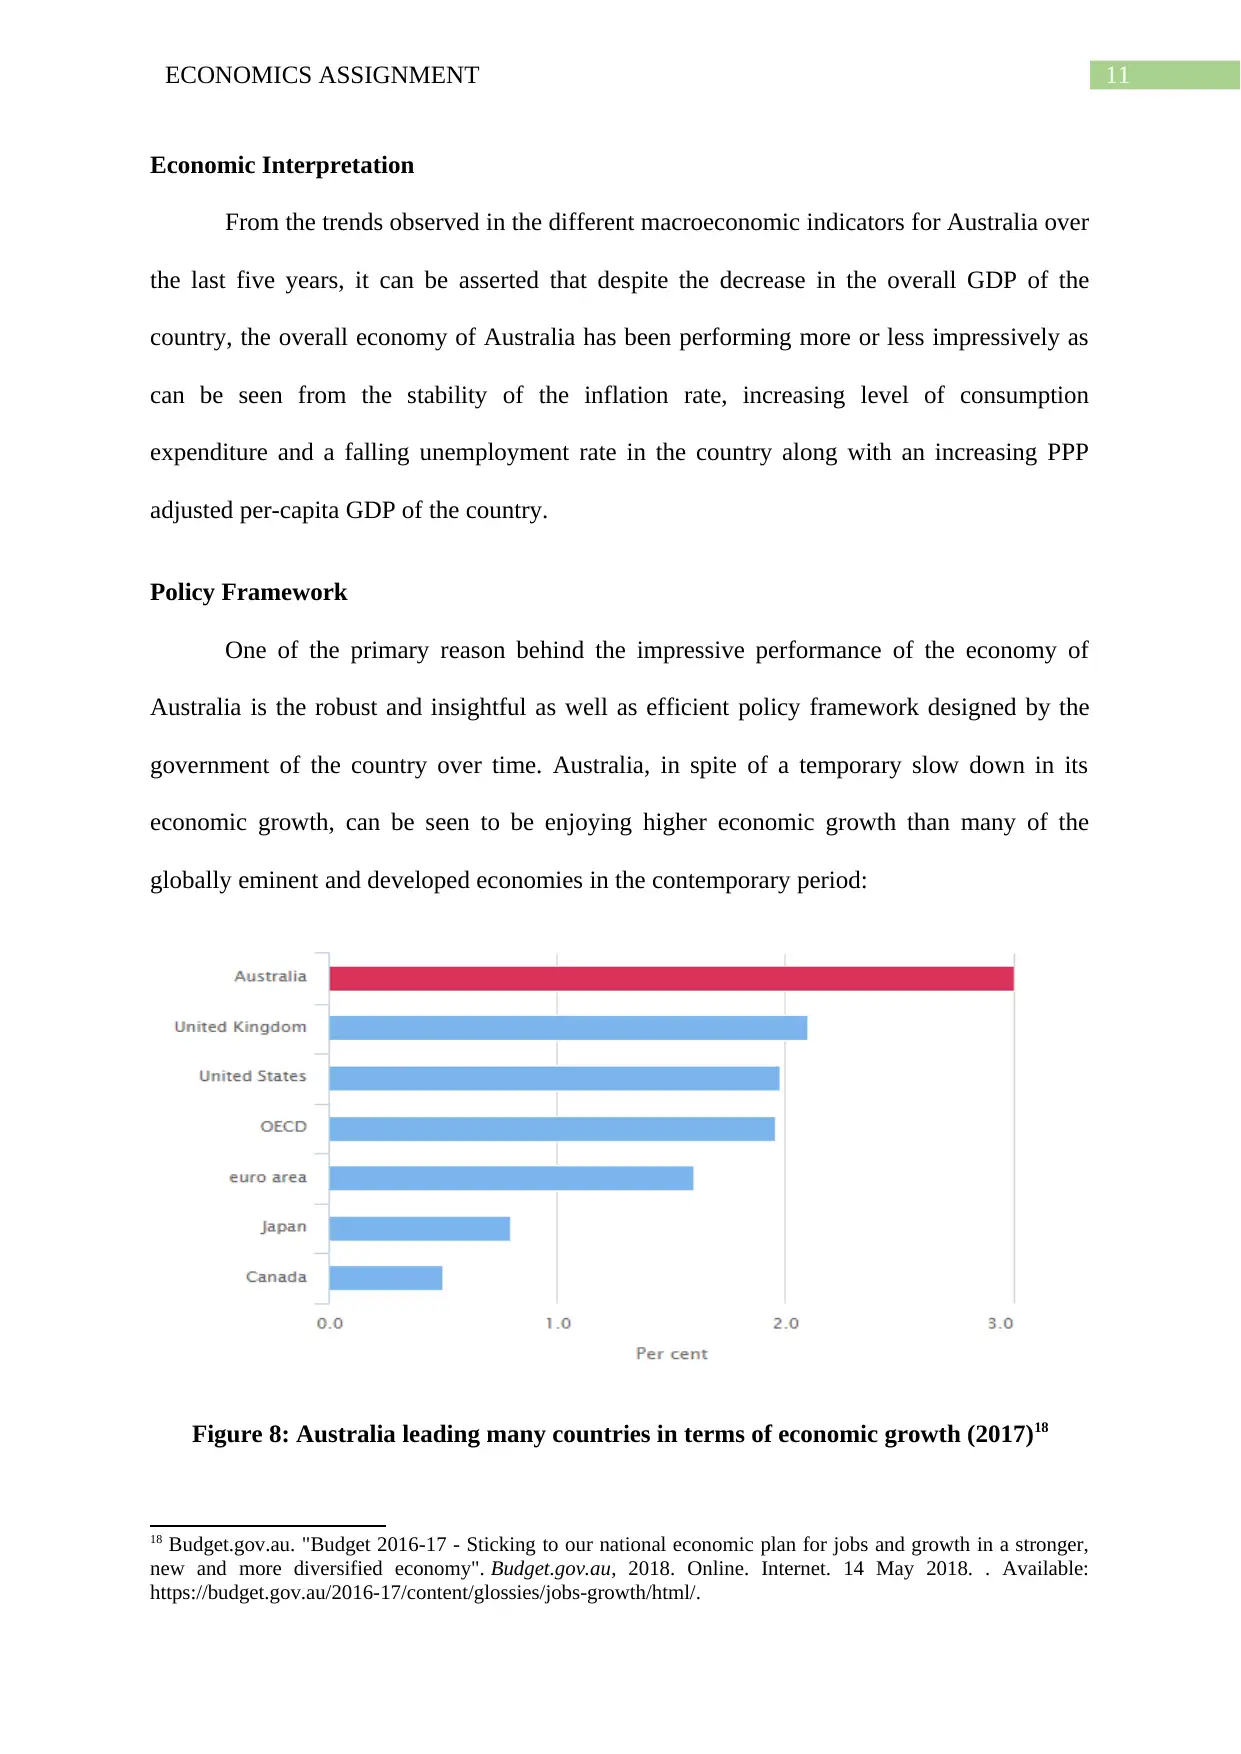
Policy Framework
One of the primary reason behind the impressive performance of the economy of
Australia is the robust and insightful as well as efficient policy framework designed by the
government of the country over time. Australia, in spite of a temporary slow down in its
economic growth, can be seen to be enjoying higher economic growth than many of the
globally eminent and developed economies in the contemporary period:
Figure 8: Australia leading many countries in terms of economic growth (2017)18
18 Budget.gov.au. "Budget 2016-17 - Sticking to our national economic plan for jobs and growth in a stronger,
new and more diversified economy". Budget.gov.au, 2018. Online. Internet. 14 May 2018. . Available:
https://budget.gov.au/2016-17/content/glossies/jobs-growth/html/.
Economic Interpretation
From the trends observed in the different macroeconomic indicators for Australia over
the last five years, it can be asserted that despite the decrease in the overall GDP of the
country, the overall economy of Australia has been performing more or less impressively as
can be seen from the stability of the inflation rate, increasing level of consumption
expenditure and a falling unemployment rate in the country along with an increasing PPP
adjusted per-capita GDP of the country.
Policy Framework
One of the primary reason behind the impressive performance of the economy of
Australia is the robust and insightful as well as efficient policy framework designed by the
government of the country over time. Australia, in spite of a temporary slow down in its
economic growth, can be seen to be enjoying higher economic growth than many of the
globally eminent and developed economies in the contemporary period:
Figure 8: Australia leading many countries in terms of economic growth (2017)18
18 Budget.gov.au. "Budget 2016-17 - Sticking to our national economic plan for jobs and growth in a stronger,
new and more diversified economy". Budget.gov.au, 2018. Online. Internet. 14 May 2018. . Available:
https://budget.gov.au/2016-17/content/glossies/jobs-growth/html/.
⊘ This is a preview!⊘
Do you want full access?
Subscribe today to unlock all pages.
Trusted by 1+ million students worldwide
1 out of 21
Related Documents


Your All-in-One AI-Powered Toolkit for Academic Success.
+13062052269
info@desklib.com
Available 24*7 on WhatsApp / Email
![[object Object]](/_next/static/media/star-bottom.7253800d.svg)
Unlock your academic potential
Copyright © 2020–2026 A2Z Services. All Rights Reserved. Developed and managed by ZUCOL.