THE ECONOMICS ASSIGNMENT
VerifiedAdded on 2022/09/07
|10
|1017
|18
AI Summary
Contribute Materials
Your contribution can guide someone’s learning journey. Share your
documents today.
Running head: ECONOMICS ASSIGNMENT
Economics Assignment
Name of the Student
Name of the University
Author Note
Economics Assignment
Name of the Student
Name of the University
Author Note
Secure Best Marks with AI Grader
Need help grading? Try our AI Grader for instant feedback on your assignments.
1ECONOMICS ASSIGNMENT
Table of Contents
Answer to question 1.......................................................................................................................2
Answer to question 2.......................................................................................................................5
Reference list...................................................................................................................................9
2ECONOMICS ASSIGNMENT
Answer to question 1
a)
500 750 1000 1250 1500 1750 2000 2250 2500 2750 3000 3250 3500 3750 4000
0
0.5
1
1.5
2
2.5
3
3.5
4
4.5
5
5.5
6
6.5
Demand supply
Quantity (boxes per week)
Price (dollars per box)
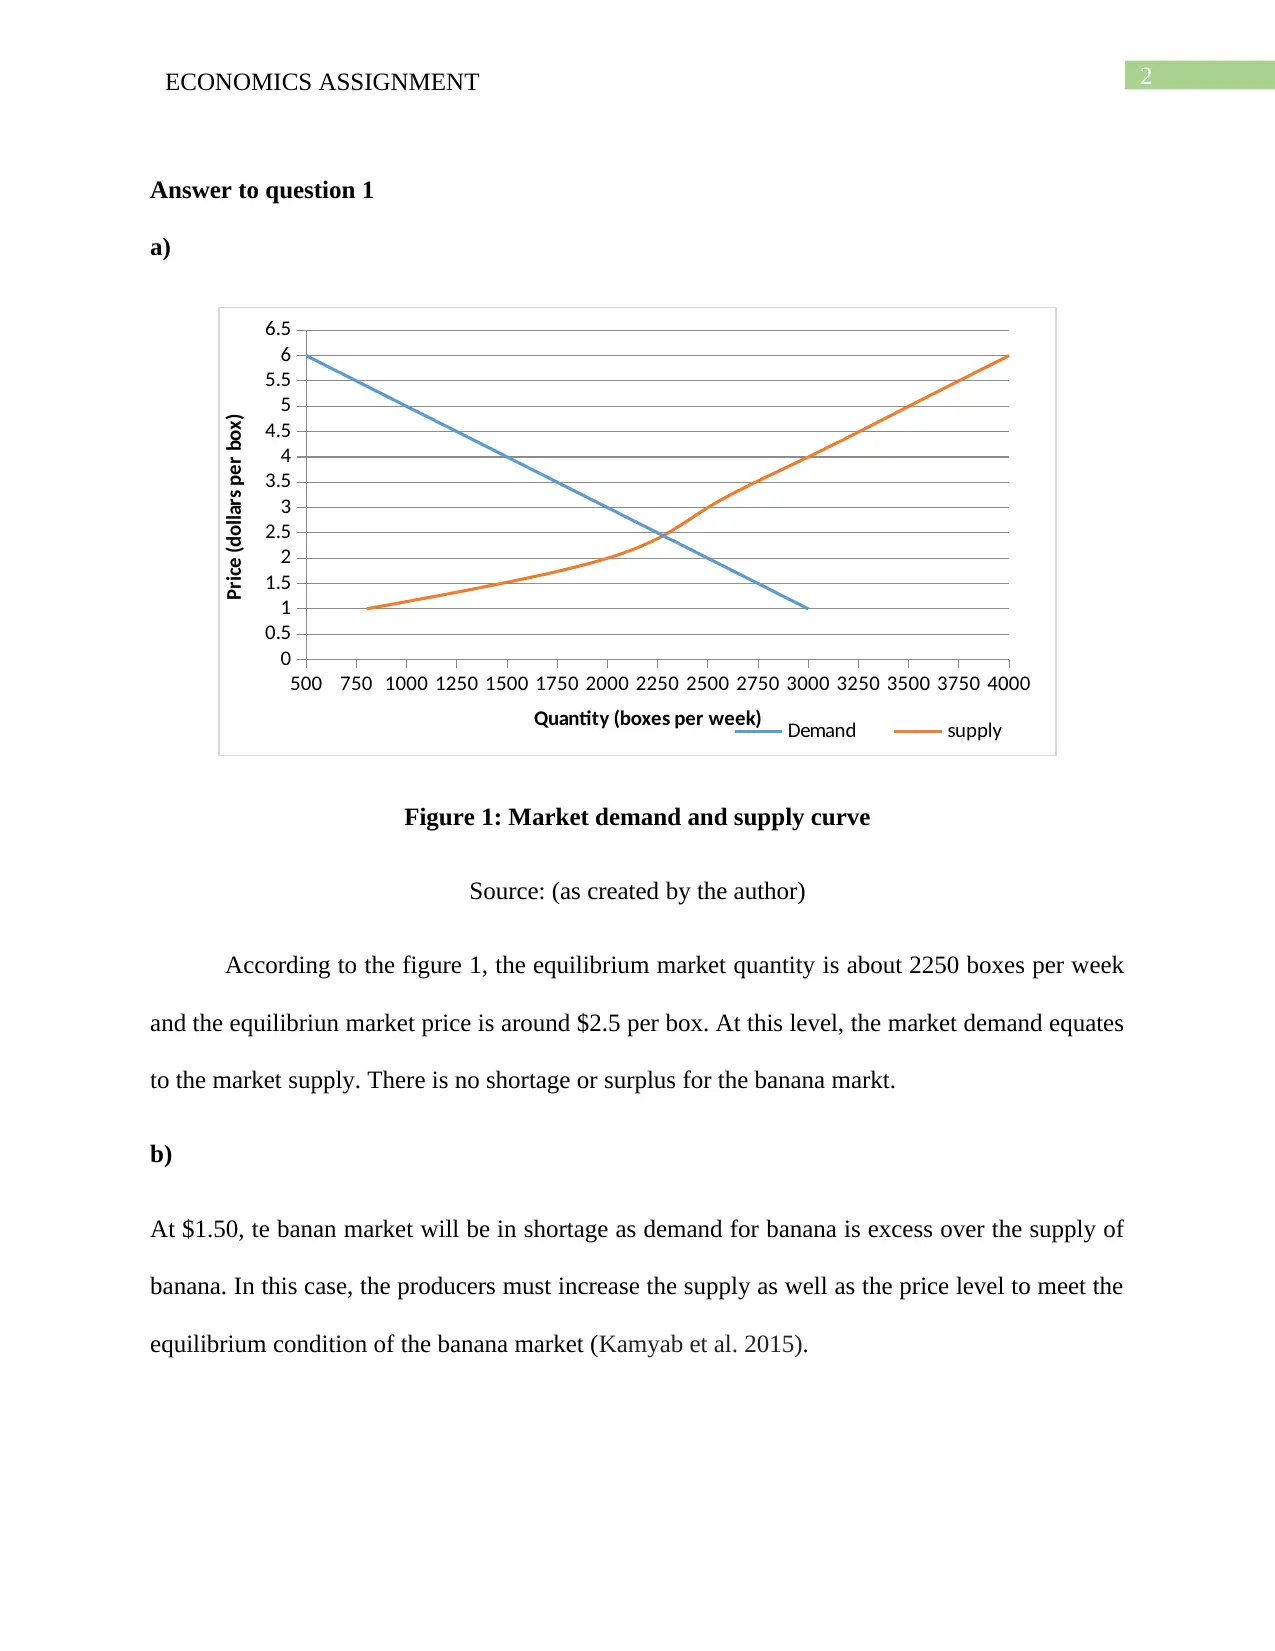
Figure 1: Market demand and supply curve
Source: (as created by the author)
According to the figure 1, the equilibrium market quantity is about 2250 boxes per week
and the equilibriun market price is around $2.5 per box. At this level, the market demand equates
to the market supply. There is no shortage or surplus for the banana markt.
b)
At $1.50, te banan market will be in shortage as demand for banana is excess over the supply of
banana. In this case, the producers must increase the supply as well as the price level to meet the
equilibrium condition of the banana market (Kamyab et al. 2015).
Answer to question 1
a)
500 750 1000 1250 1500 1750 2000 2250 2500 2750 3000 3250 3500 3750 4000
0
0.5
1
1.5
2
2.5
3
3.5
4
4.5
5
5.5
6
6.5
Demand supply
Quantity (boxes per week)
Price (dollars per box)
Figure 1: Market demand and supply curve
Source: (as created by the author)
According to the figure 1, the equilibrium market quantity is about 2250 boxes per week
and the equilibriun market price is around $2.5 per box. At this level, the market demand equates
to the market supply. There is no shortage or surplus for the banana markt.
b)
At $1.50, te banan market will be in shortage as demand for banana is excess over the supply of
banana. In this case, the producers must increase the supply as well as the price level to meet the
equilibrium condition of the banana market (Kamyab et al. 2015).
3ECONOMICS ASSIGNMENT
c)
300 550 800 105013001550180020502300255028003050330035503800
0
1
2
3
4
5
6
7
supply
Demand
Quantity (boxes per week)
Price (dollars per box)
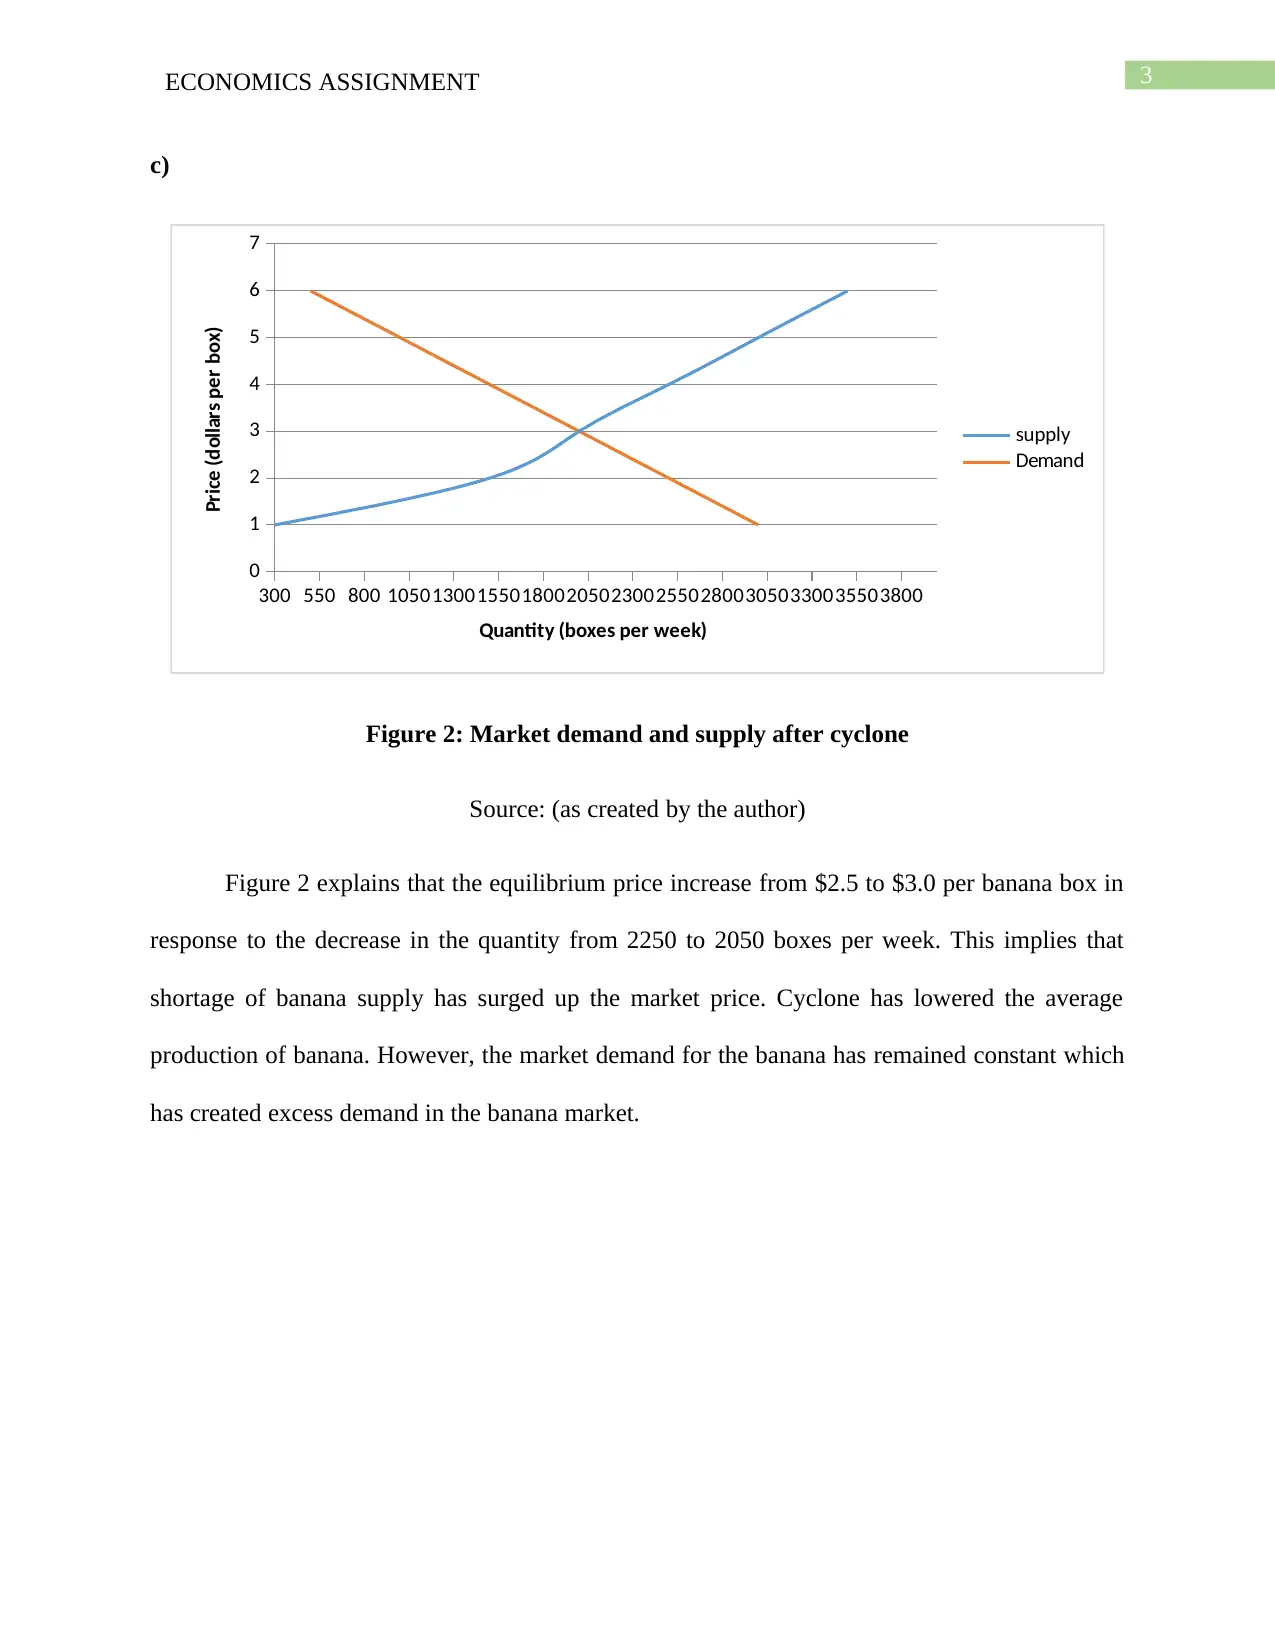
Figure 2: Market demand and supply after cyclone
Source: (as created by the author)
Figure 2 explains that the equilibrium price increase from $2.5 to $3.0 per banana box in
response to the decrease in the quantity from 2250 to 2050 boxes per week. This implies that
shortage of banana supply has surged up the market price. Cyclone has lowered the average
production of banana. However, the market demand for the banana has remained constant which
has created excess demand in the banana market.
c)
300 550 800 105013001550180020502300255028003050330035503800
0
1
2
3
4
5
6
7
supply
Demand
Quantity (boxes per week)
Price (dollars per box)
Figure 2: Market demand and supply after cyclone
Source: (as created by the author)
Figure 2 explains that the equilibrium price increase from $2.5 to $3.0 per banana box in
response to the decrease in the quantity from 2250 to 2050 boxes per week. This implies that
shortage of banana supply has surged up the market price. Cyclone has lowered the average
production of banana. However, the market demand for the banana has remained constant which
has created excess demand in the banana market.
Secure Best Marks with AI Grader
Need help grading? Try our AI Grader for instant feedback on your assignments.
4ECONOMICS ASSIGNMENT
d)
300 550 800 1050 1300 1550 1800 2050 2300 2550 2800 3050 3300
0
1
2
3
4
5
6
7
Demand
Supply
Quantity (boxes per week)
Price (dollars per week)
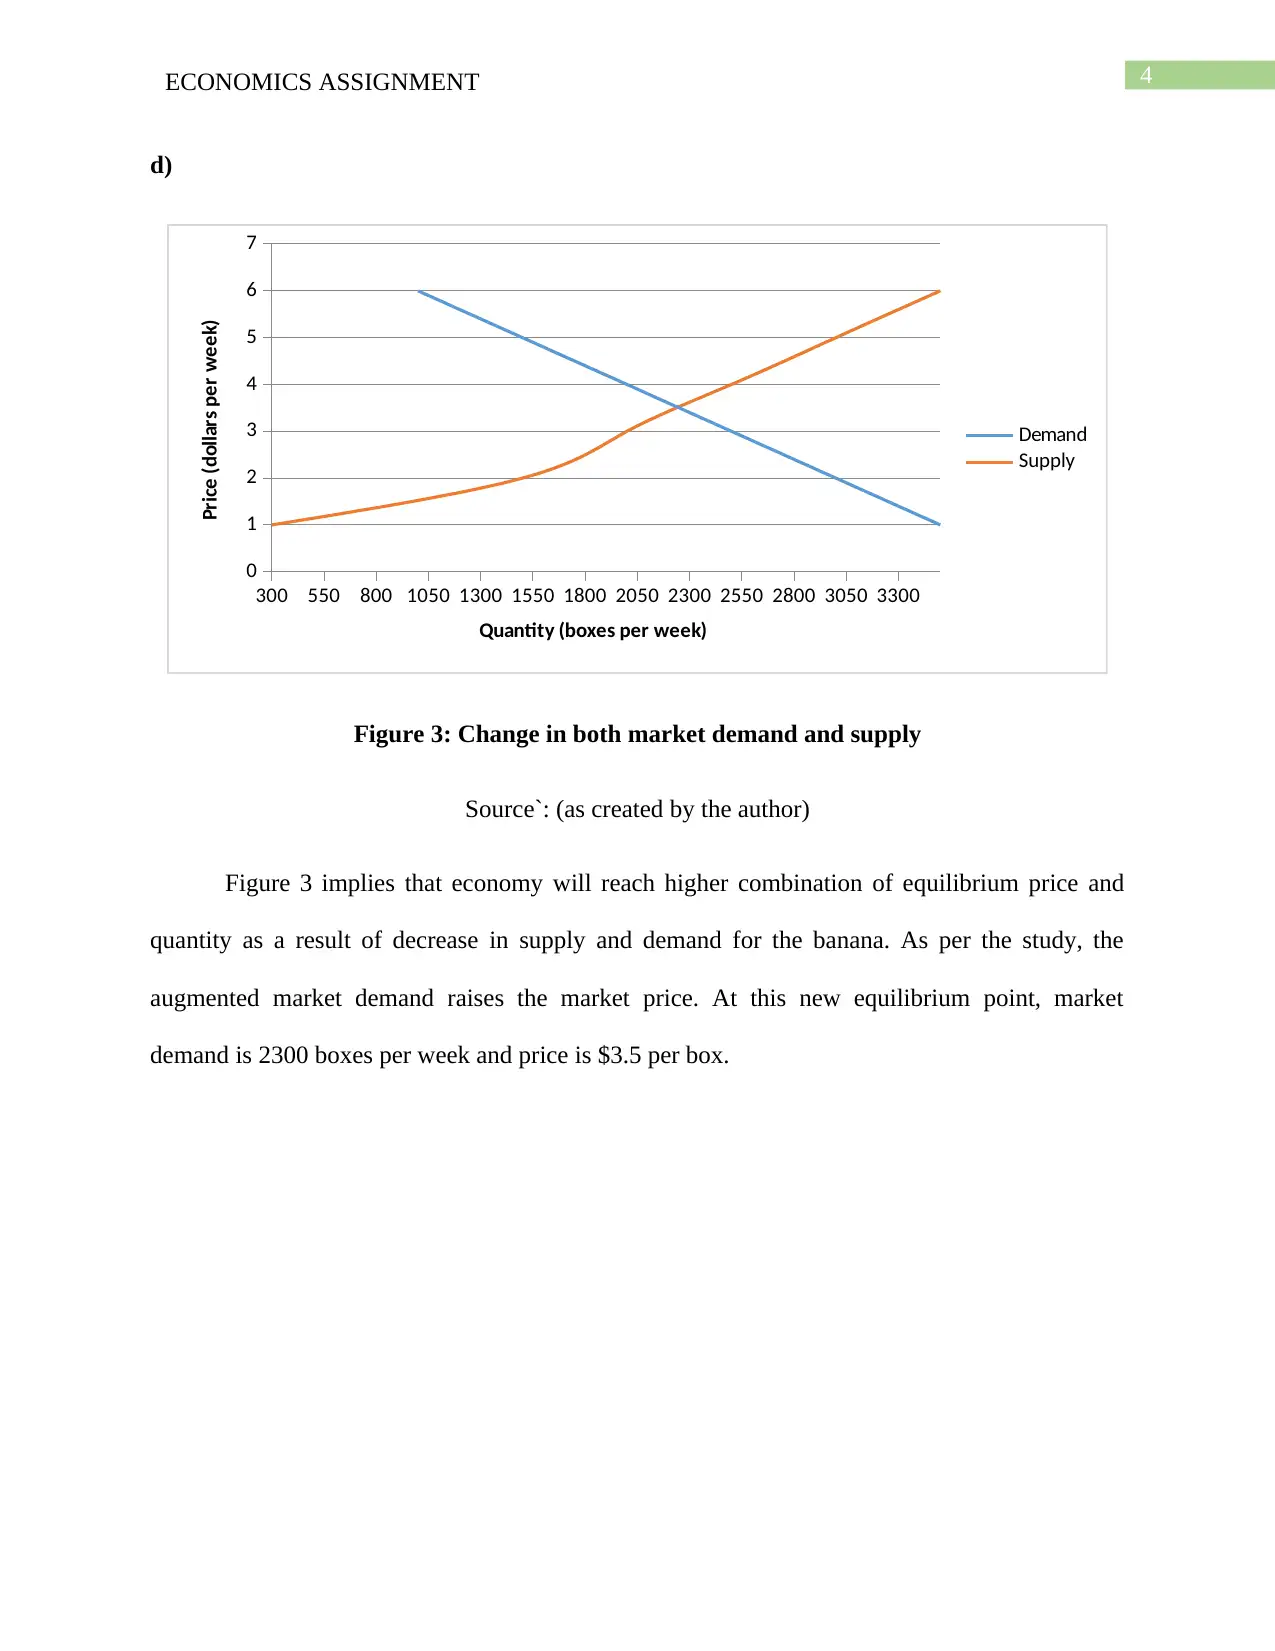
Figure 3: Change in both market demand and supply
Source`: (as created by the author)
Figure 3 implies that economy will reach higher combination of equilibrium price and
quantity as a result of decrease in supply and demand for the banana. As per the study, the
augmented market demand raises the market price. At this new equilibrium point, market
demand is 2300 boxes per week and price is $3.5 per box.
d)
300 550 800 1050 1300 1550 1800 2050 2300 2550 2800 3050 3300
0
1
2
3
4
5
6
7
Demand
Supply
Quantity (boxes per week)
Price (dollars per week)
Figure 3: Change in both market demand and supply
Source`: (as created by the author)
Figure 3 implies that economy will reach higher combination of equilibrium price and
quantity as a result of decrease in supply and demand for the banana. As per the study, the
augmented market demand raises the market price. At this new equilibrium point, market
demand is 2300 boxes per week and price is $3.5 per box.
Supply
Demand
Surplus
Quantity
Price
P*
Q*
5ECONOMICS ASSIGNMENT
Answer to question 2
a)
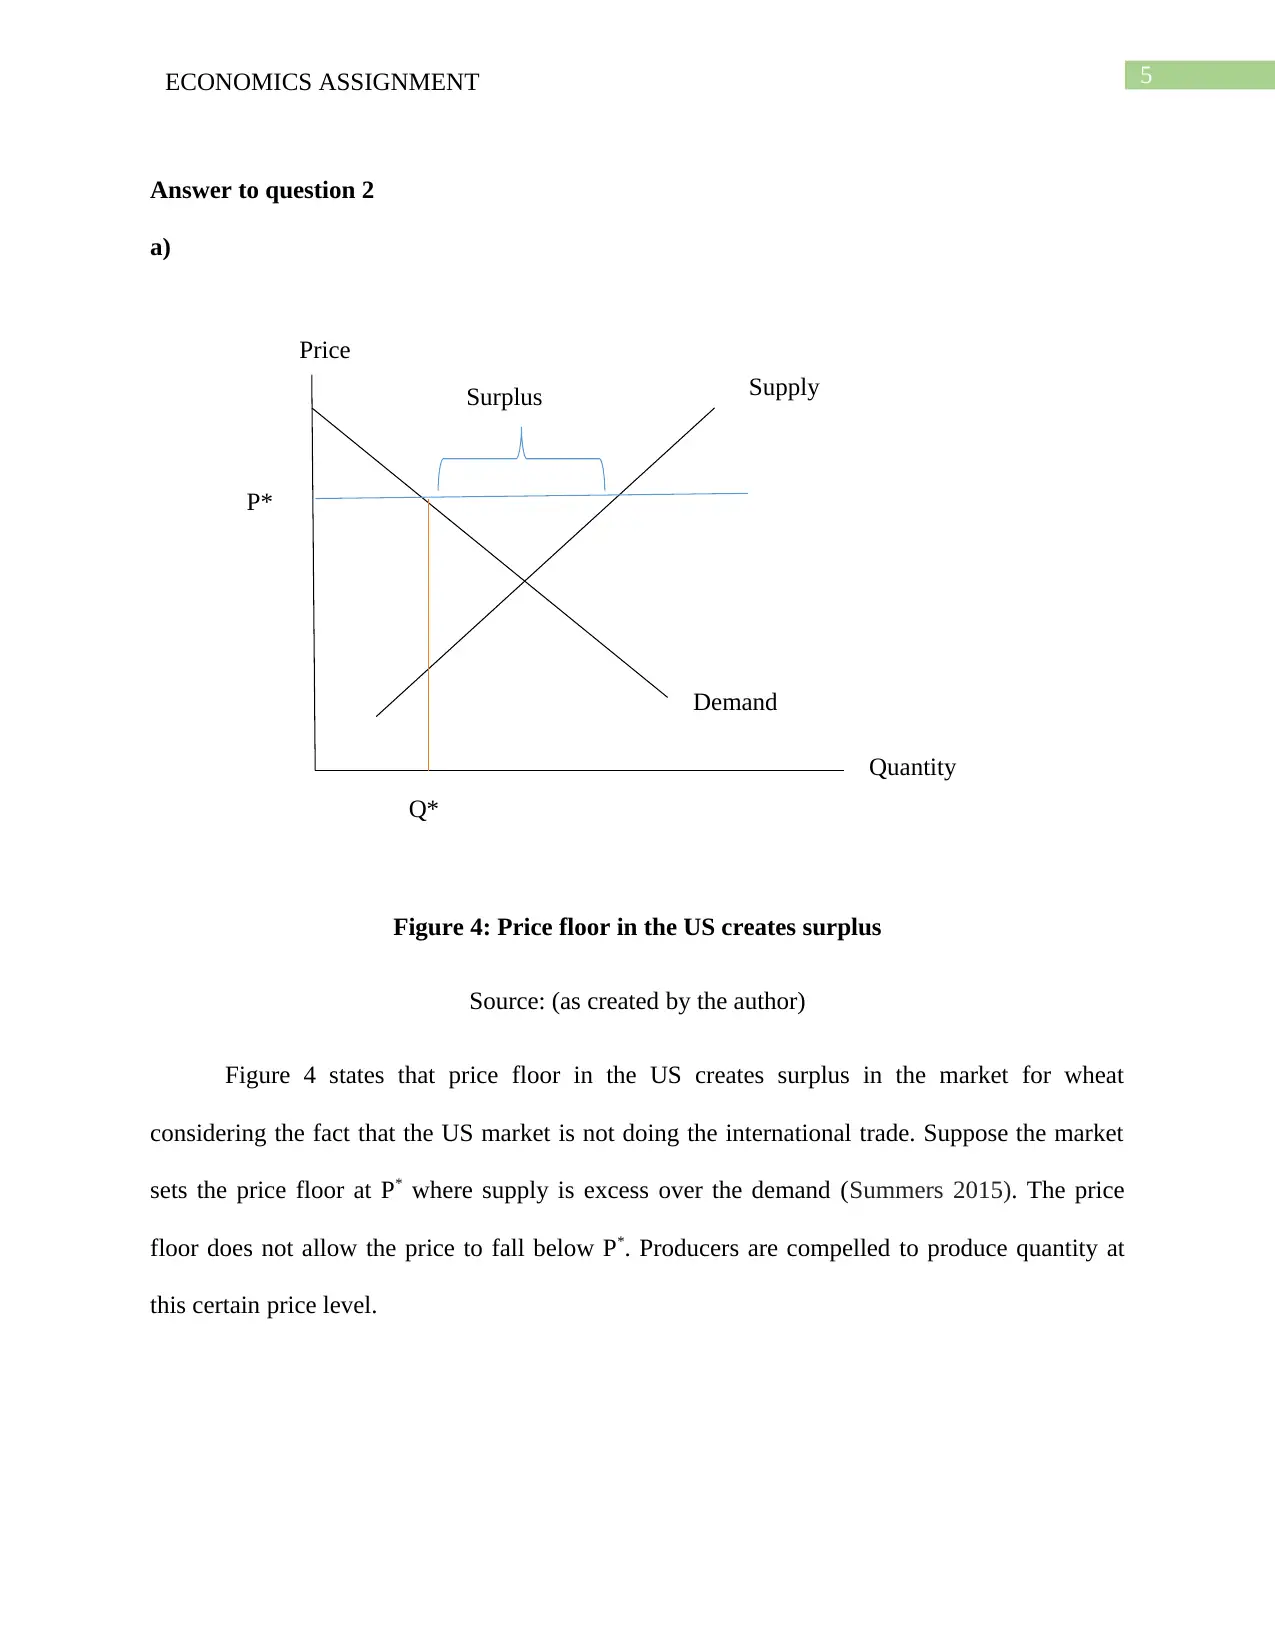
Figure 4: Price floor in the US creates surplus
Source: (as created by the author)
Figure 4 states that price floor in the US creates surplus in the market for wheat
considering the fact that the US market is not doing the international trade. Suppose the market
sets the price floor at P* where supply is excess over the demand (Summers 2015). The price
floor does not allow the price to fall below P*. Producers are compelled to produce quantity at
this certain price level.
Demand
Surplus
Quantity
Price
P*
Q*
5ECONOMICS ASSIGNMENT
Answer to question 2
a)
Figure 4: Price floor in the US creates surplus
Source: (as created by the author)
Figure 4 states that price floor in the US creates surplus in the market for wheat
considering the fact that the US market is not doing the international trade. Suppose the market
sets the price floor at P* where supply is excess over the demand (Summers 2015). The price
floor does not allow the price to fall below P*. Producers are compelled to produce quantity at
this certain price level.
Supply
Demand
Surplus
Quantity
Price
P*
Q*
DWL
CS
PS
6ECONOMICS ASSIGNMENT
b)
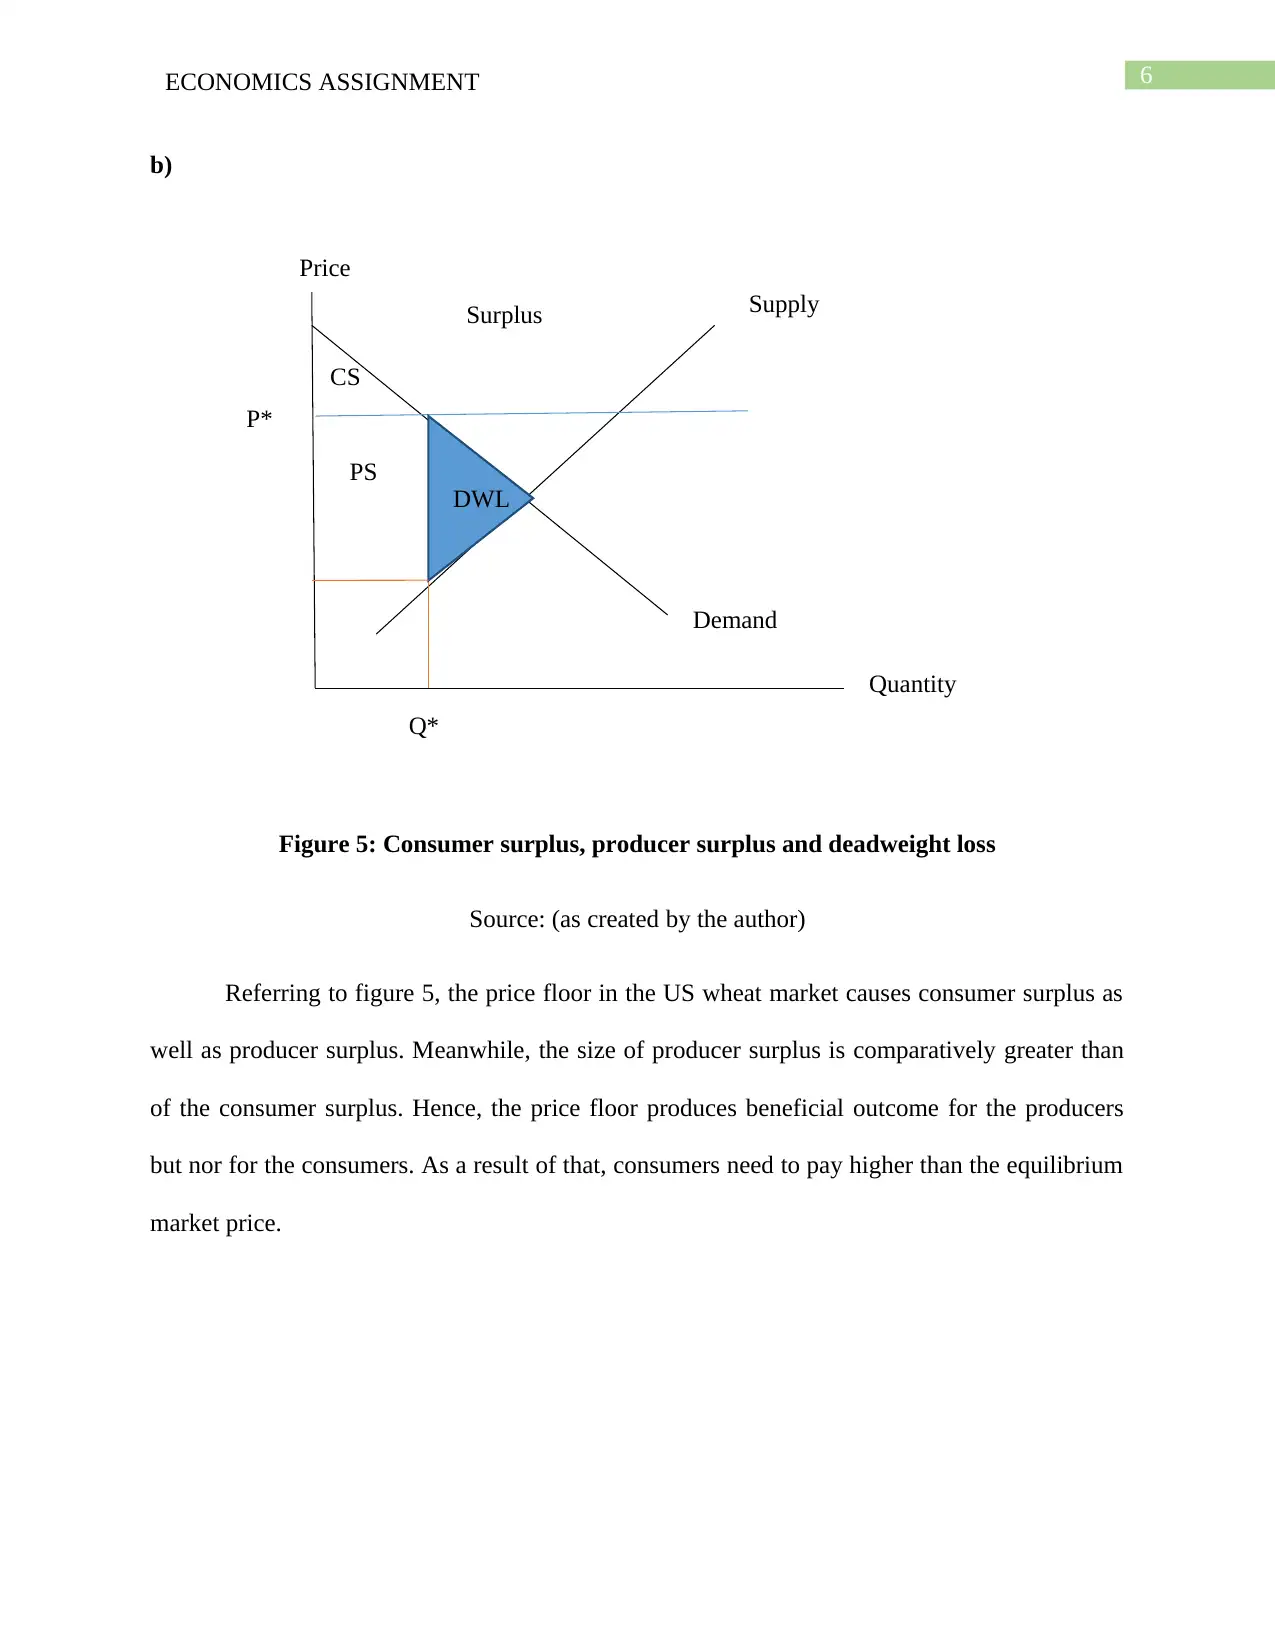
Figure 5: Consumer surplus, producer surplus and deadweight loss
Source: (as created by the author)
Referring to figure 5, the price floor in the US wheat market causes consumer surplus as
well as producer surplus. Meanwhile, the size of producer surplus is comparatively greater than
of the consumer surplus. Hence, the price floor produces beneficial outcome for the producers
but nor for the consumers. As a result of that, consumers need to pay higher than the equilibrium
market price.
Demand
Surplus
Quantity
Price
P*
Q*
DWL
CS
PS
6ECONOMICS ASSIGNMENT
b)
Figure 5: Consumer surplus, producer surplus and deadweight loss
Source: (as created by the author)
Referring to figure 5, the price floor in the US wheat market causes consumer surplus as
well as producer surplus. Meanwhile, the size of producer surplus is comparatively greater than
of the consumer surplus. Hence, the price floor produces beneficial outcome for the producers
but nor for the consumers. As a result of that, consumers need to pay higher than the equilibrium
market price.
Paraphrase This Document
Need a fresh take? Get an instant paraphrase of this document with our AI Paraphraser
7ECONOMICS ASSIGNMENT
c)
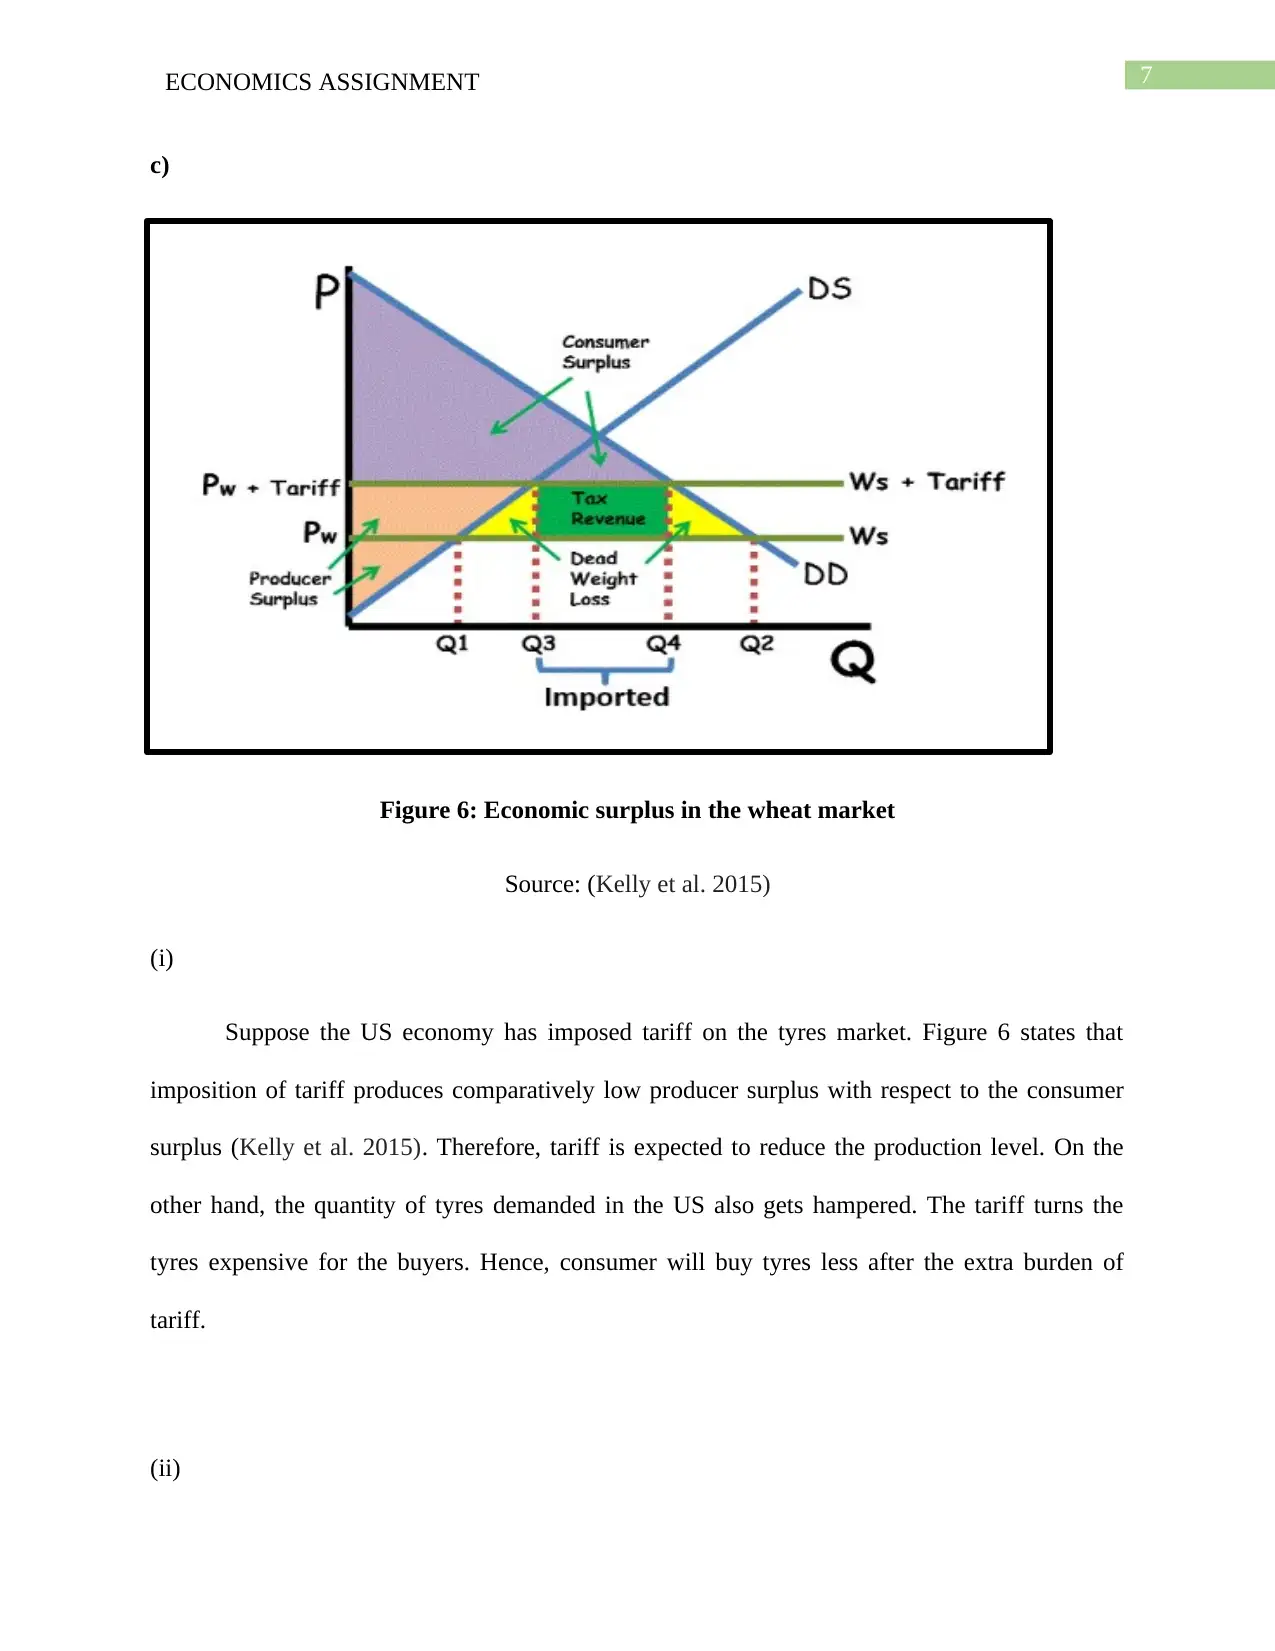
Figure 6: Economic surplus in the wheat market
Source: (Kelly et al. 2015)
(i)
Suppose the US economy has imposed tariff on the tyres market. Figure 6 states that
imposition of tariff produces comparatively low producer surplus with respect to the consumer
surplus (Kelly et al. 2015). Therefore, tariff is expected to reduce the production level. On the
other hand, the quantity of tyres demanded in the US also gets hampered. The tariff turns the
tyres expensive for the buyers. Hence, consumer will buy tyres less after the extra burden of
tariff.
(ii)
c)
Figure 6: Economic surplus in the wheat market
Source: (Kelly et al. 2015)
(i)
Suppose the US economy has imposed tariff on the tyres market. Figure 6 states that
imposition of tariff produces comparatively low producer surplus with respect to the consumer
surplus (Kelly et al. 2015). Therefore, tariff is expected to reduce the production level. On the
other hand, the quantity of tyres demanded in the US also gets hampered. The tariff turns the
tyres expensive for the buyers. Hence, consumer will buy tyres less after the extra burden of
tariff.
(ii)
8ECONOMICS ASSIGNMENT
It is clear from the figure 6 that consumer gains more surplus than the consumers.
Deadweight loss is incurred by both the parties. However, tariff raises the aggregate price level
of the tyres, which in turn, augments the production cost (Stanford 2017). In addition to that, the
rising price gives detrimental impact on the demand. As a result of the cumulative effect, the
consumers become winners and producers are losers.
d)
In terms of the effectiveness, the tariff is expected to produce more efficient outcome
compared to the price floor. In case of price floor strategy, the price does not fall after a certain
level. This makes the producers reluctant to maintain the quality of the goods and services. The
benefit of the consumers gets sacrificed when tariff imposes. Tariff makes the tyres production
expensive as it increases the price of the tyres. This discourages the producers.
9ECONOMICS ASSIGNMENT
Reference list
Kamyab, F., Amini, M., Sheykhha, S., Hasanpour, M. and Jalali, M.M., 2015. Demand response
program in smart grid using supply function bidding mechanism. IEEE Transactions on Smart
Grid, 7(3), pp.1277-1284.
Kelly, D., Bruce, A., MacGill, I. and Passey, R., 2015, December. An assessment of the cost-
reflectivity of proposed network tariffs in Australia. In Asia pacific solar Research conference.
Stanford, J., 2017. When an Auto Industry Disappears: Australia's Experience and Lessons for
Canada. Canadian Public Policy, 43(S1), pp.S57-S74.
Summers, L.H., 2015. Demand side secular stagnation. American Economic Review, 105(5),
pp.60-65.
1 out of 10
Related Documents


Your All-in-One AI-Powered Toolkit for Academic Success.
+13062052269
info@desklib.com
Available 24*7 on WhatsApp / Email
![[object Object]](/_next/static/media/star-bottom.7253800d.svg)
Unlock your academic potential
© 2024 | Zucol Services PVT LTD | All rights reserved.