Economics Assignment 1: Analyzing Australia's GDP and Economic Growth
VerifiedAdded on 2021/06/14
|17
|3593
|61
Report
AI Summary
This economics assignment provides a comprehensive analysis of Australia's economic growth over the past five years. The report examines key economic indicators, including real GDP growth, unemployment rates, consumption expenditure, investment expenditure, government expenditure, and net exports. It delves into the trends of each component, using statistical diagrams to illustrate the fluctuations and overall performance of the Australian economy. The analysis also considers the impact of government policies, such as fiscal and monetary policies, on inflation and economic stability. Furthermore, the report highlights the sectoral contributions to the national income, providing insights into the drivers of economic growth. The conclusion summarizes the findings, emphasizing the factors that have influenced Australia's economic performance and its ability to maintain stability in the international market.
Running head: ECONOMICS ASSIGNMENT
Economics assignment
Name of the student
Name of the university
Author Note
Economics assignment
Name of the student
Name of the university
Author Note
Paraphrase This Document
Need a fresh take? Get an instant paraphrase of this document with our AI Paraphraser
1ECONOMICS ASSIGNMENT
Table of Contents
Introduction:...............................................................................................................................2
Real GDP growth rate of Australia:...........................................................................................3
Unemployment rate of Australia:...............................................................................................4
Consumption expenditure for the last 5 years:...........................................................................4
Investment expenditure of Australia:.........................................................................................7
Government expenditure of Australia:.......................................................................................8
Net Export:.................................................................................................................................9
Government policy of Australia:..............................................................................................10
Sectoral contribution:...............................................................................................................12
Conclusion:..............................................................................................................................14
References:...............................................................................................................................15
2ECONOMICS ASSIGNMENT
Introduction:
Economic growth represents increase in market value of products of an economy after
adjusting inflation over a long period. This growth can be obtained through measuring the
percentage rate of increase of real GDP of the country (Schandl et al. 2016.). Hence, to
analyse economic growth of Australia, it is essential to measure real gross domestic product
(GDP) of this specified country as it can help to evaluate the performance of this country’s
economy. The GDP shows economic performance of the country for a long period, which can
be a year or quarter. Hence, this GDP can be considered as one of the most important
indicators for evaluating economy o a country. Australia has highly developed economy
along with a mixed market. In 2017, the gross domestic product of this country has remained
AUD$ 1.69 trillion. The country has maintained a longest run of uninterrupted GDP growth
among all developed countries across the world. The specified country has three chief
economical sectors, viz., primary or agriculture, secondary or manufacturing and service
sector. Each of these three sectors contribute significant portion to the national income of
Australia though the most important and dominating sector is service sector. This is because
the specified sector has contributed 61.1% to the country’s total GDP and has employed
almost 79.2% people of its total labour force in 2016 (Barraket et al. 2017). Four major
components can help to measure the GDP of a country and those components are personal
consumption expenditure, investment, net exports and government expenditures. Through
analysing those components one by one, the report can describe that whether GDP of
Australia has helped the country to increase its economic growth or not.
Thus, this report has intended to see GDP and economic growth of Australia for the
last 5 years. Moreover, based on this discussion, the report can analyse Australian
government policy and can also indentify that which sector has contributed more.
⊘ This is a preview!⊘
Do you want full access?
Subscribe today to unlock all pages.
Trusted by 1+ million students worldwide
3ECONOMICS ASSIGNMENT
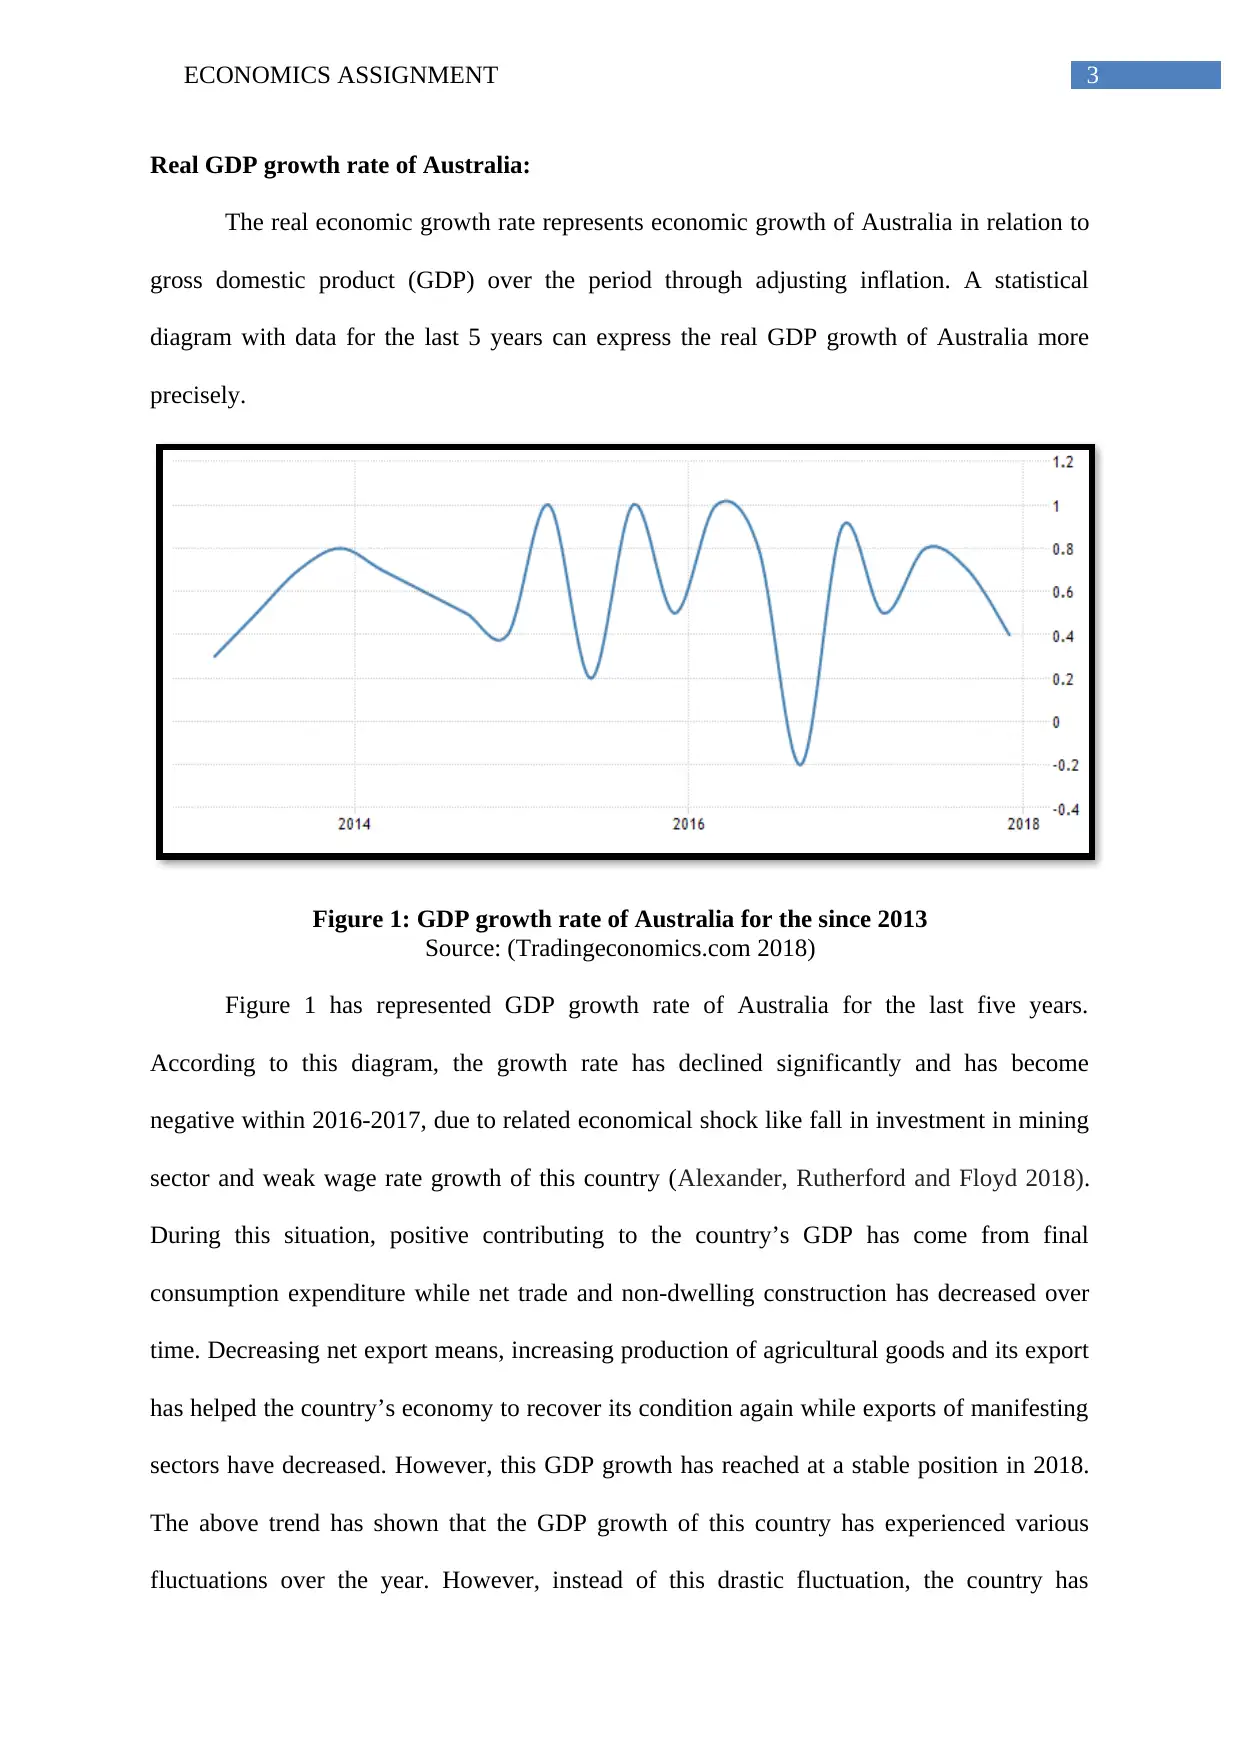
Real GDP growth rate of Australia:
The real economic growth rate represents economic growth of Australia in relation to
gross domestic product (GDP) over the period through adjusting inflation. A statistical
diagram with data for the last 5 years can express the real GDP growth of Australia more
precisely.
Figure 1: GDP growth rate of Australia for the since 2013
Source: (Tradingeconomics.com 2018)
Figure 1 has represented GDP growth rate of Australia for the last five years.
According to this diagram, the growth rate has declined significantly and has become
negative within 2016-2017, due to related economical shock like fall in investment in mining
sector and weak wage rate growth of this country (Alexander, Rutherford and Floyd 2018).
During this situation, positive contributing to the country’s GDP has come from final
consumption expenditure while net trade and non-dwelling construction has decreased over
time. Decreasing net export means, increasing production of agricultural goods and its export
has helped the country’s economy to recover its condition again while exports of manifesting
sectors have decreased. However, this GDP growth has reached at a stable position in 2018.
The above trend has shown that the GDP growth of this country has experienced various
fluctuations over the year. However, instead of this drastic fluctuation, the country has
Paraphrase This Document
Need a fresh take? Get an instant paraphrase of this document with our AI Paraphraser
4ECONOMICS ASSIGNMENT
successfully maintained its economic stability in the international market. Moreover, the
county has recovered its GDP from the negative segment and in recent year, this growth rate
has become 0.4%. This GDP growth has influenced employment of this country as well.
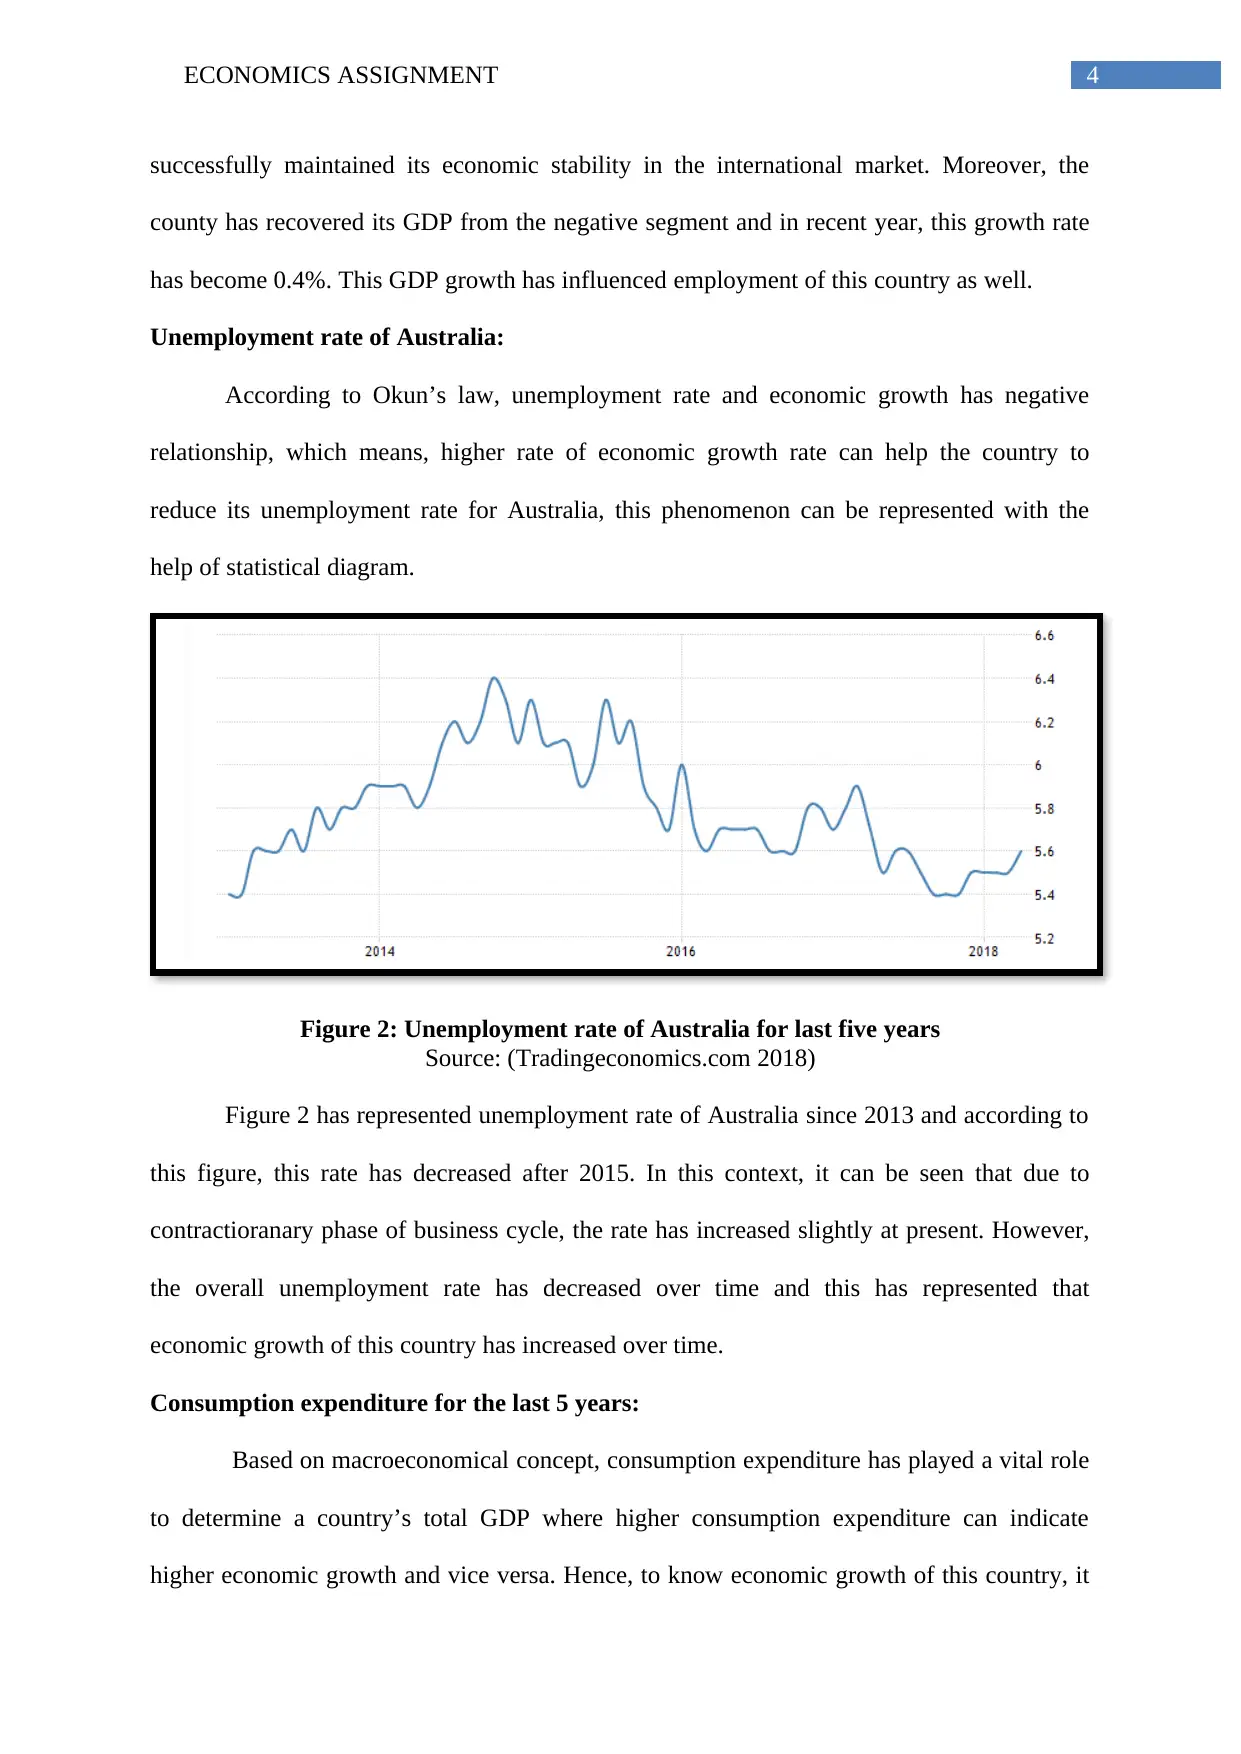
Unemployment rate of Australia:
According to Okun’s law, unemployment rate and economic growth has negative
relationship, which means, higher rate of economic growth rate can help the country to
reduce its unemployment rate for Australia, this phenomenon can be represented with the
help of statistical diagram.
Figure 2: Unemployment rate of Australia for last five years
Source: (Tradingeconomics.com 2018)
Figure 2 has represented unemployment rate of Australia since 2013 and according to
this figure, this rate has decreased after 2015. In this context, it can be seen that due to
contractioranary phase of business cycle, the rate has increased slightly at present. However,
the overall unemployment rate has decreased over time and this has represented that
economic growth of this country has increased over time.
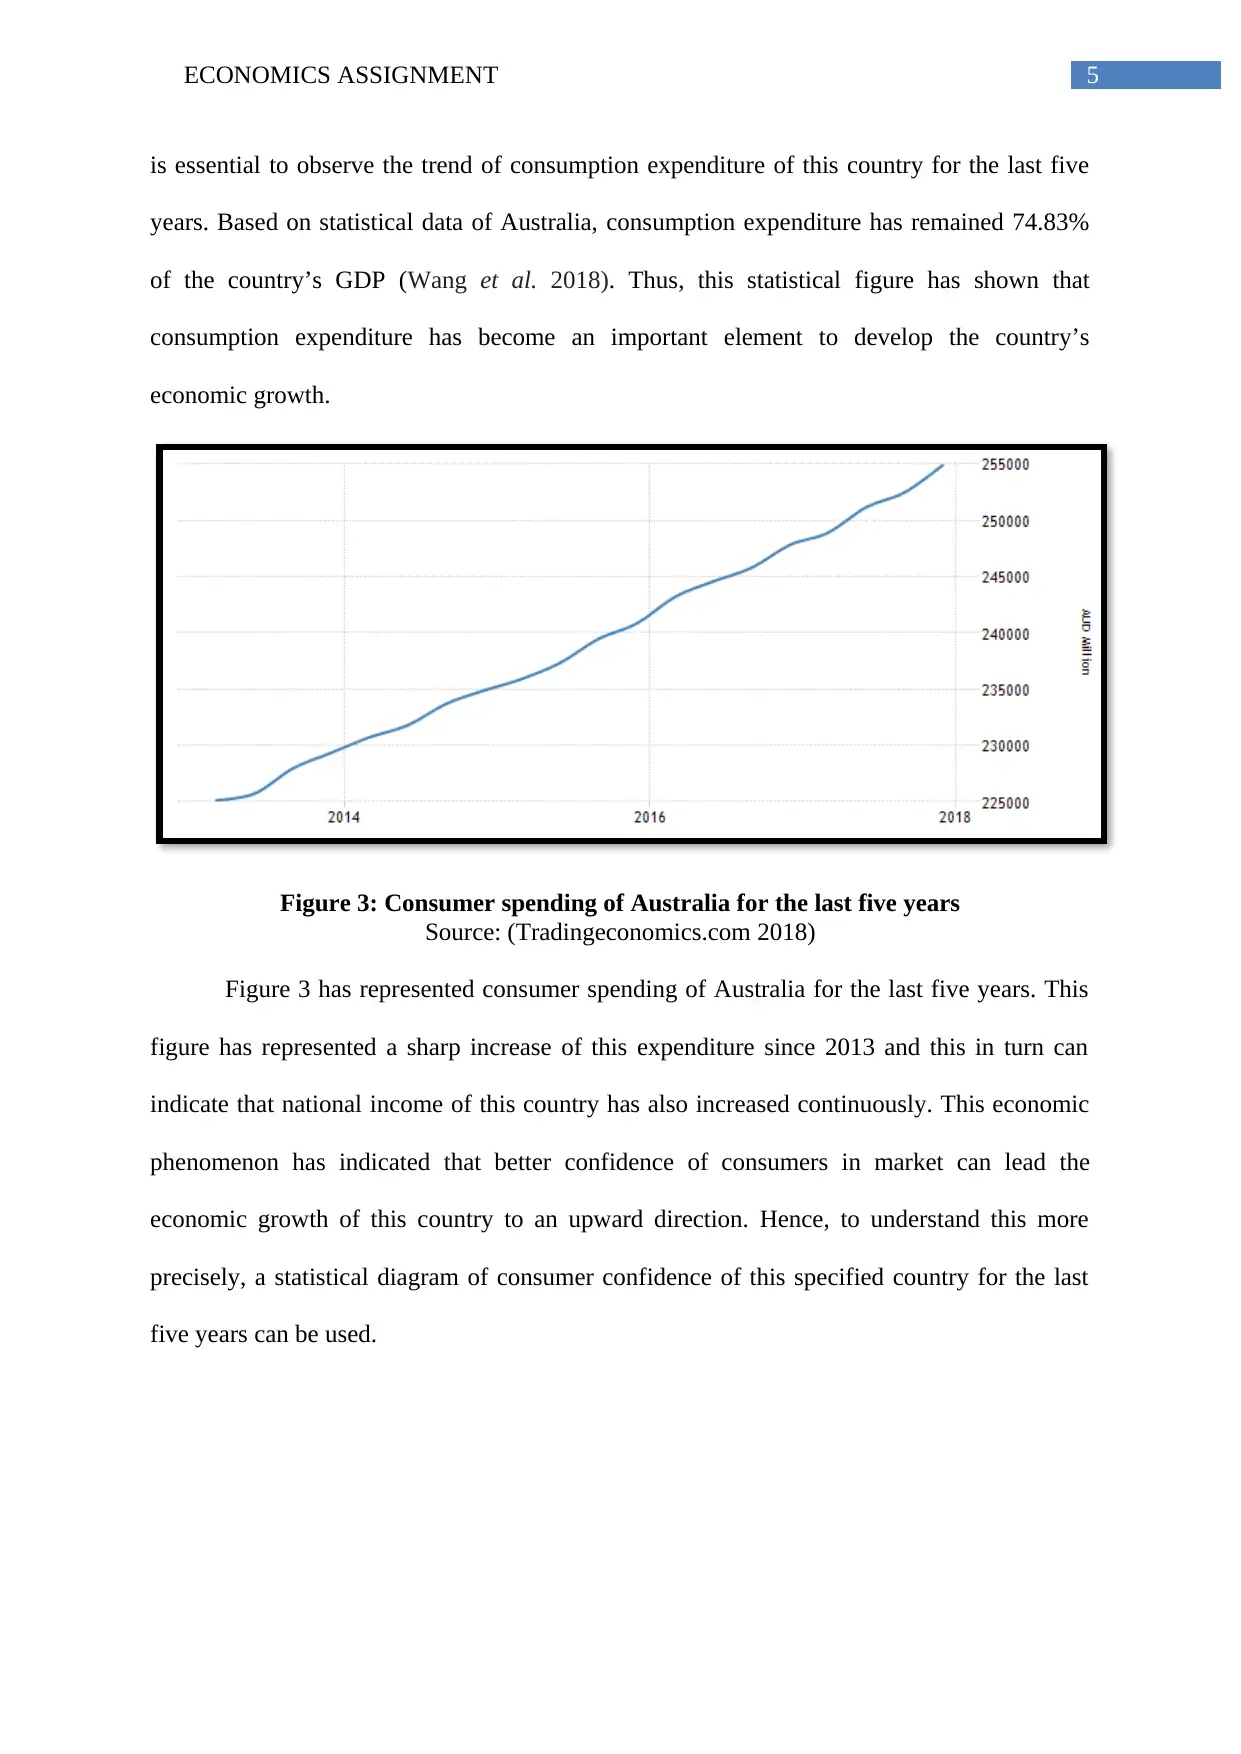
Consumption expenditure for the last 5 years:
Based on macroeconomical concept, consumption expenditure has played a vital role
to determine a country’s total GDP where higher consumption expenditure can indicate
higher economic growth and vice versa. Hence, to know economic growth of this country, it
successfully maintained its economic stability in the international market. Moreover, the
county has recovered its GDP from the negative segment and in recent year, this growth rate
has become 0.4%. This GDP growth has influenced employment of this country as well.
Unemployment rate of Australia:
According to Okun’s law, unemployment rate and economic growth has negative
relationship, which means, higher rate of economic growth rate can help the country to
reduce its unemployment rate for Australia, this phenomenon can be represented with the
help of statistical diagram.
Figure 2: Unemployment rate of Australia for last five years
Source: (Tradingeconomics.com 2018)
Figure 2 has represented unemployment rate of Australia since 2013 and according to
this figure, this rate has decreased after 2015. In this context, it can be seen that due to
contractioranary phase of business cycle, the rate has increased slightly at present. However,
the overall unemployment rate has decreased over time and this has represented that
economic growth of this country has increased over time.
Consumption expenditure for the last 5 years:
Based on macroeconomical concept, consumption expenditure has played a vital role
to determine a country’s total GDP where higher consumption expenditure can indicate
higher economic growth and vice versa. Hence, to know economic growth of this country, it
5ECONOMICS ASSIGNMENT
is essential to observe the trend of consumption expenditure of this country for the last five
years. Based on statistical data of Australia, consumption expenditure has remained 74.83%
of the country’s GDP (Wang et al. 2018). Thus, this statistical figure has shown that
consumption expenditure has become an important element to develop the country’s
economic growth.
Figure 3: Consumer spending of Australia for the last five years
Source: (Tradingeconomics.com 2018)
Figure 3 has represented consumer spending of Australia for the last five years. This
figure has represented a sharp increase of this expenditure since 2013 and this in turn can
indicate that national income of this country has also increased continuously. This economic
phenomenon has indicated that better confidence of consumers in market can lead the
economic growth of this country to an upward direction. Hence, to understand this more
precisely, a statistical diagram of consumer confidence of this specified country for the last
five years can be used.
⊘ This is a preview!⊘
Do you want full access?
Subscribe today to unlock all pages.
Trusted by 1+ million students worldwide
6ECONOMICS ASSIGNMENT
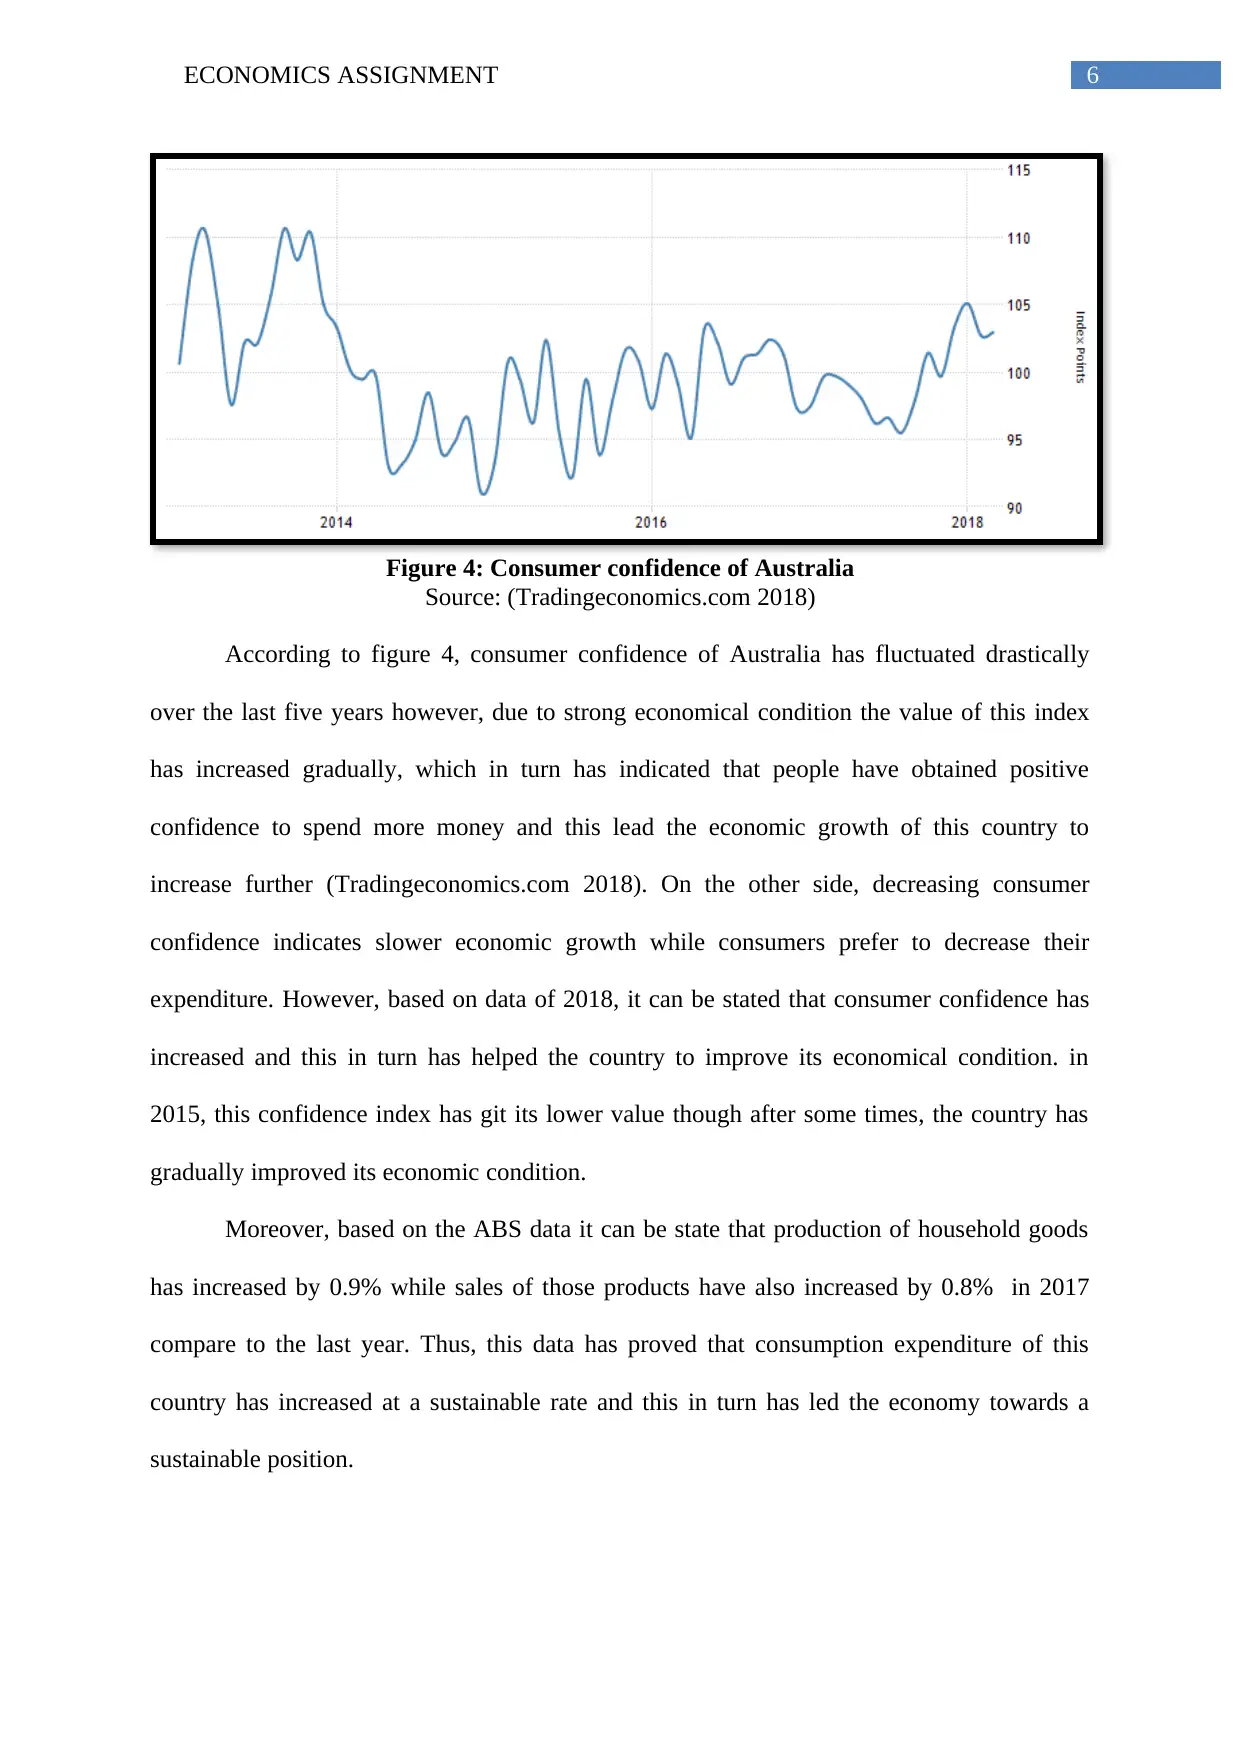
Figure 4: Consumer confidence of Australia
Source: (Tradingeconomics.com 2018)
According to figure 4, consumer confidence of Australia has fluctuated drastically
over the last five years however, due to strong economical condition the value of this index
has increased gradually, which in turn has indicated that people have obtained positive
confidence to spend more money and this lead the economic growth of this country to
increase further (Tradingeconomics.com 2018). On the other side, decreasing consumer
confidence indicates slower economic growth while consumers prefer to decrease their
expenditure. However, based on data of 2018, it can be stated that consumer confidence has
increased and this in turn has helped the country to improve its economical condition. in
2015, this confidence index has git its lower value though after some times, the country has
gradually improved its economic condition.
Moreover, based on the ABS data it can be state that production of household goods
has increased by 0.9% while sales of those products have also increased by 0.8% in 2017
compare to the last year. Thus, this data has proved that consumption expenditure of this
country has increased at a sustainable rate and this in turn has led the economy towards a
sustainable position.
Paraphrase This Document
Need a fresh take? Get an instant paraphrase of this document with our AI Paraphraser
7ECONOMICS ASSIGNMENT
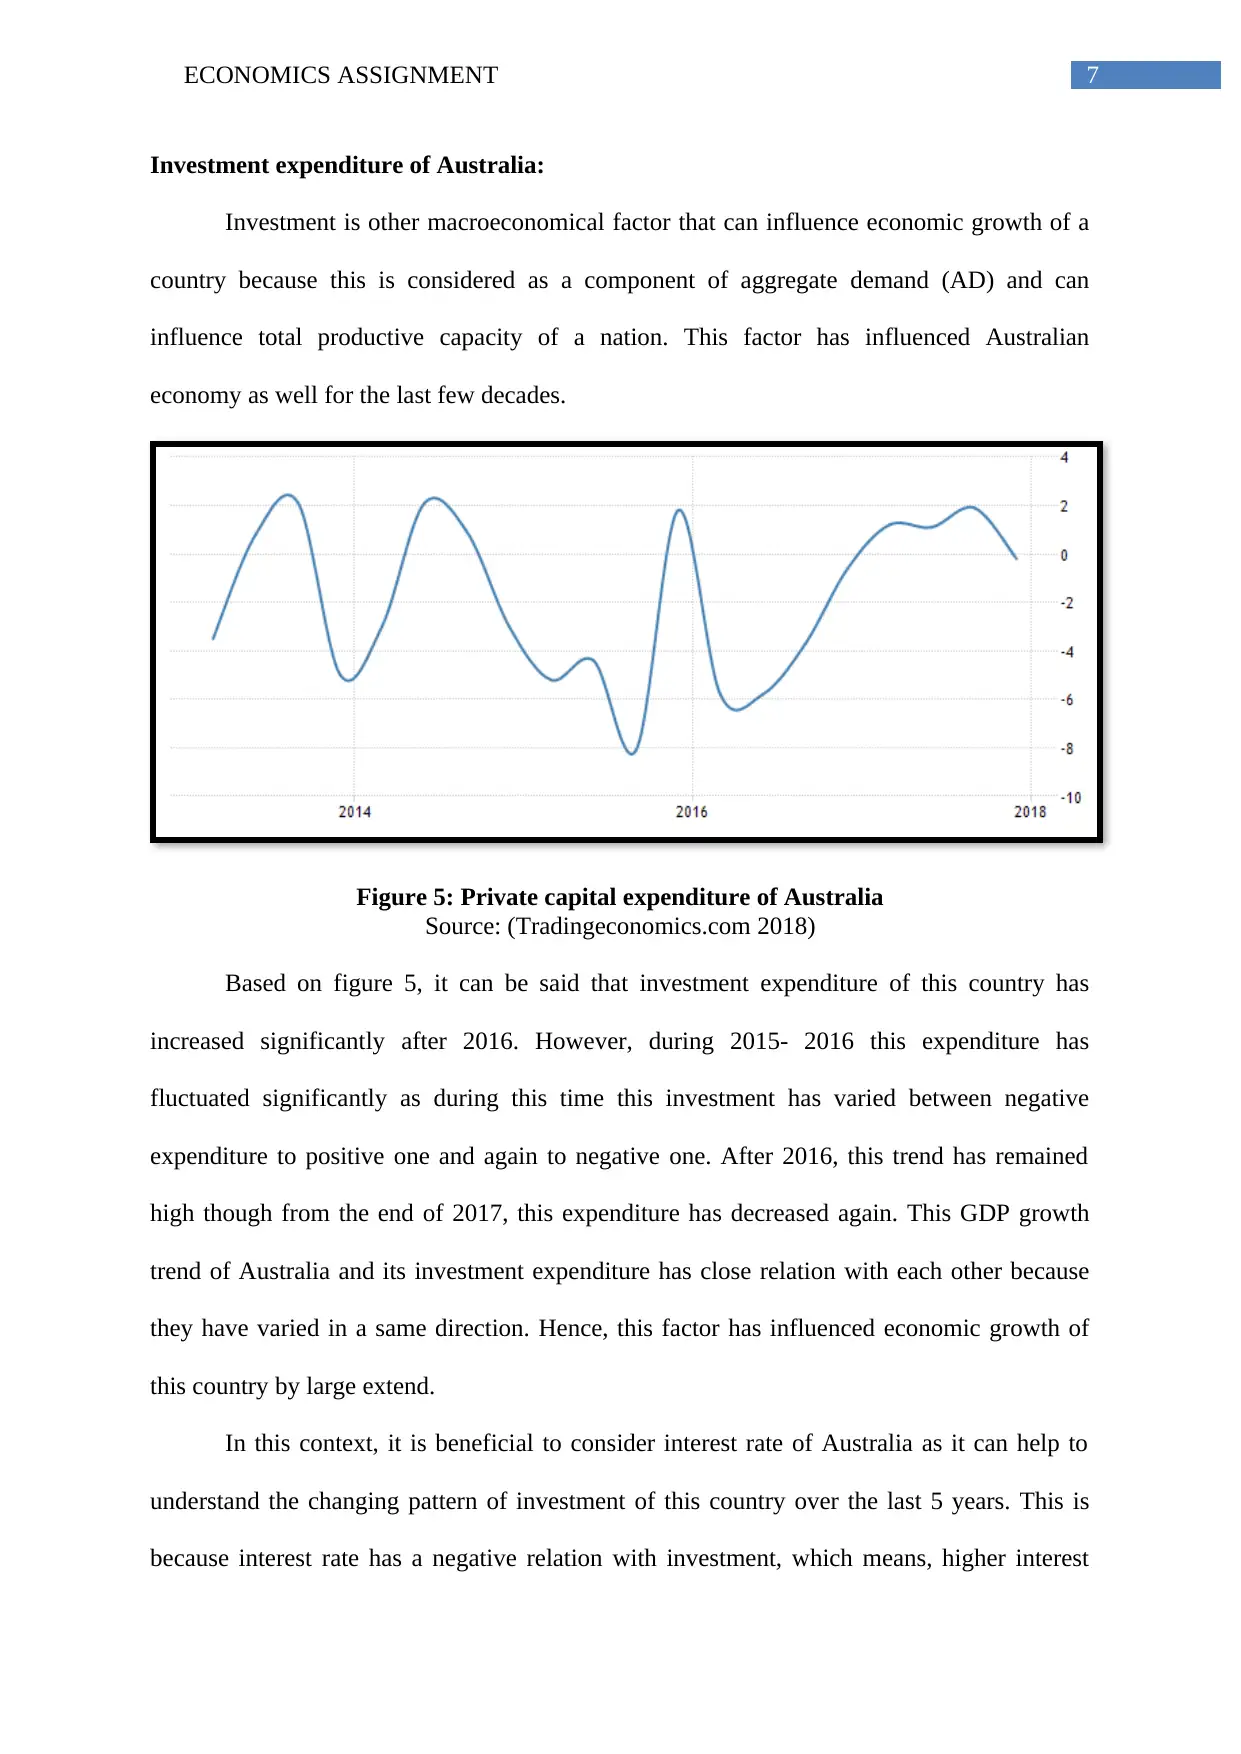
Investment expenditure of Australia:
Investment is other macroeconomical factor that can influence economic growth of a
country because this is considered as a component of aggregate demand (AD) and can
influence total productive capacity of a nation. This factor has influenced Australian
economy as well for the last few decades.
Figure 5: Private capital expenditure of Australia
Source: (Tradingeconomics.com 2018)
Based on figure 5, it can be said that investment expenditure of this country has
increased significantly after 2016. However, during 2015- 2016 this expenditure has
fluctuated significantly as during this time this investment has varied between negative
expenditure to positive one and again to negative one. After 2016, this trend has remained
high though from the end of 2017, this expenditure has decreased again. This GDP growth
trend of Australia and its investment expenditure has close relation with each other because
they have varied in a same direction. Hence, this factor has influenced economic growth of
this country by large extend.
In this context, it is beneficial to consider interest rate of Australia as it can help to
understand the changing pattern of investment of this country over the last 5 years. This is
because interest rate has a negative relation with investment, which means, higher interest
8ECONOMICS ASSIGNMENT
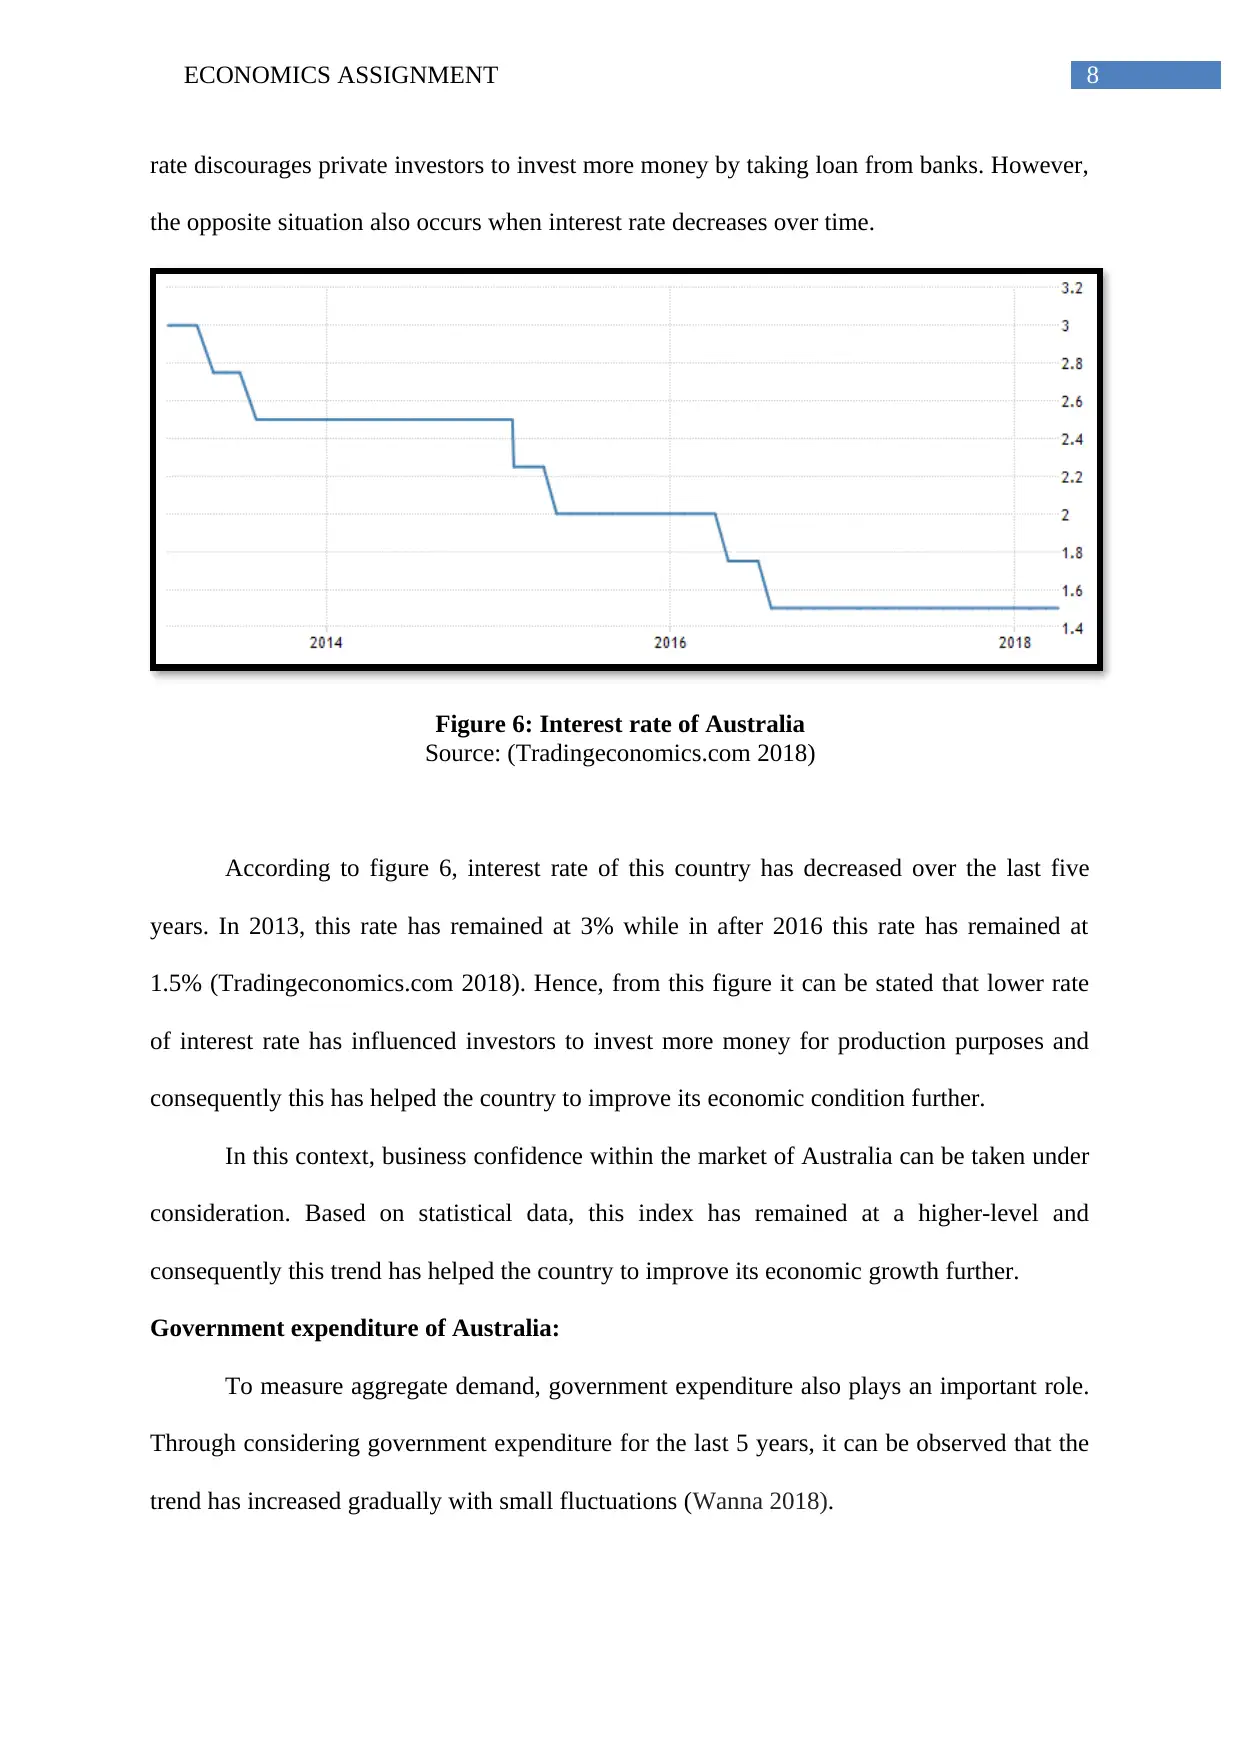
rate discourages private investors to invest more money by taking loan from banks. However,
the opposite situation also occurs when interest rate decreases over time.
Figure 6: Interest rate of Australia
Source: (Tradingeconomics.com 2018)
According to figure 6, interest rate of this country has decreased over the last five
years. In 2013, this rate has remained at 3% while in after 2016 this rate has remained at
1.5% (Tradingeconomics.com 2018). Hence, from this figure it can be stated that lower rate
of interest rate has influenced investors to invest more money for production purposes and
consequently this has helped the country to improve its economic condition further.
In this context, business confidence within the market of Australia can be taken under
consideration. Based on statistical data, this index has remained at a higher-level and
consequently this trend has helped the country to improve its economic growth further.
Government expenditure of Australia:
To measure aggregate demand, government expenditure also plays an important role.
Through considering government expenditure for the last 5 years, it can be observed that the
trend has increased gradually with small fluctuations (Wanna 2018).
⊘ This is a preview!⊘
Do you want full access?
Subscribe today to unlock all pages.
Trusted by 1+ million students worldwide
9ECONOMICS ASSIGNMENT
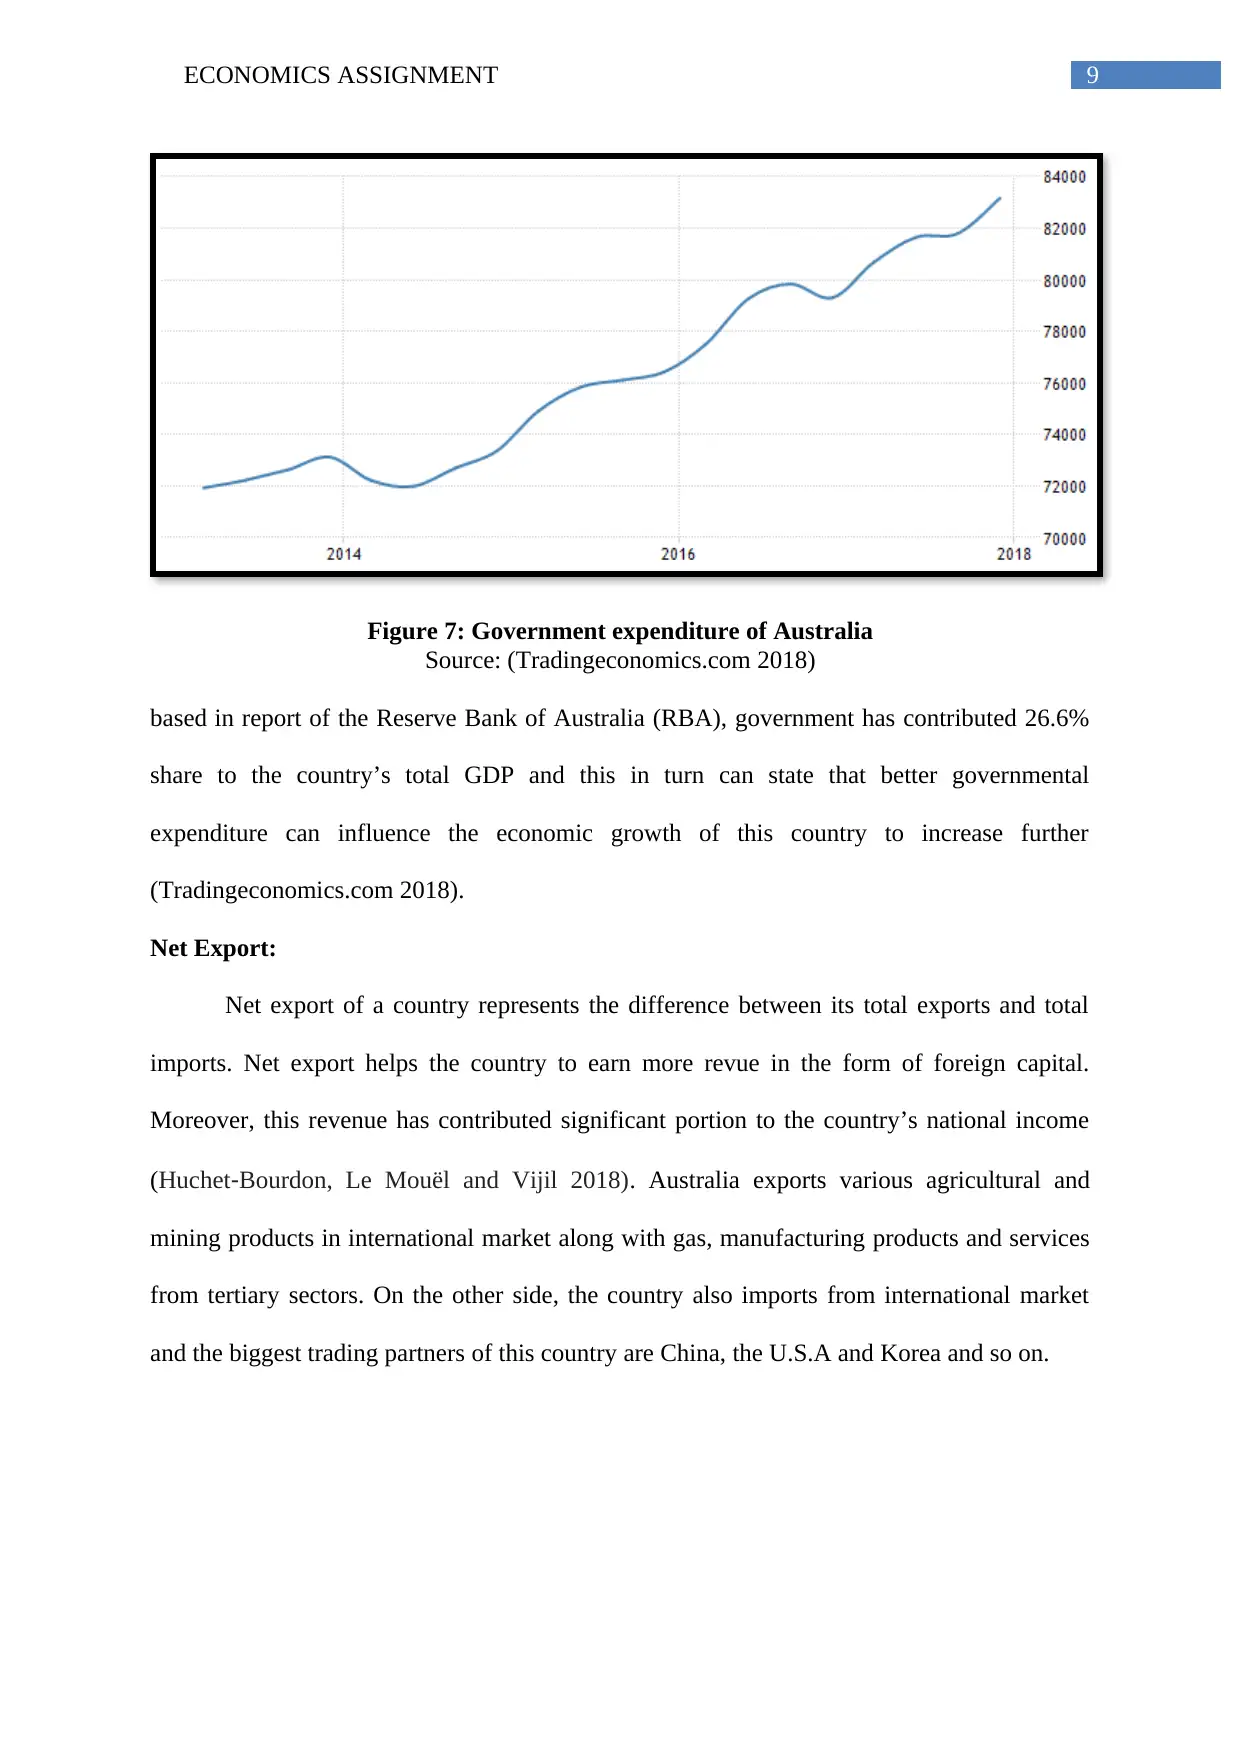
Figure 7: Government expenditure of Australia
Source: (Tradingeconomics.com 2018)
based in report of the Reserve Bank of Australia (RBA), government has contributed 26.6%
share to the country’s total GDP and this in turn can state that better governmental
expenditure can influence the economic growth of this country to increase further
(Tradingeconomics.com 2018).
Net Export:
Net export of a country represents the difference between its total exports and total
imports. Net export helps the country to earn more revue in the form of foreign capital.
Moreover, this revenue has contributed significant portion to the country’s national income
(Huchet‐Bourdon, Le Mouël and Vijil 2018). Australia exports various agricultural and
mining products in international market along with gas, manufacturing products and services
from tertiary sectors. On the other side, the country also imports from international market
and the biggest trading partners of this country are China, the U.S.A and Korea and so on.
Paraphrase This Document
Need a fresh take? Get an instant paraphrase of this document with our AI Paraphraser
10ECONOMICS ASSIGNMENT
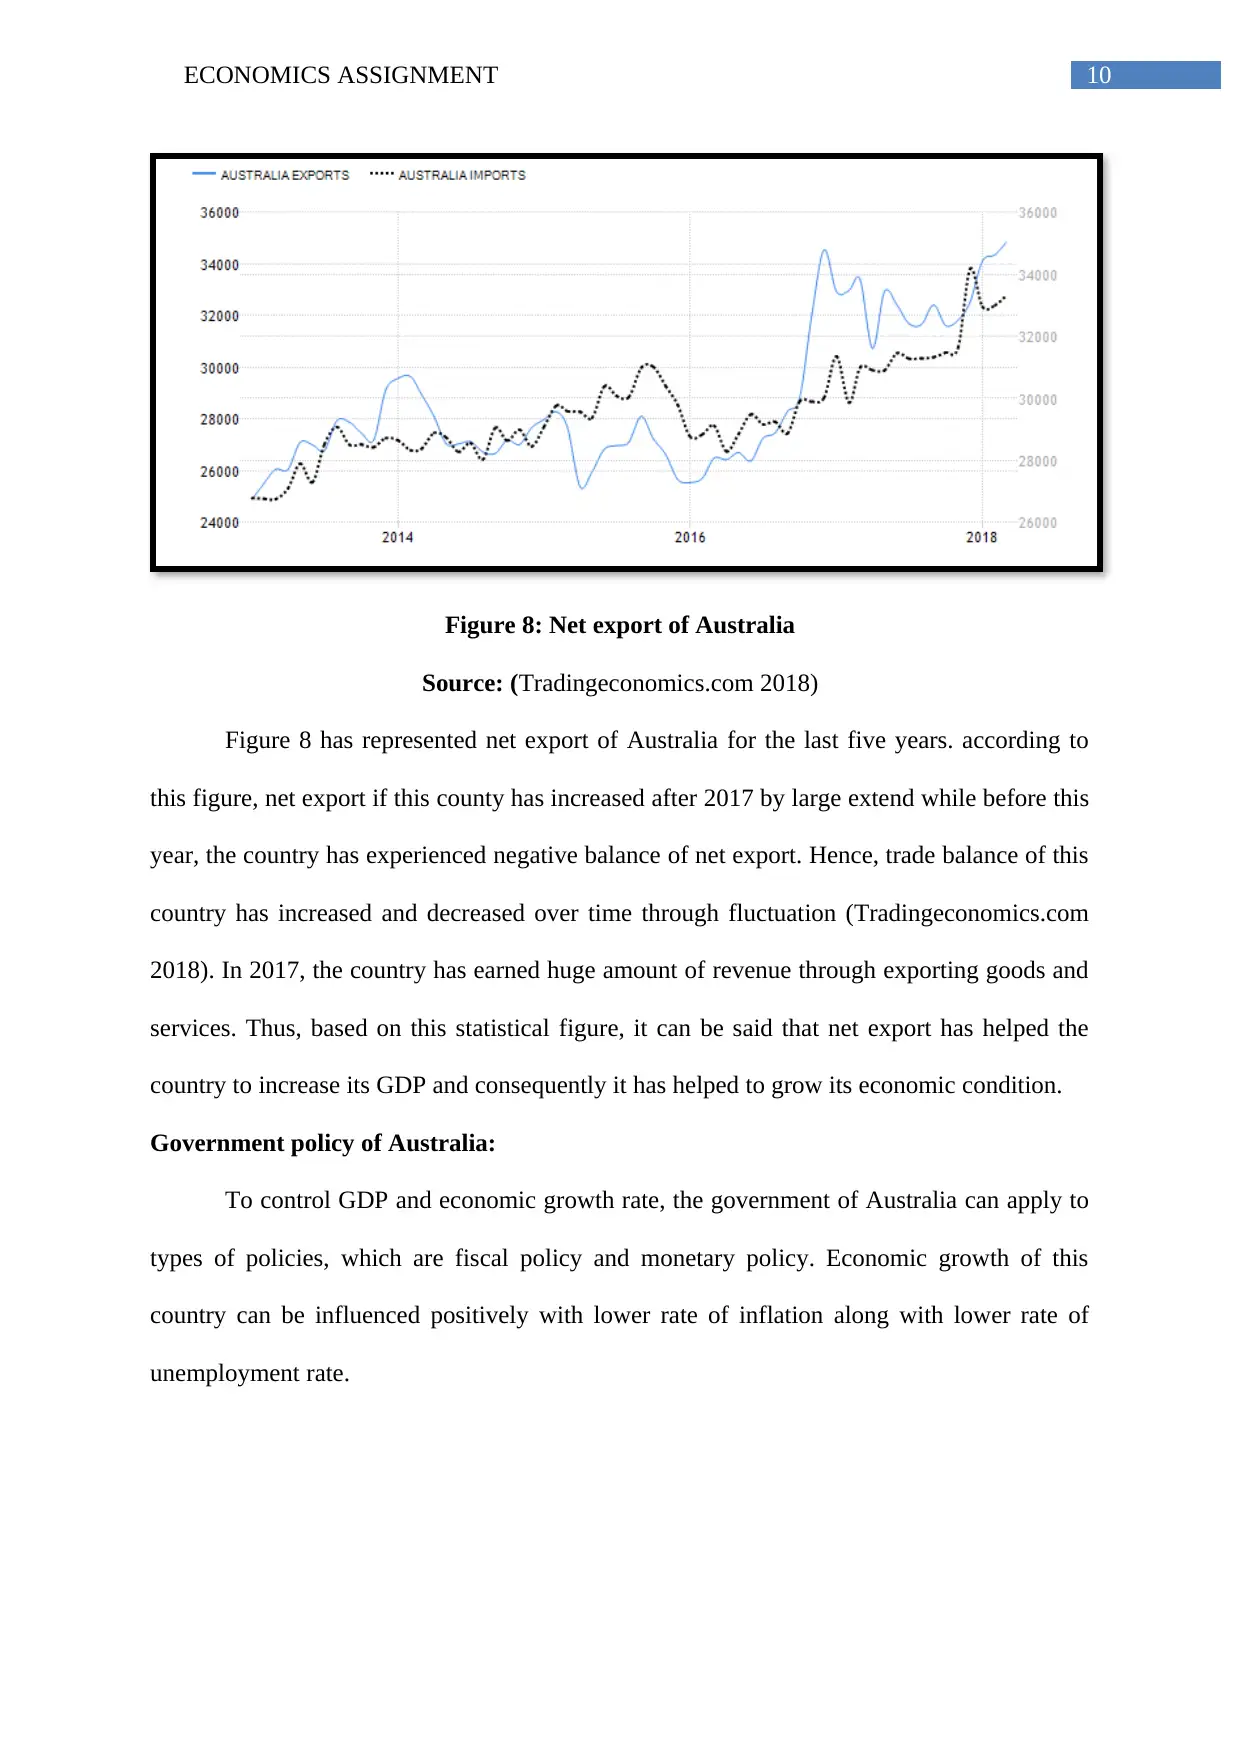
Figure 8: Net export of Australia
Source: (Tradingeconomics.com 2018)
Figure 8 has represented net export of Australia for the last five years. according to
this figure, net export if this county has increased after 2017 by large extend while before this
year, the country has experienced negative balance of net export. Hence, trade balance of this
country has increased and decreased over time through fluctuation (Tradingeconomics.com
2018). In 2017, the country has earned huge amount of revenue through exporting goods and
services. Thus, based on this statistical figure, it can be said that net export has helped the
country to increase its GDP and consequently it has helped to grow its economic condition.
Government policy of Australia:
To control GDP and economic growth rate, the government of Australia can apply to
types of policies, which are fiscal policy and monetary policy. Economic growth of this
country can be influenced positively with lower rate of inflation along with lower rate of
unemployment rate.
11ECONOMICS ASSIGNMENT
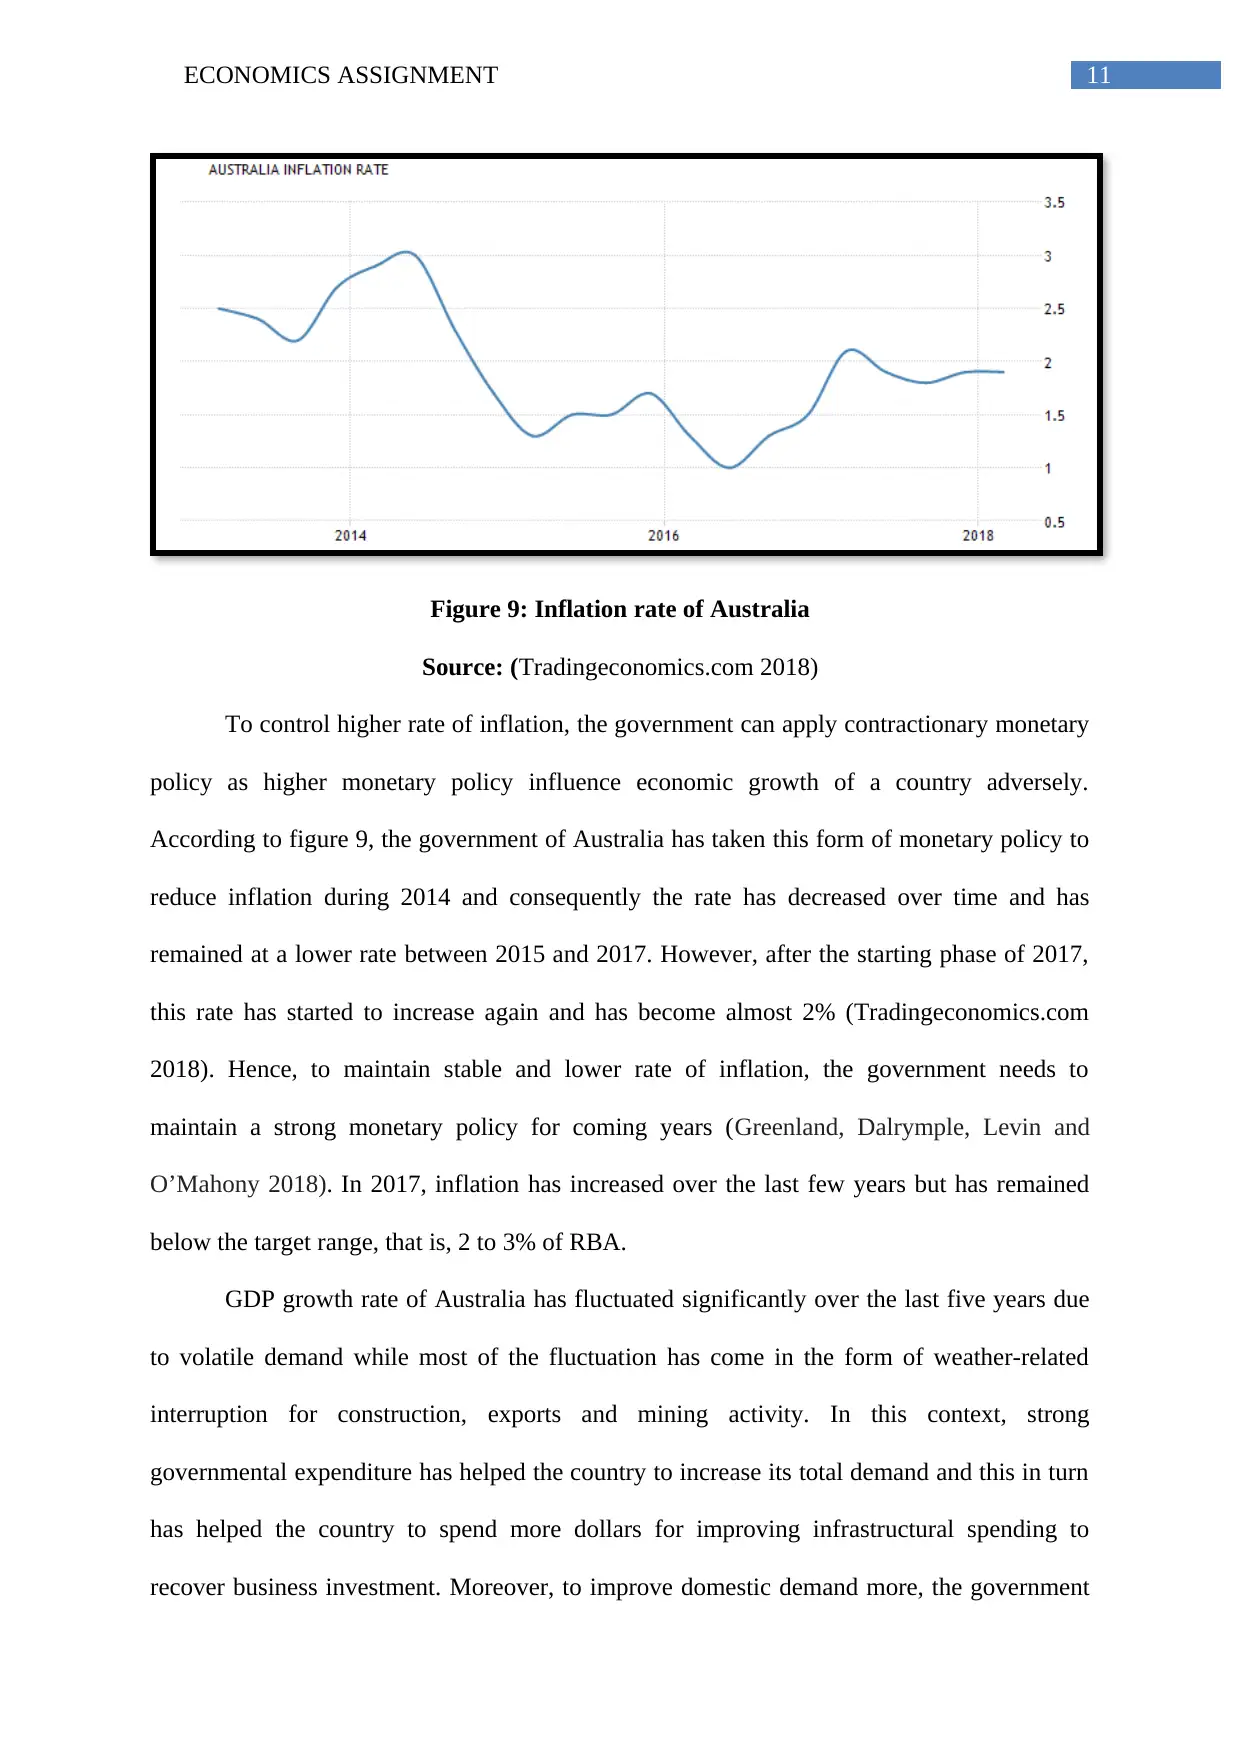
Figure 9: Inflation rate of Australia
Source: (Tradingeconomics.com 2018)
To control higher rate of inflation, the government can apply contractionary monetary
policy as higher monetary policy influence economic growth of a country adversely.
According to figure 9, the government of Australia has taken this form of monetary policy to
reduce inflation during 2014 and consequently the rate has decreased over time and has
remained at a lower rate between 2015 and 2017. However, after the starting phase of 2017,
this rate has started to increase again and has become almost 2% (Tradingeconomics.com
2018). Hence, to maintain stable and lower rate of inflation, the government needs to
maintain a strong monetary policy for coming years (Greenland, Dalrymple, Levin and
O’Mahony 2018). In 2017, inflation has increased over the last few years but has remained
below the target range, that is, 2 to 3% of RBA.
GDP growth rate of Australia has fluctuated significantly over the last five years due
to volatile demand while most of the fluctuation has come in the form of weather-related
interruption for construction, exports and mining activity. In this context, strong
governmental expenditure has helped the country to increase its total demand and this in turn
has helped the country to spend more dollars for improving infrastructural spending to
recover business investment. Moreover, to improve domestic demand more, the government
⊘ This is a preview!⊘
Do you want full access?
Subscribe today to unlock all pages.
Trusted by 1+ million students worldwide
1 out of 17
Related Documents


Your All-in-One AI-Powered Toolkit for Academic Success.
+13062052269
info@desklib.com
Available 24*7 on WhatsApp / Email
![[object Object]](/_next/static/media/star-bottom.7253800d.svg)
Unlock your academic potential
Copyright © 2020–2026 A2Z Services. All Rights Reserved. Developed and managed by ZUCOL.