Economics Report: Analyzing Time Series Data for Business Insights
VerifiedAdded on 2020/05/11
|25
|5797
|62
Report
AI Summary
This report delves into the application of time series data within the field of economics, aiming to enhance business decision-making processes. The study explores the core concepts of time series data, its crucial role in improving business strategies, and the identification of business challenges that can be addressed using this data. The report uses both time series and panel data, focusing on macroeconomic variables like GDP, inflation, and unemployment, to analyze business performance. It incorporates literature reviews, research methodologies, and data analysis techniques, including regression analysis, to demonstrate the impact of time series data on business outcomes. The ultimate goal is to provide actionable strategies for overcoming business issues and making informed decisions.

ECONOMICS-STATA
Paraphrase This Document
Need a fresh take? Get an instant paraphrase of this document with our AI Paraphraser
TABLE OF CONTENTS
INTRODUCTION......................................................................................................................1
AIM............................................................................................................................................2
OBJECTIVES............................................................................................................................2
RESEARCH QUESTIONS........................................................................................................2
BACKGROUND........................................................................................................................2
LITERATURE REVIEW...........................................................................................................3
Concept of time series data.....................................................................................................3
Role of time series data in improving business decision........................................................3
Identify issues in a business which requires the help of time series data...............................4
RESEARCH METHODOLOGY...............................................................................................4
DATA ANALYSIS....................................................................................................................6
SIGNIFICANCE OF STUDY..................................................................................................20
LIMITATION OF RESEARCH..............................................................................................20
CONCLUSION AND RECOMMENDATION.......................................................................21
REFERENCES.........................................................................................................................22
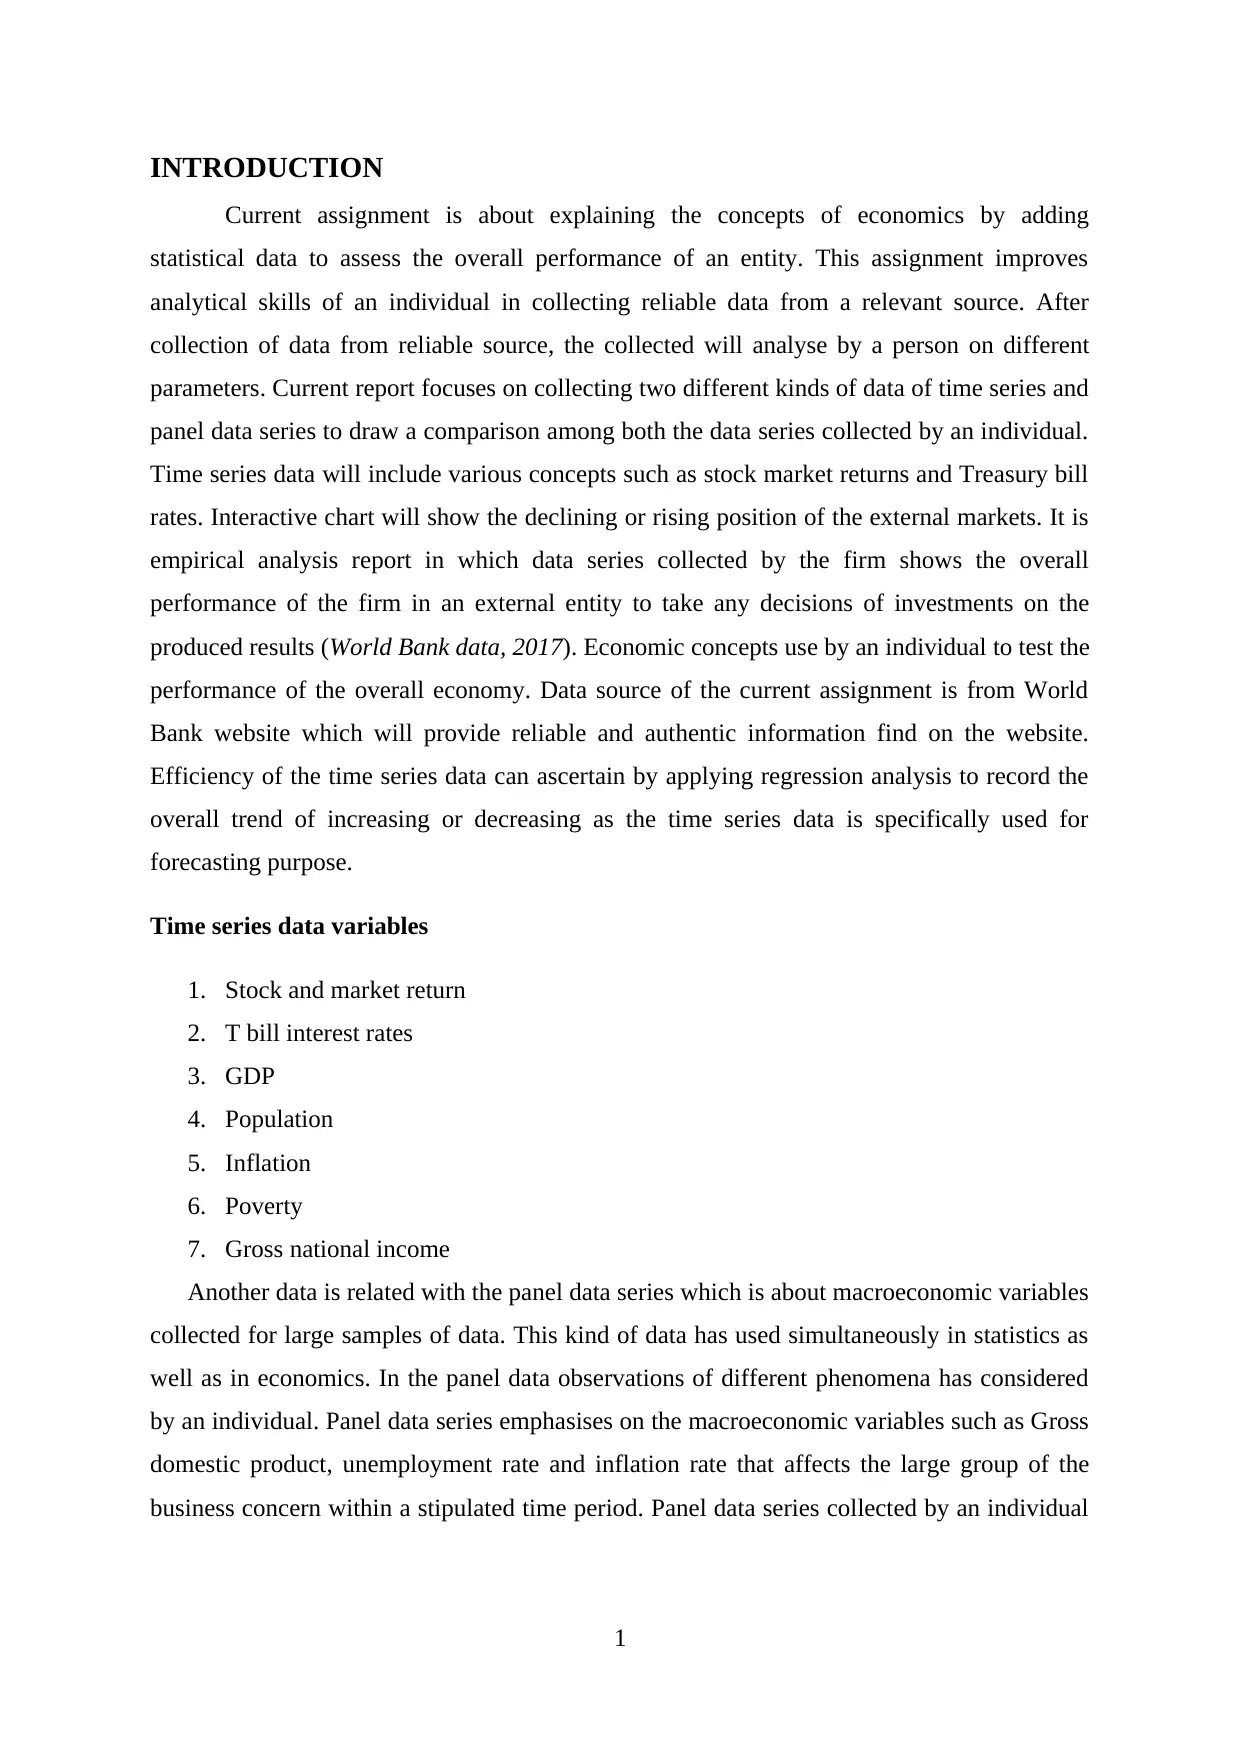
INTRODUCTION
Current assignment is about explaining the concepts of economics by adding
statistical data to assess the overall performance of an entity. This assignment improves
analytical skills of an individual in collecting reliable data from a relevant source. After
collection of data from reliable source, the collected will analyse by a person on different
parameters. Current report focuses on collecting two different kinds of data of time series and
panel data series to draw a comparison among both the data series collected by an individual.
Time series data will include various concepts such as stock market returns and Treasury bill
rates. Interactive chart will show the declining or rising position of the external markets. It is
empirical analysis report in which data series collected by the firm shows the overall
performance of the firm in an external entity to take any decisions of investments on the
produced results (World Bank data, 2017). Economic concepts use by an individual to test the
performance of the overall economy. Data source of the current assignment is from World
Bank website which will provide reliable and authentic information find on the website.
Efficiency of the time series data can ascertain by applying regression analysis to record the
overall trend of increasing or decreasing as the time series data is specifically used for
forecasting purpose.
Time series data variables
1. Stock and market return
2. T bill interest rates
3. GDP
4. Population
5. Inflation
6. Poverty
7. Gross national income
Another data is related with the panel data series which is about macroeconomic variables
collected for large samples of data. This kind of data has used simultaneously in statistics as
well as in economics. In the panel data observations of different phenomena has considered
by an individual. Panel data series emphasises on the macroeconomic variables such as Gross
domestic product, unemployment rate and inflation rate that affects the large group of the
business concern within a stipulated time period. Panel data series collected by an individual
1
⊘ This is a preview!⊘
Do you want full access?
Subscribe today to unlock all pages.
Trusted by 1+ million students worldwide
helps in tracking the overall performance of the firm by identifying all the issues to get rid of
all of them in a given span of time.
This report has two parts one part is collection of data and another part is about research
project based on one of the collected data. Research report is based on resolving the
macroeconomic problem in the business by utilizing the collected data. Literature review is
conducted on different objectives framed on the basis of the aims of the current research
project.
AIM
To improve the decisions making in business with the help of time series data
OBJECTIVES
To determine the concepts of time series data
To illustrate the role of time series data in improving business decisions
To ascertain the business issues which demand the support of time series data
Suggest some strategies to overcome the issues faced by an entity
RESEARCH QUESTIONS
What is the concept of Time series data?
Explain the role of time series data in improving business decisions?
Identify business issues which demand the support of time series data?
Recommend some strategies to overcome the issues faced by an entity.
BACKGROUND
Present research study is all about explaining the business issues by using the time
series data in which an individual will identify all the problems faced by them in an entity to
eliminate the same by taking corrective action (Qiu, Ren, Suganthan and Amaratunga, 2017).
A business environment is a mixtures of various elements that effects the external entity and
do affect but the actions of all the players located in a similar industry or market segment. An
enterprise owner plays a significant role in a business as they held responsible for boosting or
suppressing their current earnings by making correct decisions in a business. Correct
decisions is the basis secret behind the success of the venture through which individuals can
boost up their earnings by taking decisions in the favour of all the stakeholders o the business
concern.
2
Paraphrase This Document
Need a fresh take? Get an instant paraphrase of this document with our AI Paraphraser
Every business has flaws and strengths which need to be identify by the owner to get
successful as analyzing its own weaknesses is the most important decisions taken by an entity
(Deb, Zhang, Yang, Lee and Shah, 2017). Management must analyse their strength and
weaknesses to grab all the external opportunities by eliminating all the threats takes places in
the external business environment. Time series data is related with the time period as data
collected by an entity owner according to specific time period. It includes various
components such as Gross domestic product, inflation rate, increasing or decreasing
population. By analyzing all the factors of time series data an entity owner can ascertain its
overall performance within a given span of time as their motive is achieve the desired goals
and the objectives of an entity (Nogi and et.al., 2017). Time series analysis conducted by an
individual to show the increasing or declining trend of the business performance of the
business concern by focusing on all the important business areas in improving the overall
performance of the business concern within a given span of time.
LITERATURE REVIEW
Concept of time series data
Chatfield, (2016) has asserted that time series data selected by an individual in the
current research will give new direction to the entire research study that helps in collecting
suitable and reliable data that meet all the criteria created by an individual. Time series data
has used by an individual in predicting the future performance of the business as the
decisions of investment has based on evaluating the gross domestic product of all the
countries in the world (Leimbach, Kriegler, Roming and Schwanitz, 2017). Higher gross
domestic product generated by the countries shows their efficiency as compared to different
countries in the whole world.
Brockwell and Davis, (2016) states that time series analysis used by a person to
present all the data points as different variables in showcasing the overall performance of the
business concern within a given span of time. Line chart is the best suitable visual technique
in presenting the increasing or decreasing trend of inflation which needs to be identified at
the later stage to secure the position of the business in the external entity (Zolotoy,
Frederickson and Lyon, 2017).
Role of time series data in improving business decision
According to the study of Zucchini, MacDonald and Langrock, (2016) time series
data play an integral role in improving the business decisions as in the current dynamic world
3
it acts as a data mining tool. Data mining tool utilizes time series data in understanding the
inflation patterns in assessing the overall trend of inflation in the external market segment
(Talay, Akdeniz and Kirca, 2017). It is one of the analytical tool that consider gross domestic
and gross national income that helps in analyzing the income and revenues as against the
expenses incurred in a business to know the capability of firm in paying its debts by utilizing
all their income in particular time period.
Tanaka, K., 2017) suggested that knowing about the population of all the countries in
a world help in knowing the potential target market in which the investors will launch their
business to boost up its earnings. Time series data acts as a business proposal that illustrates
all the strengths, weaknesses, threats and opportunities.
Identify issues in a business which requires the help of time series data
From the point of view of Schmitt and Huang, (2016) uncertainty in business is
inherent risk which will not be eliminated as it can be minimize by taking corrective actions
before the occurrence of risks in an entity. Business uncertainties are recession, higher
inflation rate, poverty, unemployment. All these variables are part of business uncertainty
which can be predicted by an individual by taking the help of time series of data. Decision
making process can get successful by focussing on the strengths of the firm by keeping watch
on all the external market changes as a faithful dog (Shmueli, and et. al., 2017).
Personification has used to explain the qualities of dog which is required in increasing
determined targets of the firm (NCD Risk Factor Collaboration, 2017). Another business
issue is to overcome all the threats that are merger and acquisition risks faced by an entity
due to sudden bankruptcy of the business (Chong and et. al., 2017).
RESEARCH METHODOLOGY
Research methodology plays an integral role in conducting a particular research study
in which the researcher focuses on collecting data for an appropriate research study. It gives
right direction to a study that helps in collecting relevant facts and figures that meets all the
criteria’s of a particular research (Waljee and et.al., 2017). Research methodology acts a like
a compass that gives right direction to the research study. Various approaches and research
types helps an individual in collecting the best suitable data meets all the requirements of the
business.
4
⊘ This is a preview!⊘
Do you want full access?
Subscribe today to unlock all pages.
Trusted by 1+ million students worldwide
Research approach- Research approach is an important technique that helps in collecting
authentic and reliable data after analyzing the nature of the research study (Ramirez Cohen
and et. al., 2017). There are three different kinds of research approaches such as deductive,
inductive research approaches in refining all the collected data by an individual. Inductive
approach is suitable in that research kind in which hypothesis of the research is related to
generalizing the terms from general to the specific nature of the overall study (Meshram and
Prabhune, 2017). In this approach, verification is given more preferences by analyzing the
overall data by using several parameters to tests the efficiency of the selected data by an
individual in concluding the overall research (Pearson and Raphael, 2017). Inductive
approach has applicable in the current research in which the researcher tries to generalize the
research study and its hypothesis from general to specific to conclude the current research to
accomplish the desired aims and the objectives framed by an enterprise within a given span
of time.
Research type- There are two kinds of research such as qualitative as well as quantitative
research type which an individual selects according to their convenience (Obenauer, Quinn,
Li and Joyner, 2017). Qualitative research is related with theoretical concepts used in a
research in which the researcher collects fact and information to develop a theory that helps
in overcoming all the issues faced by an individual.
On the other hand, Quantitative research kind is about analyzing the collected data
and numerical to take the best suitable decisions in the favour of an entity (Elhorst, 2017).
Researcher tries to do justice with the nature of the research study as they held responsible for
concluding wrong research as the current research will form basis in the future for authors to
start their fresh research (Bacci, 2017). Improving the business decisions is both qualitative
as well as quantitative research but in the current research, time series data sets are utilized to
get rid of all the issues faced by an individual in an entity which will be resolved within a
given span of time.
` Apart from qualitative and quantitative research type, there are two other research
types such as primary research as well as secondary research conducted by an individual.
Primary research is considered by an entity in case of small sample size along with a need to
gather authentic and reliable set of data (Kiviet, Pleus and Poldermans, 2017). On another
hand, Secondary research is that kind of research in which data has gathered by a person with
the help of books and journals, news articles, magazines and internet as the biggest source of
5
Paraphrase This Document
Need a fresh take? Get an instant paraphrase of this document with our AI Paraphraser
information. Internet is one of the important sources of information which provides different
sets of data within a few seconds in the current technology world; an individual will gather
large samples of data in less period of time.
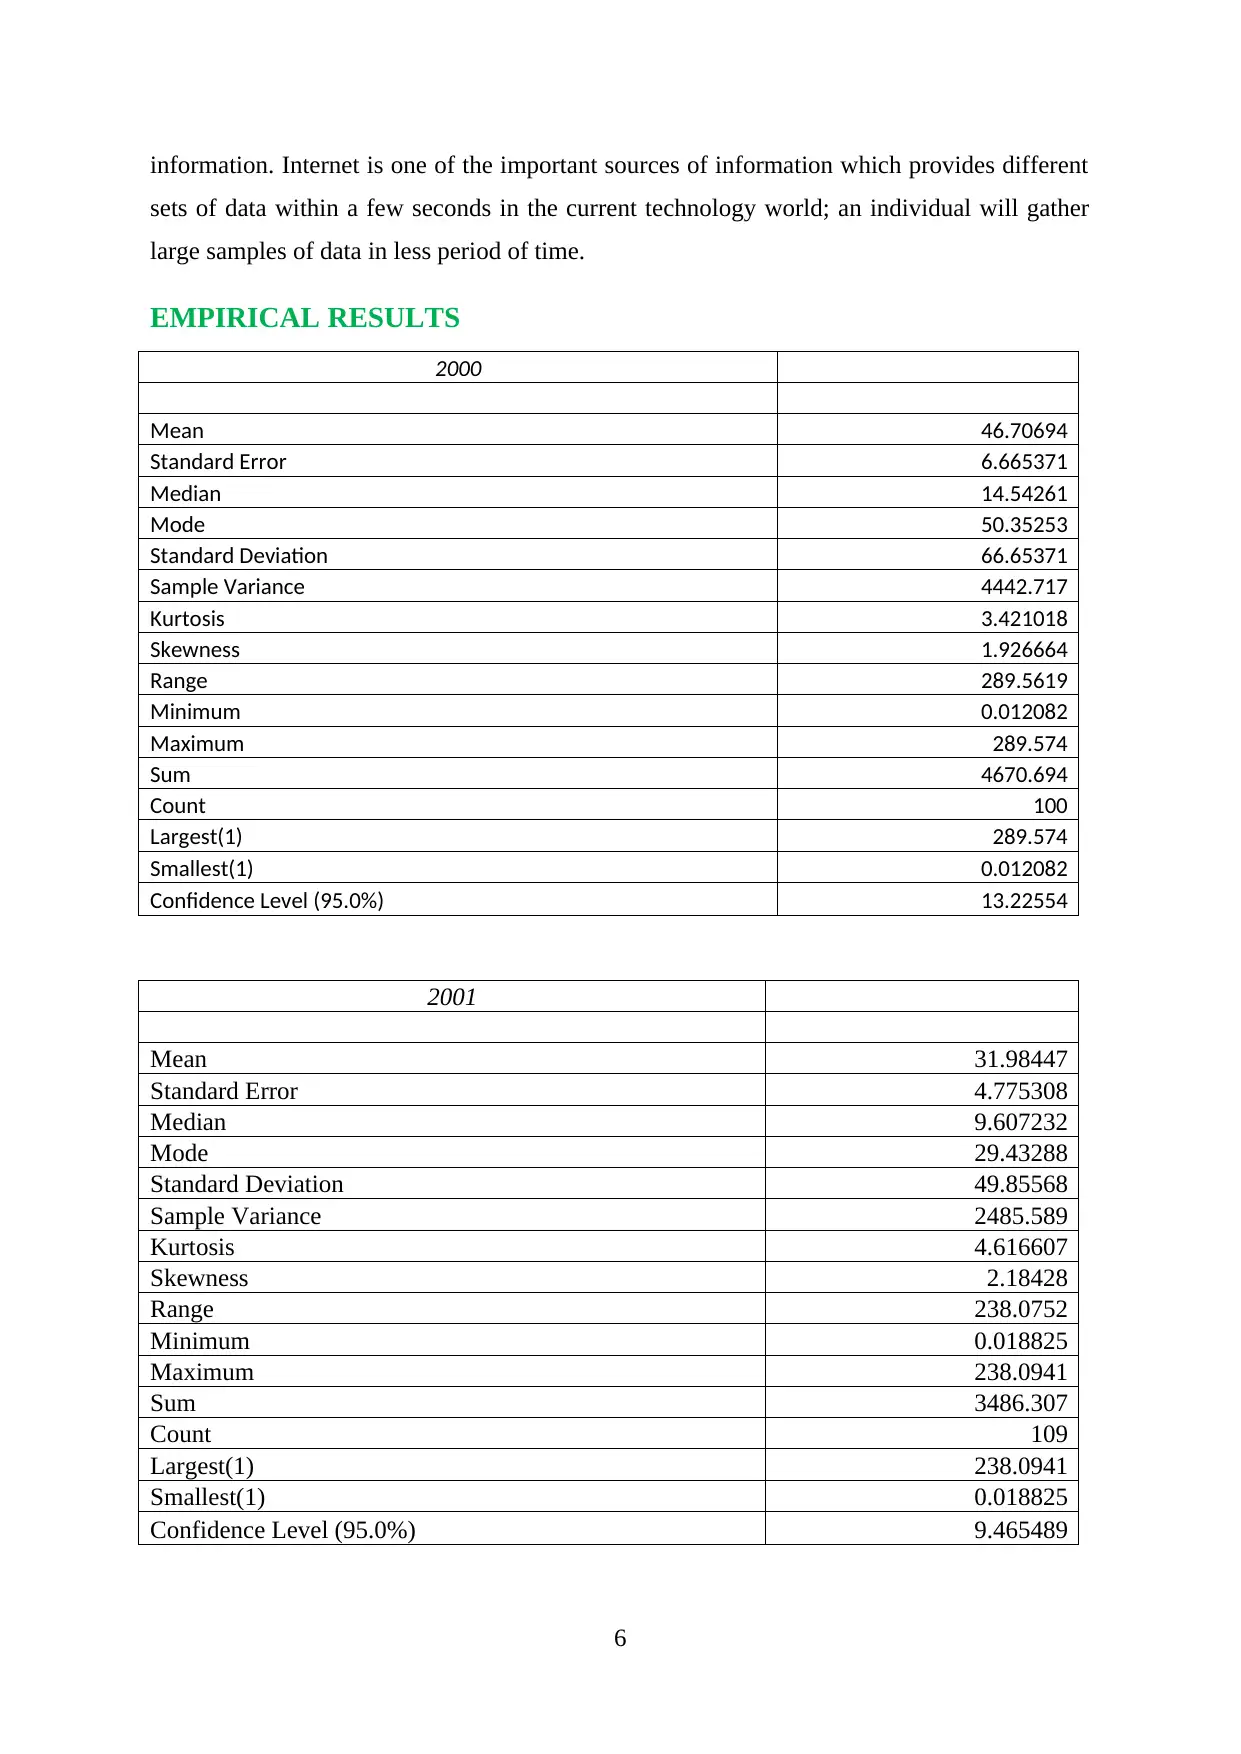
EMPIRICAL RESULTS
2000
Mean 46.70694
Standard Error 6.665371
Median 14.54261
Mode 50.35253
Standard Deviation 66.65371
Sample Variance 4442.717
Kurtosis 3.421018
Skewness 1.926664
Range 289.5619
Minimum 0.012082
Maximum 289.574
Sum 4670.694
Count 100
Largest(1) 289.574
Smallest(1) 0.012082
Confidence Level (95.0%) 13.22554
2001
Mean 31.98447
Standard Error 4.775308
Median 9.607232
Mode 29.43288
Standard Deviation 49.85568
Sample Variance 2485.589
Kurtosis 4.616607
Skewness 2.18428
Range 238.0752
Minimum 0.018825
Maximum 238.0941
Sum 3486.307
Count 109
Largest(1) 238.0941
Smallest(1) 0.018825
Confidence Level (95.0%) 9.465489
6
sets of data within a few seconds in the current technology world; an individual will gather
large samples of data in less period of time.
EMPIRICAL RESULTS
2000
Mean 46.70694
Standard Error 6.665371
Median 14.54261
Mode 50.35253
Standard Deviation 66.65371
Sample Variance 4442.717
Kurtosis 3.421018
Skewness 1.926664
Range 289.5619
Minimum 0.012082
Maximum 289.574
Sum 4670.694
Count 100
Largest(1) 289.574
Smallest(1) 0.012082
Confidence Level (95.0%) 13.22554
2001
Mean 31.98447
Standard Error 4.775308
Median 9.607232
Mode 29.43288
Standard Deviation 49.85568
Sample Variance 2485.589
Kurtosis 4.616607
Skewness 2.18428
Range 238.0752
Minimum 0.018825
Maximum 238.0941
Sum 3486.307
Count 109
Largest(1) 238.0941
Smallest(1) 0.018825
Confidence Level (95.0%) 9.465489
6
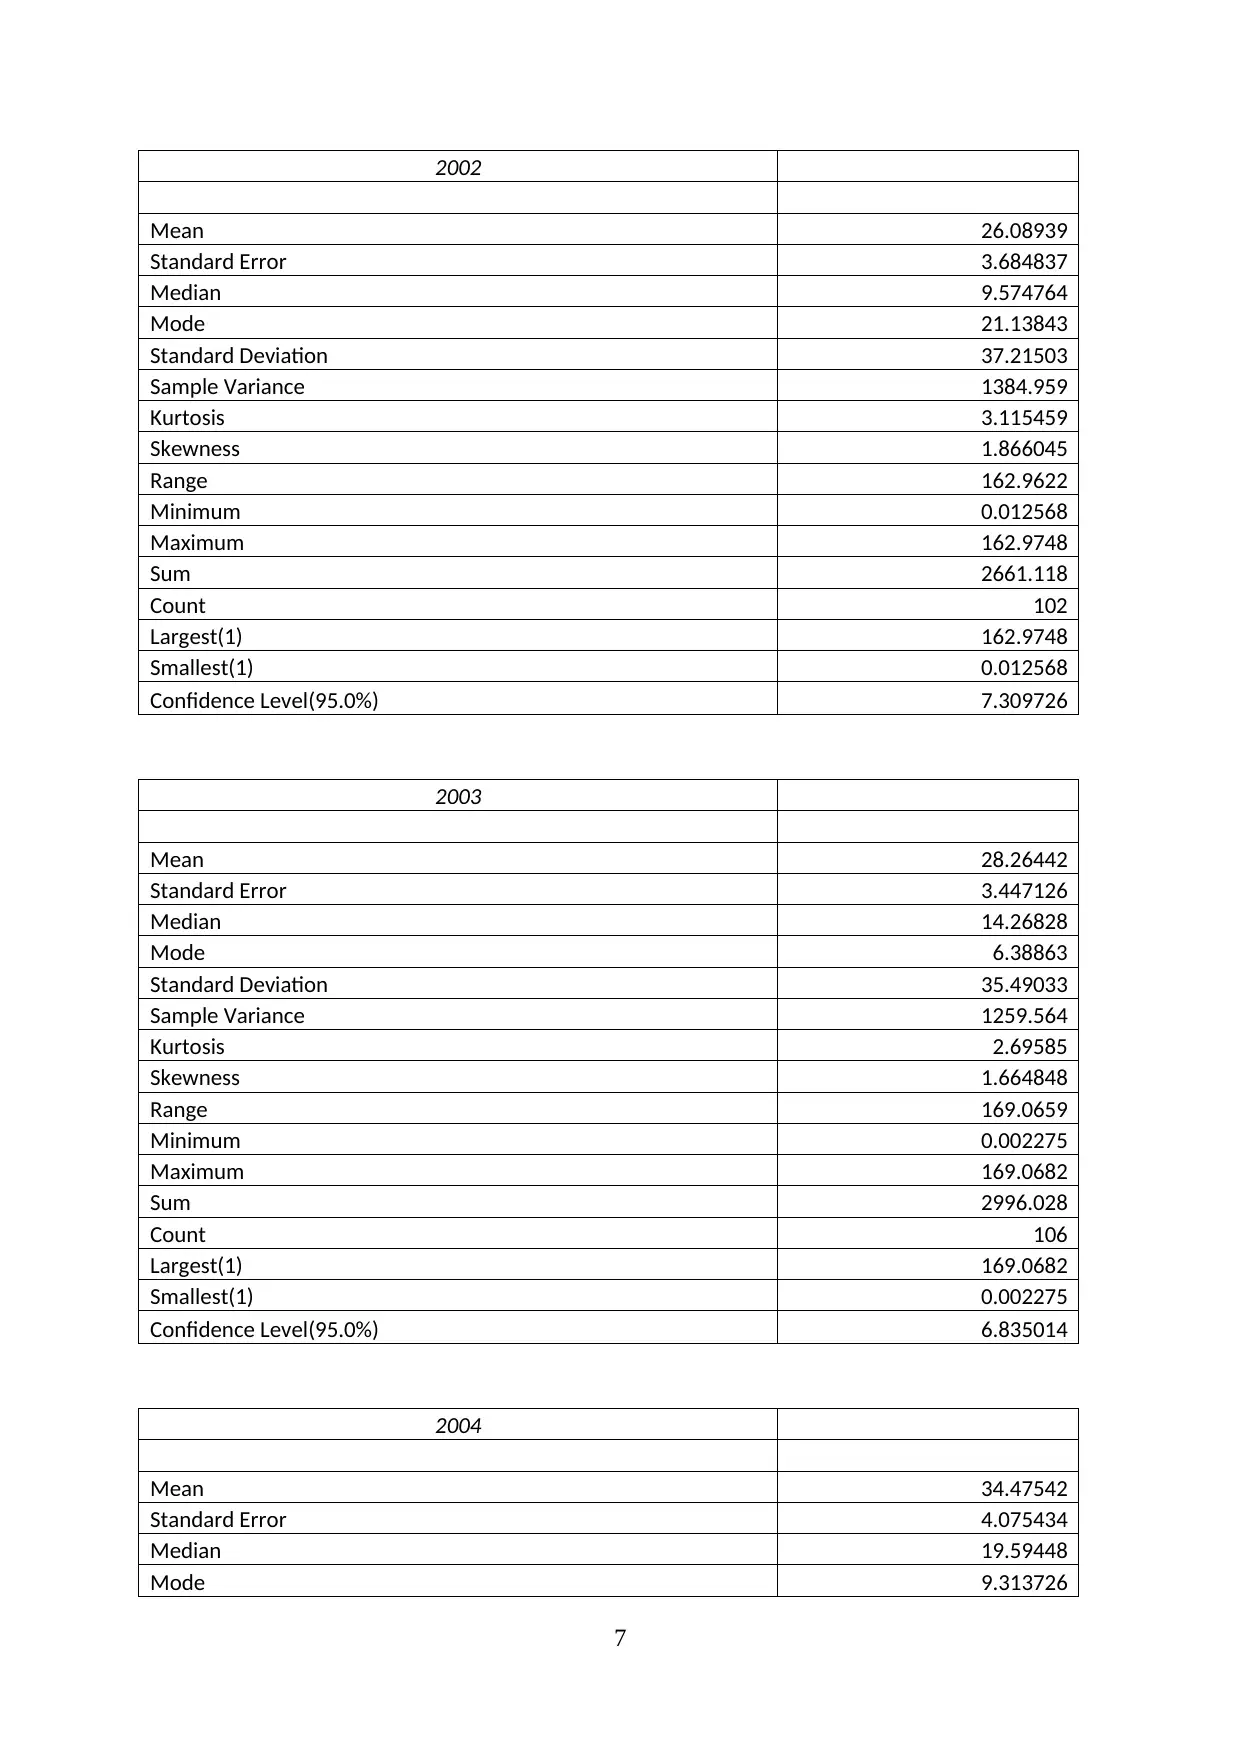
2002
Mean 26.08939
Standard Error 3.684837
Median 9.574764
Mode 21.13843
Standard Deviation 37.21503
Sample Variance 1384.959
Kurtosis 3.115459
Skewness 1.866045
Range 162.9622
Minimum 0.012568
Maximum 162.9748
Sum 2661.118
Count 102
Largest(1) 162.9748
Smallest(1) 0.012568
Confidence Level(95.0%) 7.309726
2003
Mean 28.26442
Standard Error 3.447126
Median 14.26828
Mode 6.38863
Standard Deviation 35.49033
Sample Variance 1259.564
Kurtosis 2.69585
Skewness 1.664848
Range 169.0659
Minimum 0.002275
Maximum 169.0682
Sum 2996.028
Count 106
Largest(1) 169.0682
Smallest(1) 0.002275
Confidence Level(95.0%) 6.835014
2004
Mean 34.47542
Standard Error 4.075434
Median 19.59448
Mode 9.313726
7
⊘ This is a preview!⊘
Do you want full access?
Subscribe today to unlock all pages.
Trusted by 1+ million students worldwide
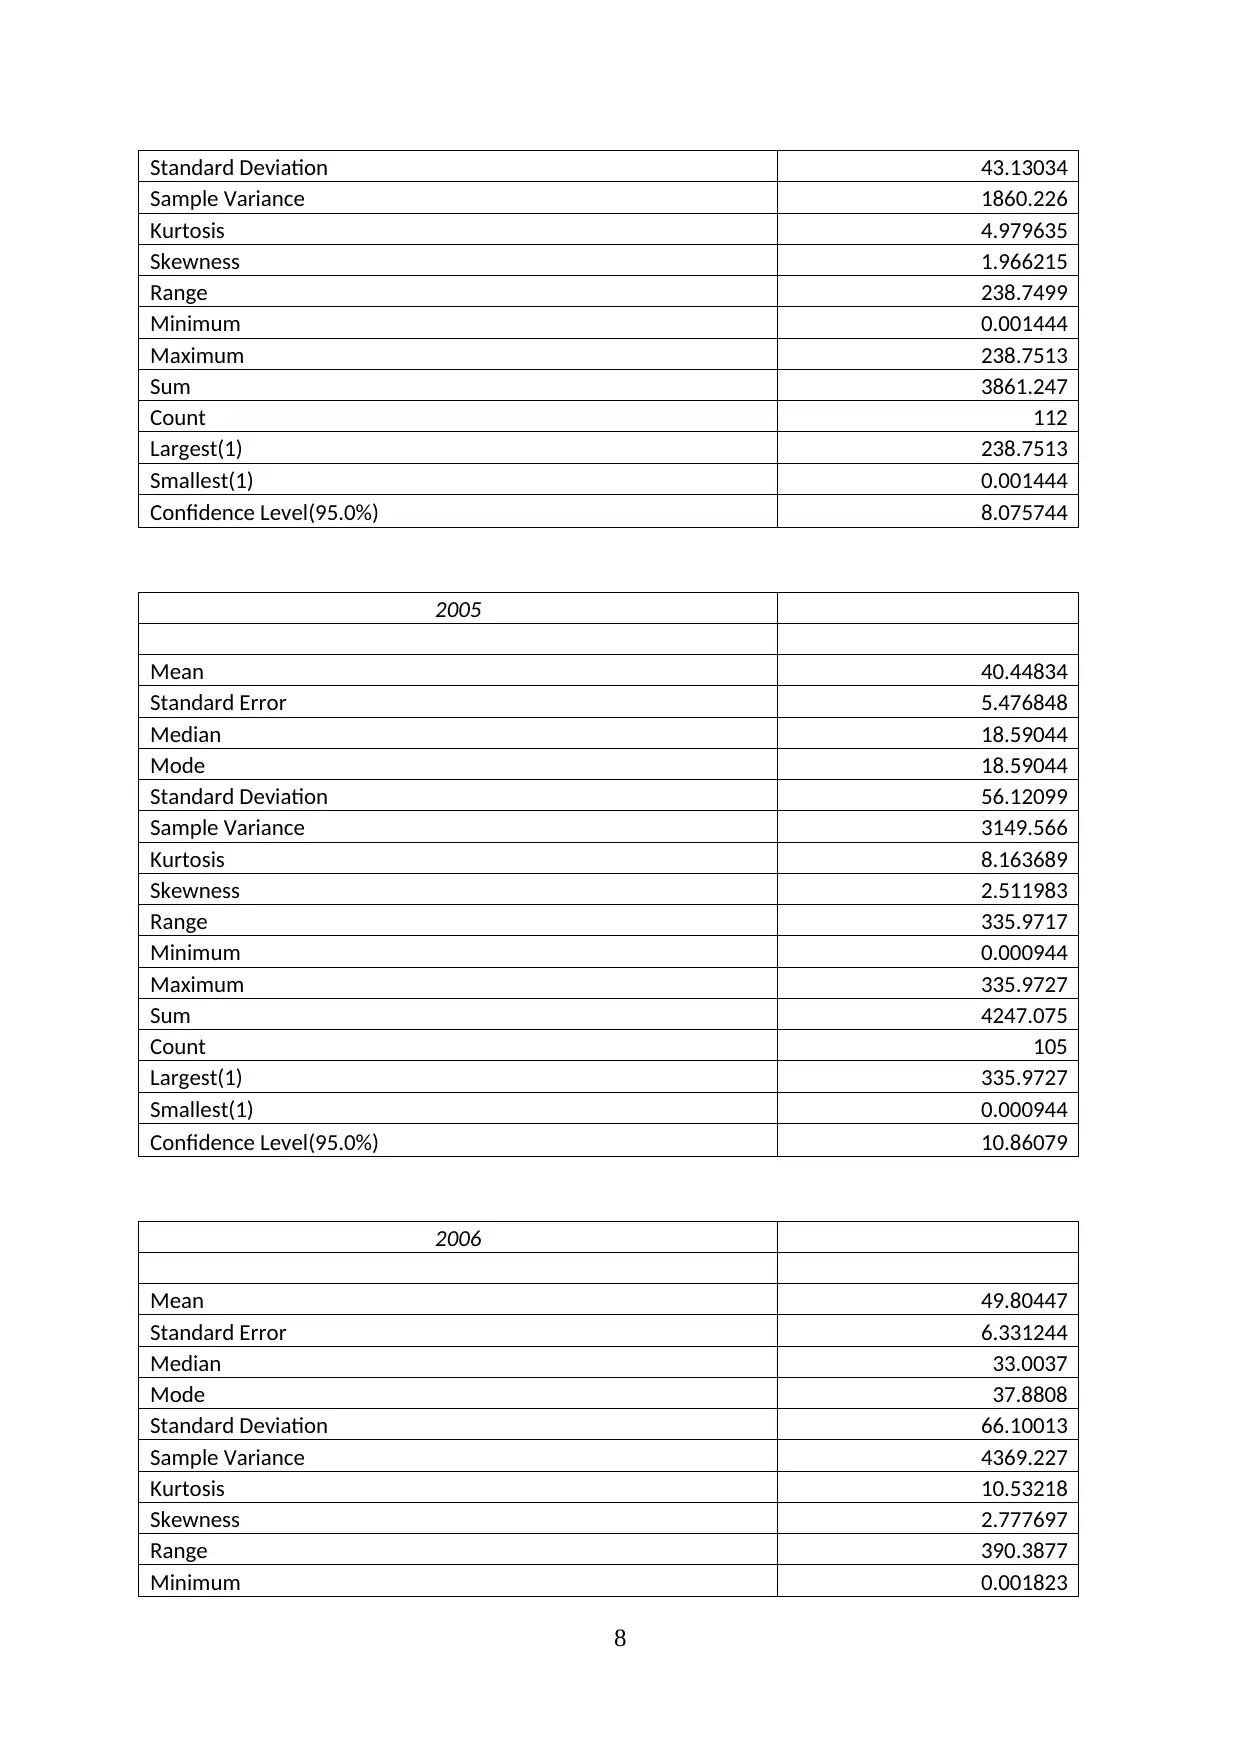
Standard Deviation 43.13034
Sample Variance 1860.226
Kurtosis 4.979635
Skewness 1.966215
Range 238.7499
Minimum 0.001444
Maximum 238.7513
Sum 3861.247
Count 112
Largest(1) 238.7513
Smallest(1) 0.001444
Confidence Level(95.0%) 8.075744
2005
Mean 40.44834
Standard Error 5.476848
Median 18.59044
Mode 18.59044
Standard Deviation 56.12099
Sample Variance 3149.566
Kurtosis 8.163689
Skewness 2.511983
Range 335.9717
Minimum 0.000944
Maximum 335.9727
Sum 4247.075
Count 105
Largest(1) 335.9727
Smallest(1) 0.000944
Confidence Level(95.0%) 10.86079
2006
Mean 49.80447
Standard Error 6.331244
Median 33.0037
Mode 37.8808
Standard Deviation 66.10013
Sample Variance 4369.227
Kurtosis 10.53218
Skewness 2.777697
Range 390.3877
Minimum 0.001823
8
Paraphrase This Document
Need a fresh take? Get an instant paraphrase of this document with our AI Paraphraser
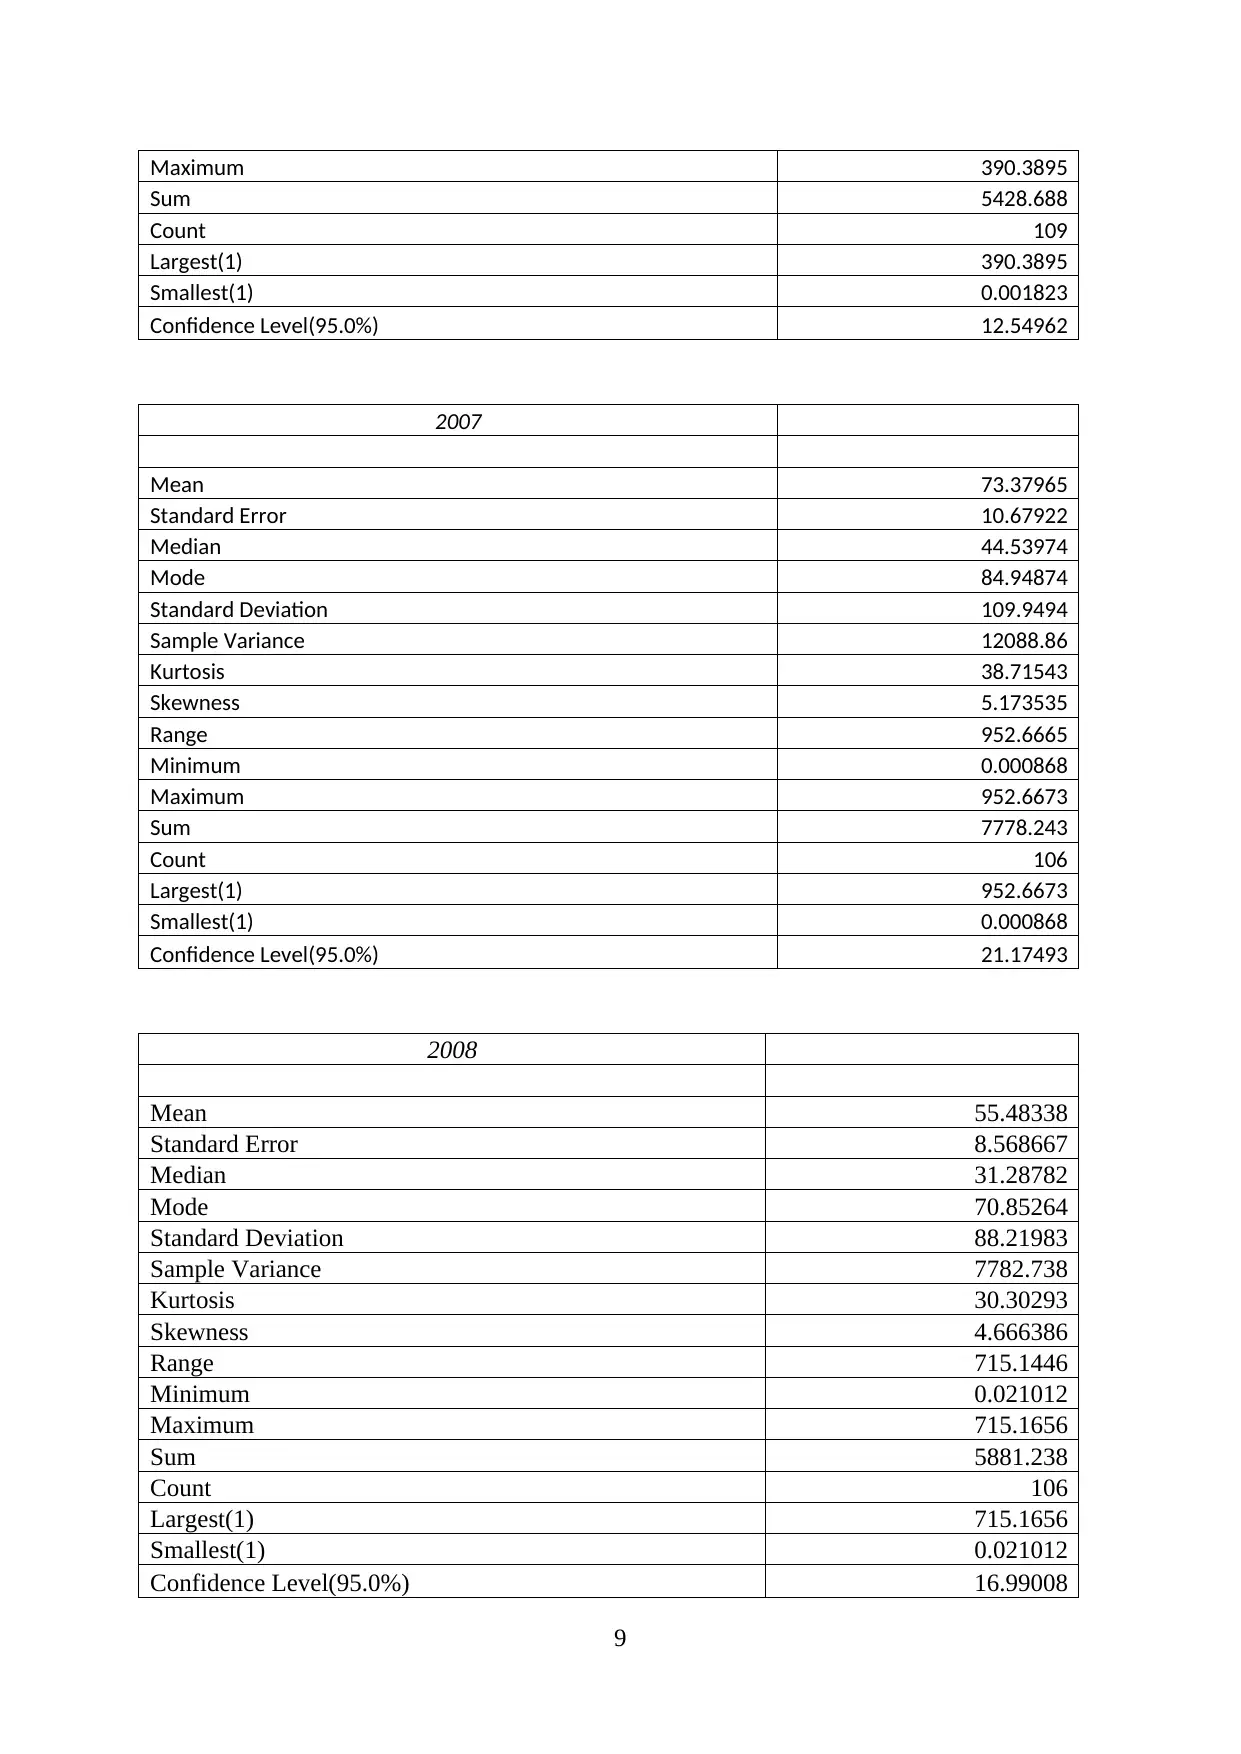
Maximum 390.3895
Sum 5428.688
Count 109
Largest(1) 390.3895
Smallest(1) 0.001823
Confidence Level(95.0%) 12.54962
2007
Mean 73.37965
Standard Error 10.67922
Median 44.53974
Mode 84.94874
Standard Deviation 109.9494
Sample Variance 12088.86
Kurtosis 38.71543
Skewness 5.173535
Range 952.6665
Minimum 0.000868
Maximum 952.6673
Sum 7778.243
Count 106
Largest(1) 952.6673
Smallest(1) 0.000868
Confidence Level(95.0%) 21.17493
2008
Mean 55.48338
Standard Error 8.568667
Median 31.28782
Mode 70.85264
Standard Deviation 88.21983
Sample Variance 7782.738
Kurtosis 30.30293
Skewness 4.666386
Range 715.1446
Minimum 0.021012
Maximum 715.1656
Sum 5881.238
Count 106
Largest(1) 715.1656
Smallest(1) 0.021012
Confidence Level(95.0%) 16.99008
9
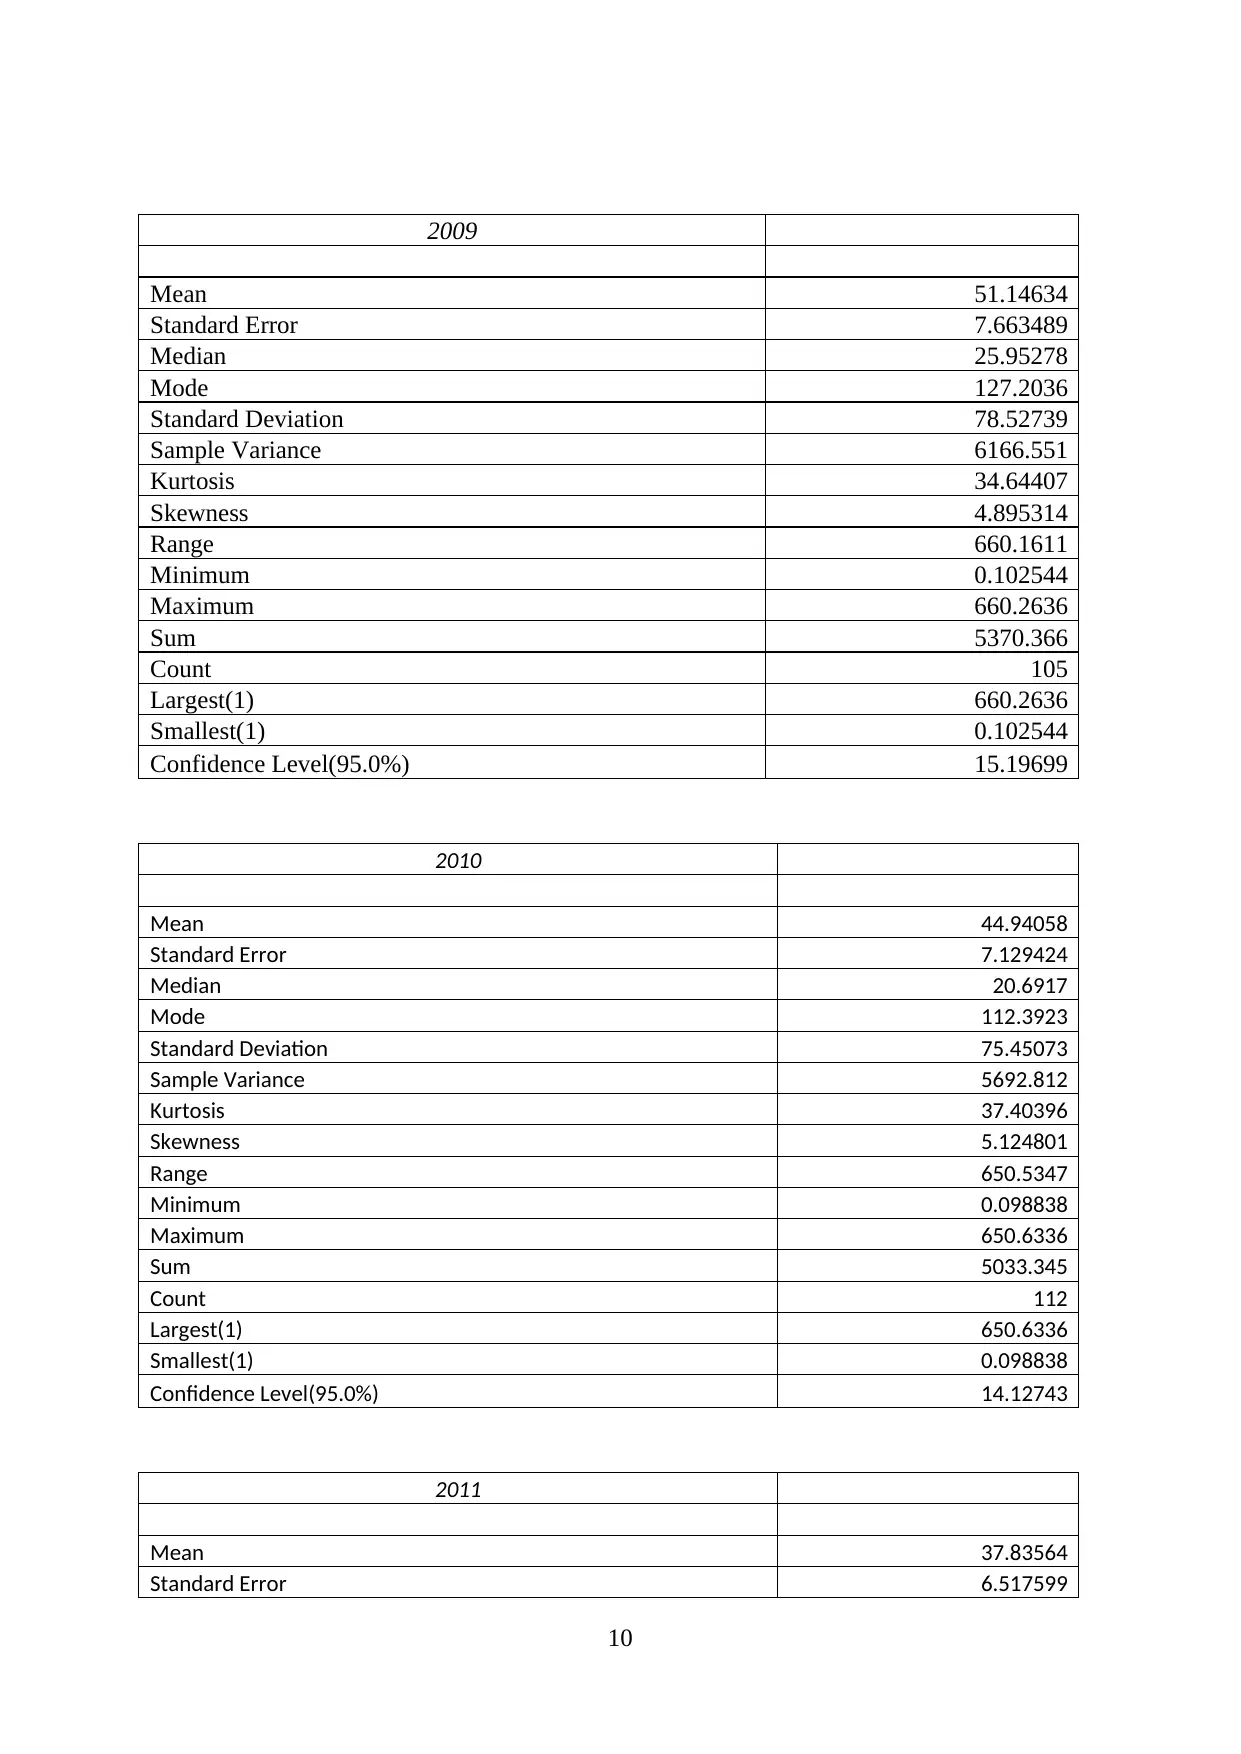
2009
Mean 51.14634
Standard Error 7.663489
Median 25.95278
Mode 127.2036
Standard Deviation 78.52739
Sample Variance 6166.551
Kurtosis 34.64407
Skewness 4.895314
Range 660.1611
Minimum 0.102544
Maximum 660.2636
Sum 5370.366
Count 105
Largest(1) 660.2636
Smallest(1) 0.102544
Confidence Level(95.0%) 15.19699
2010
Mean 44.94058
Standard Error 7.129424
Median 20.6917
Mode 112.3923
Standard Deviation 75.45073
Sample Variance 5692.812
Kurtosis 37.40396
Skewness 5.124801
Range 650.5347
Minimum 0.098838
Maximum 650.6336
Sum 5033.345
Count 112
Largest(1) 650.6336
Smallest(1) 0.098838
Confidence Level(95.0%) 14.12743
2011
Mean 37.83564
Standard Error 6.517599
10
⊘ This is a preview!⊘
Do you want full access?
Subscribe today to unlock all pages.
Trusted by 1+ million students worldwide
1 out of 25
Related Documents


Your All-in-One AI-Powered Toolkit for Academic Success.
+13062052269
info@desklib.com
Available 24*7 on WhatsApp / Email
![[object Object]](/_next/static/media/star-bottom.7253800d.svg)
Unlock your academic potential
Copyright © 2020–2026 A2Z Services. All Rights Reserved. Developed and managed by ZUCOL.