ECO10250 Economics for Decision Making Assignment - SCU Solution
VerifiedAdded on 2023/06/10
|15
|1654
|128
Homework Assignment
AI Summary
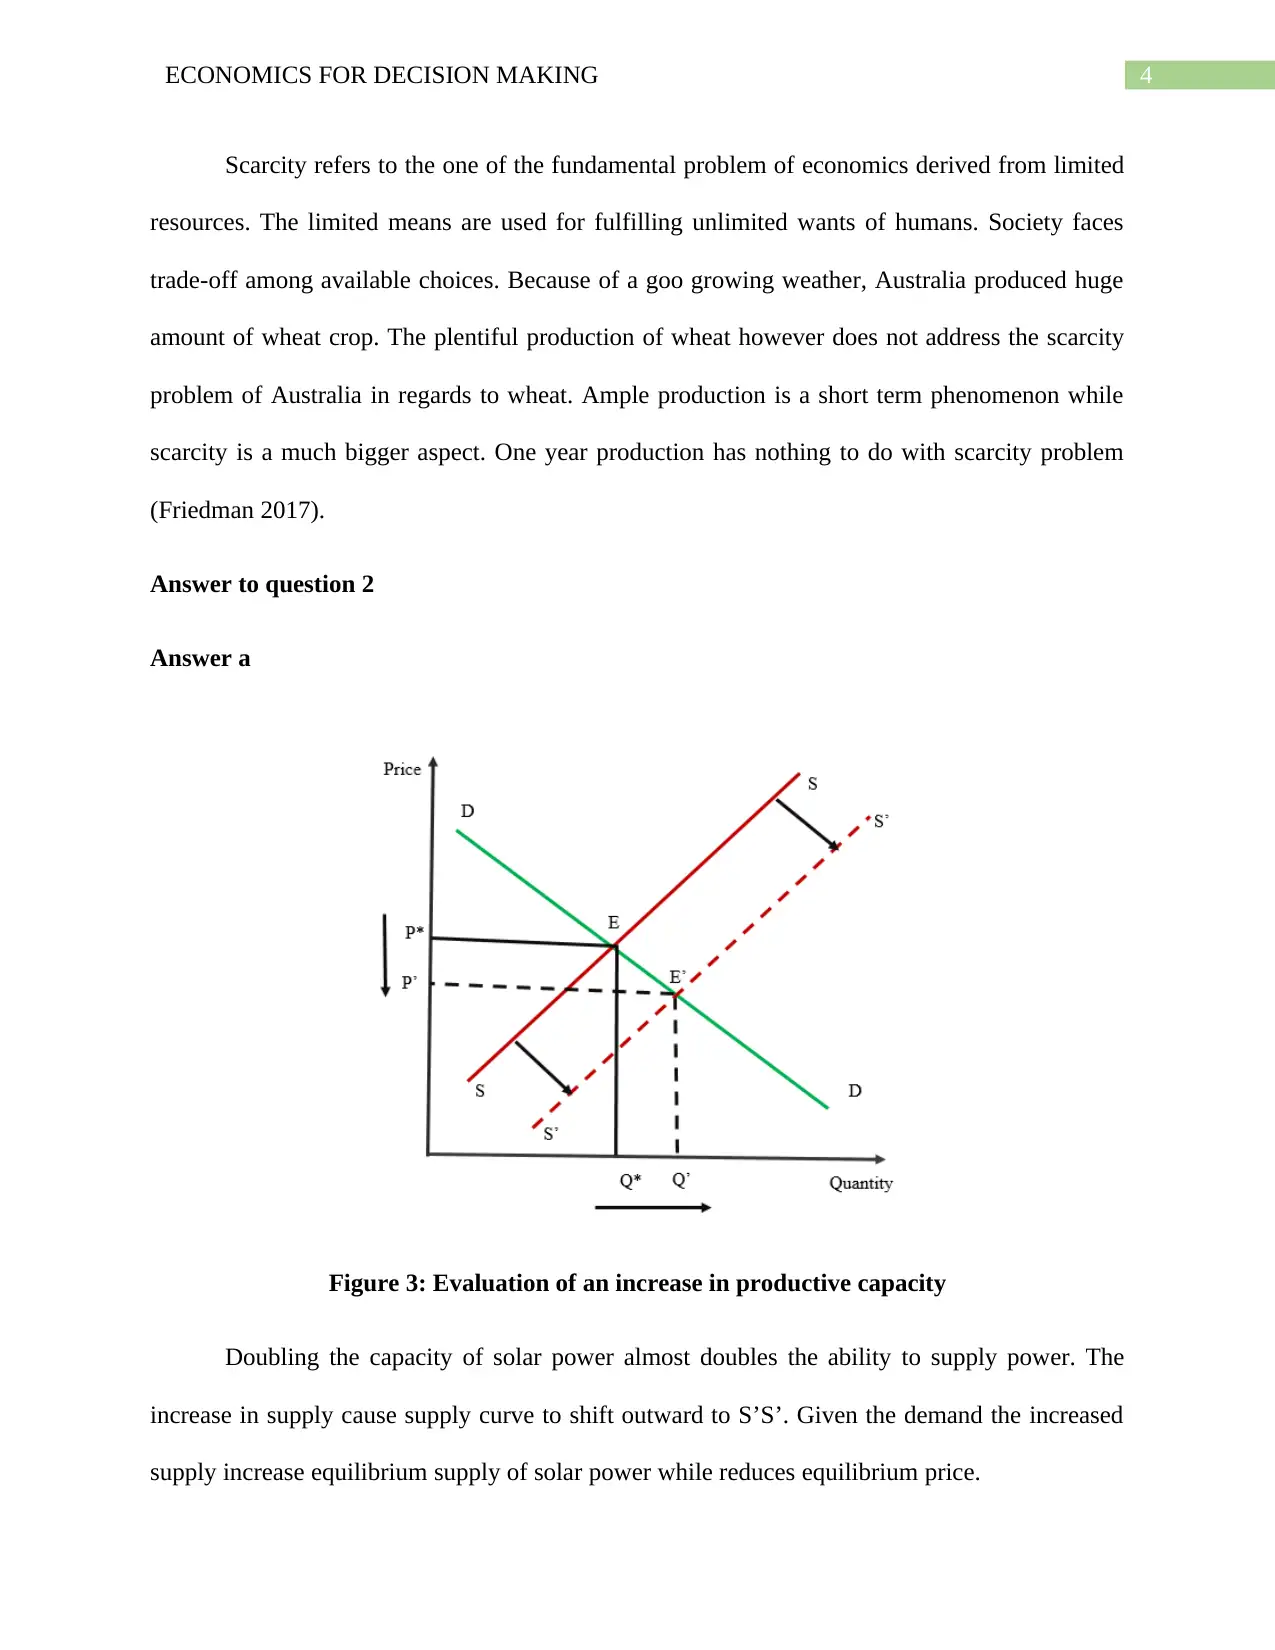
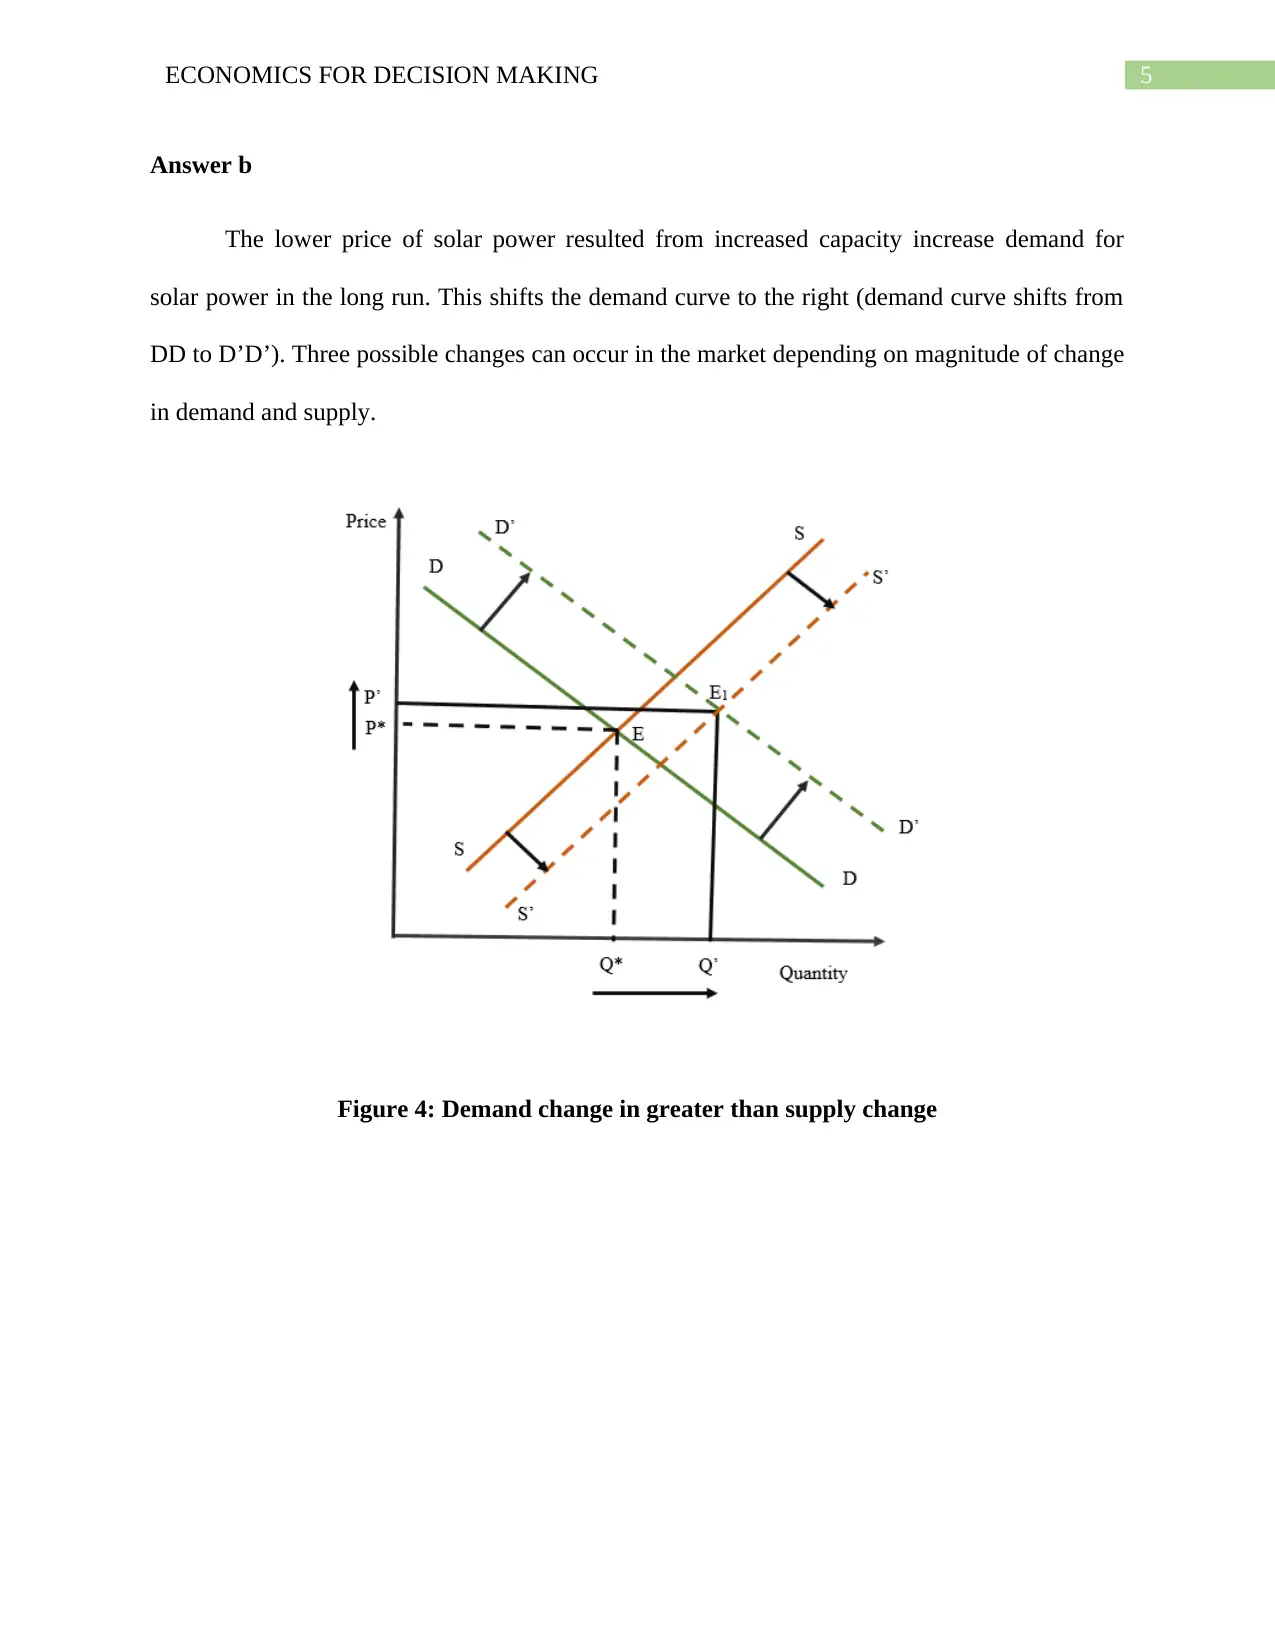
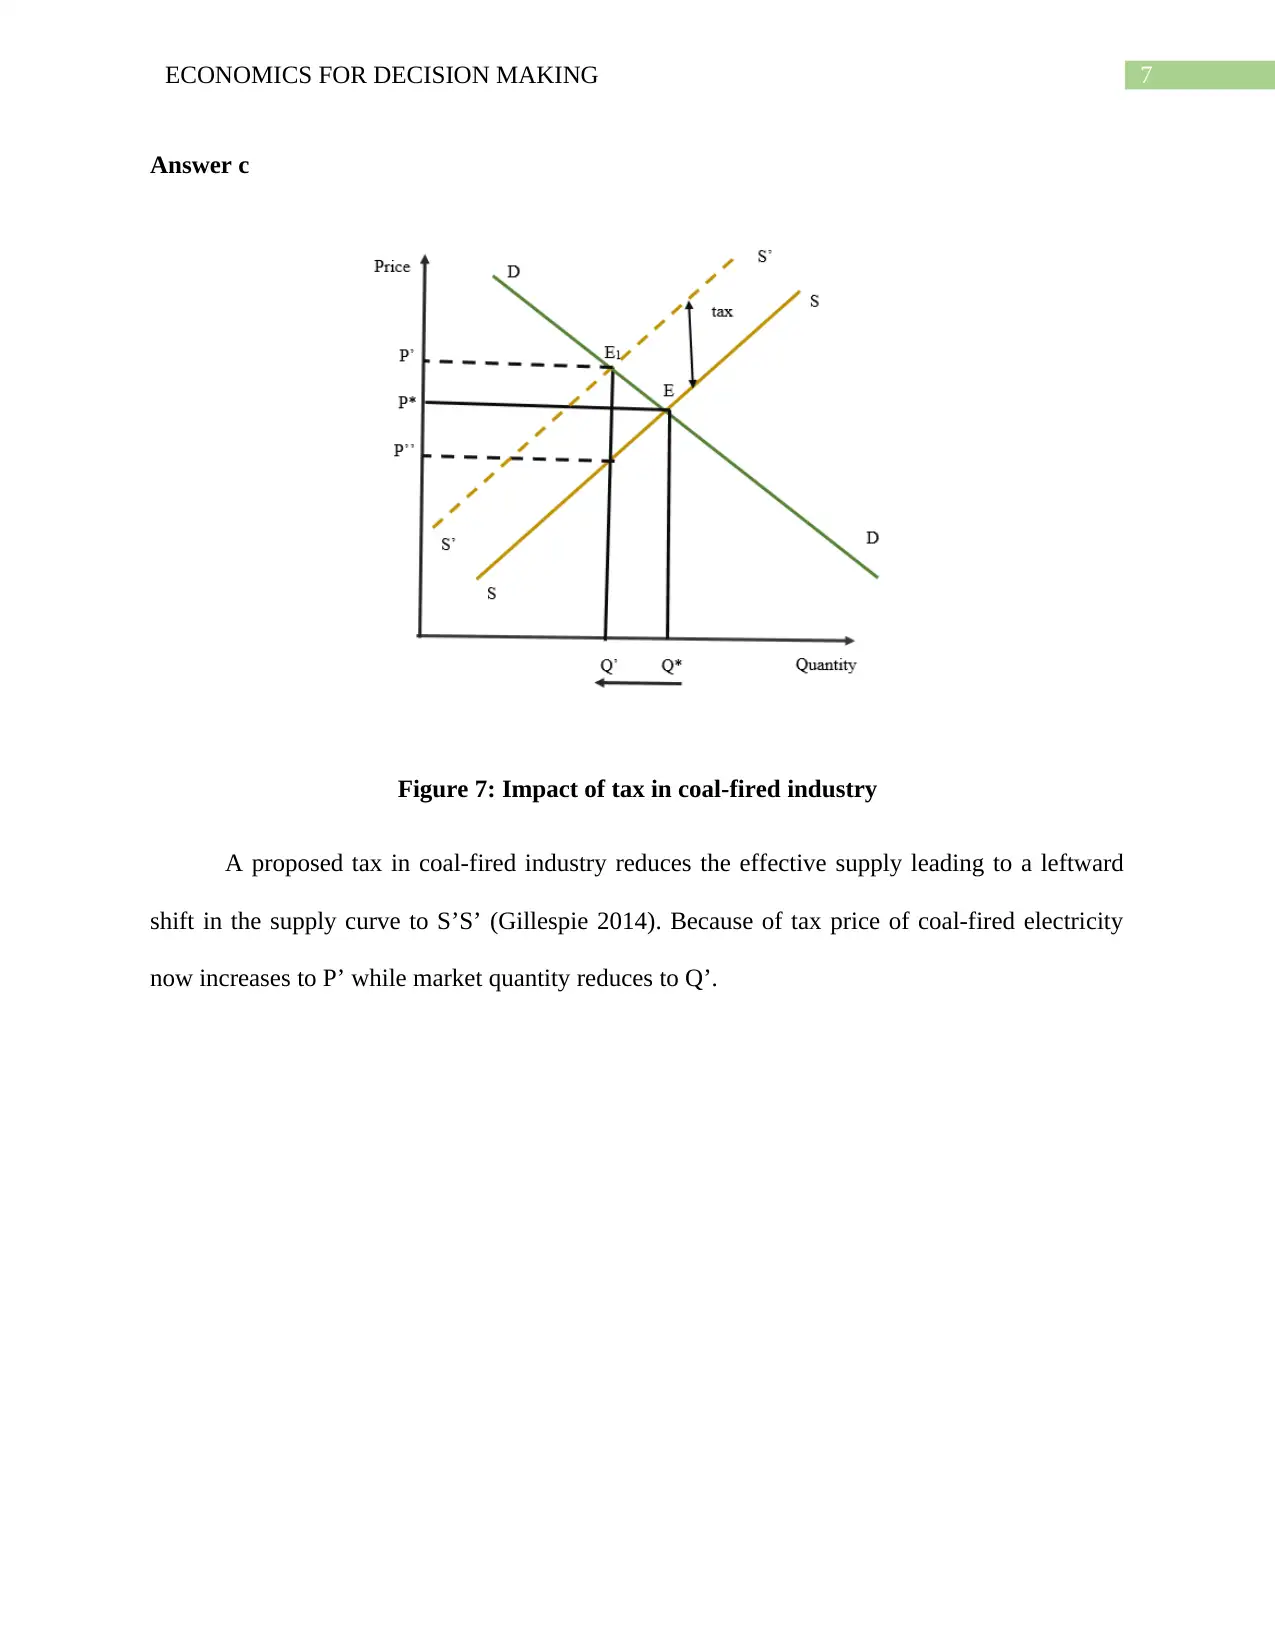
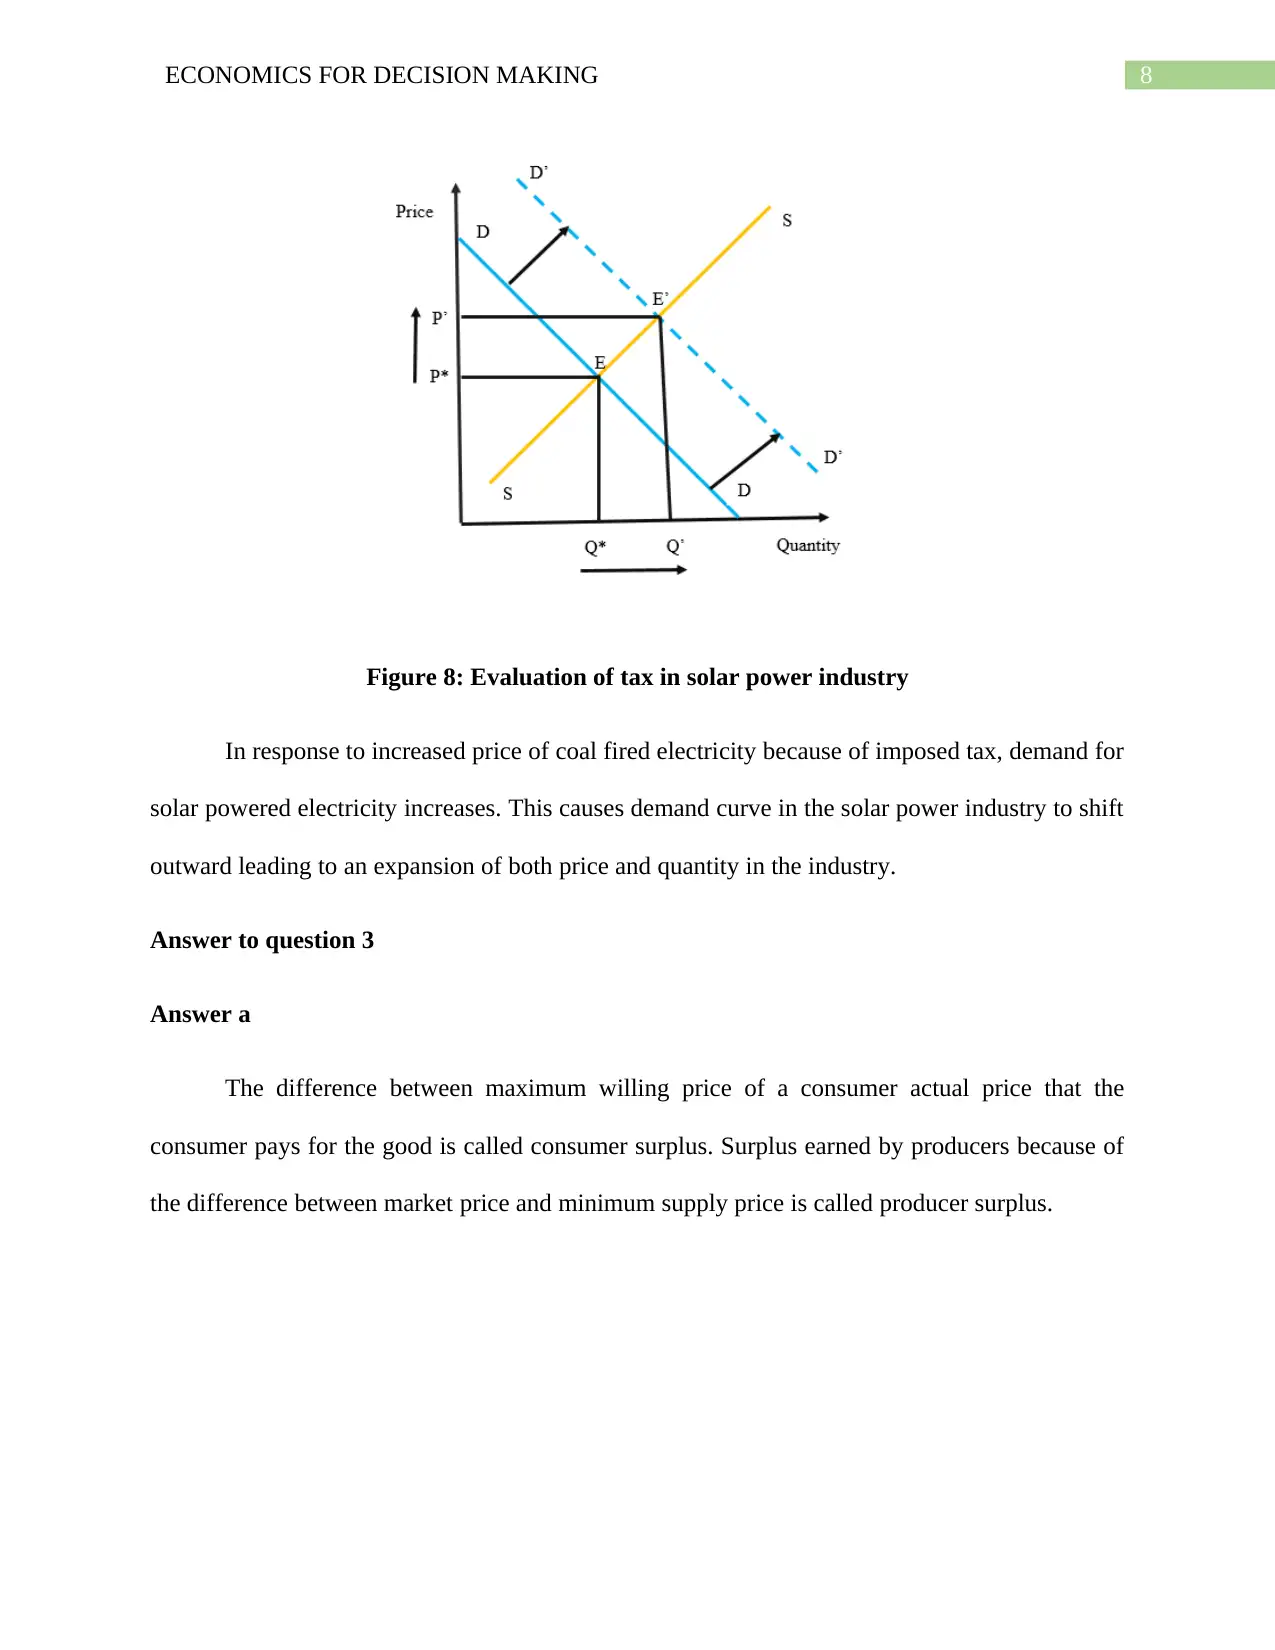
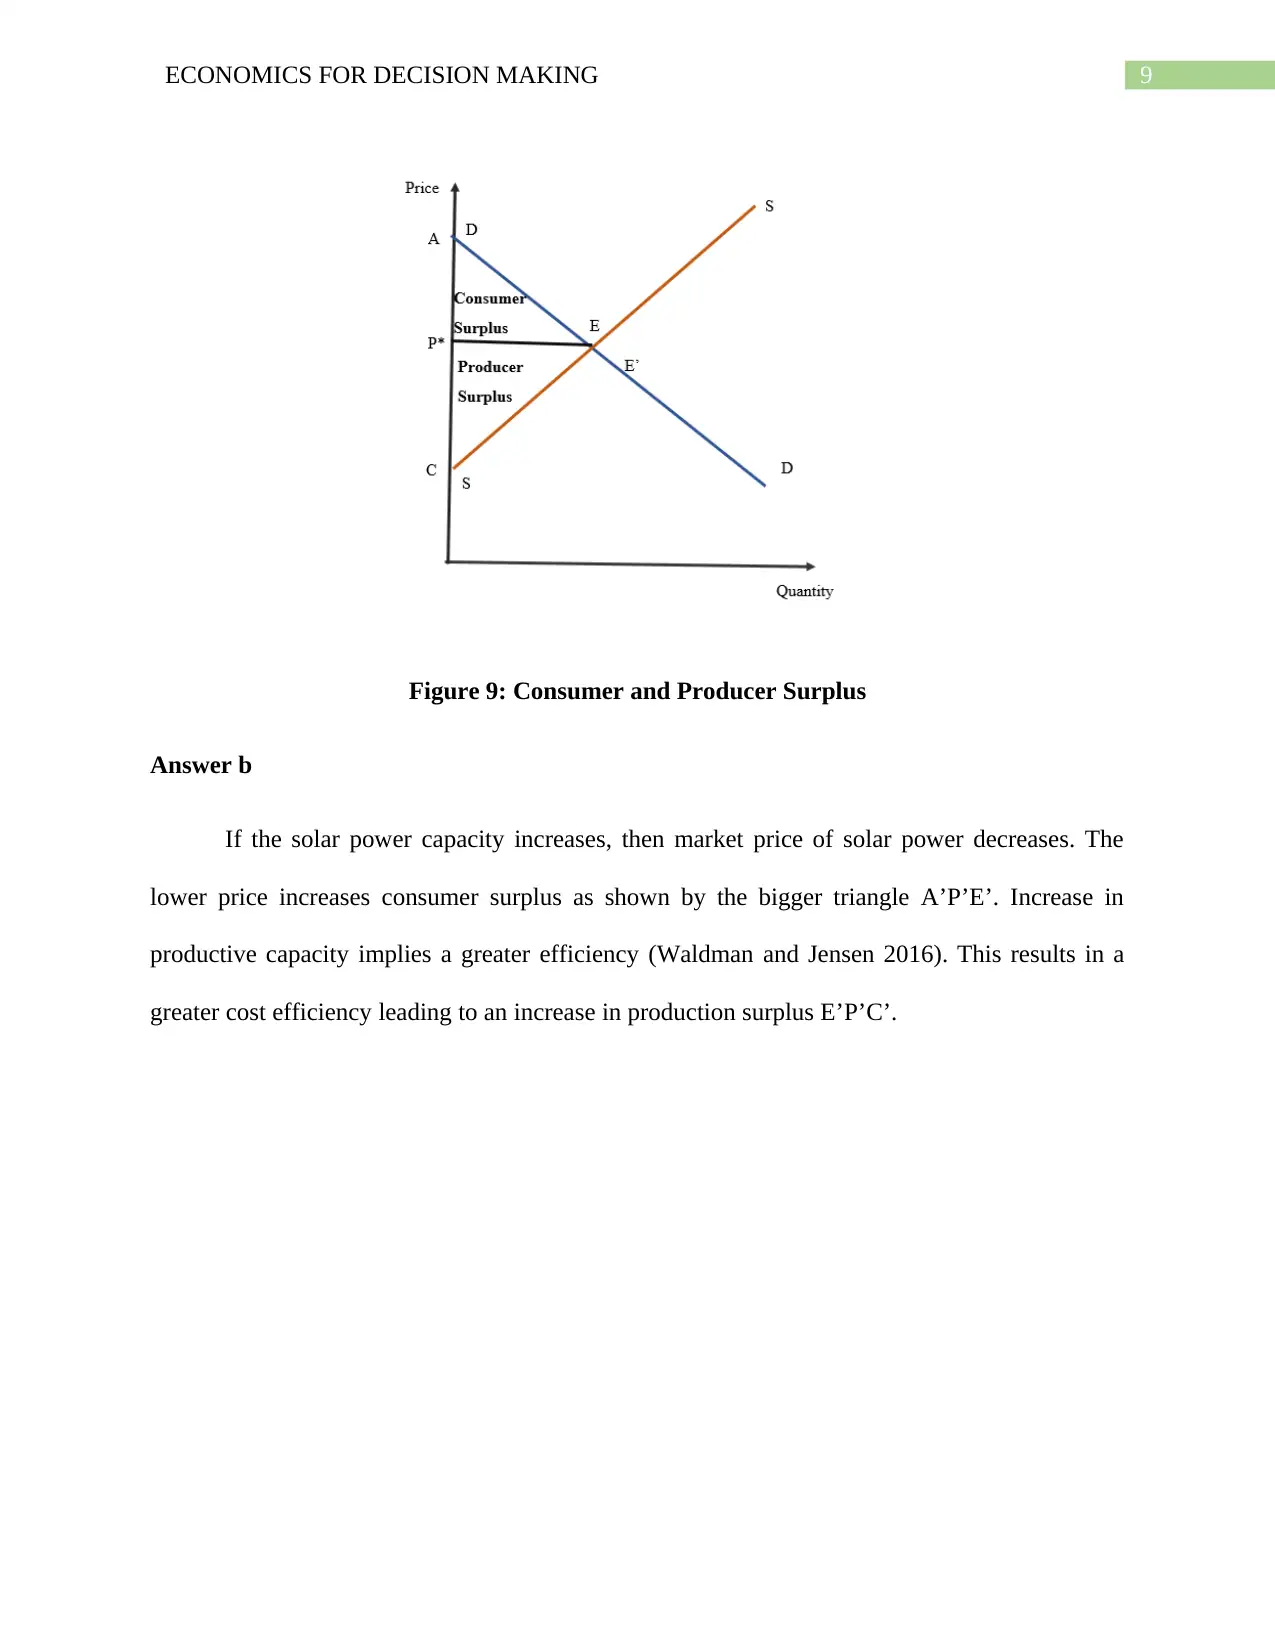
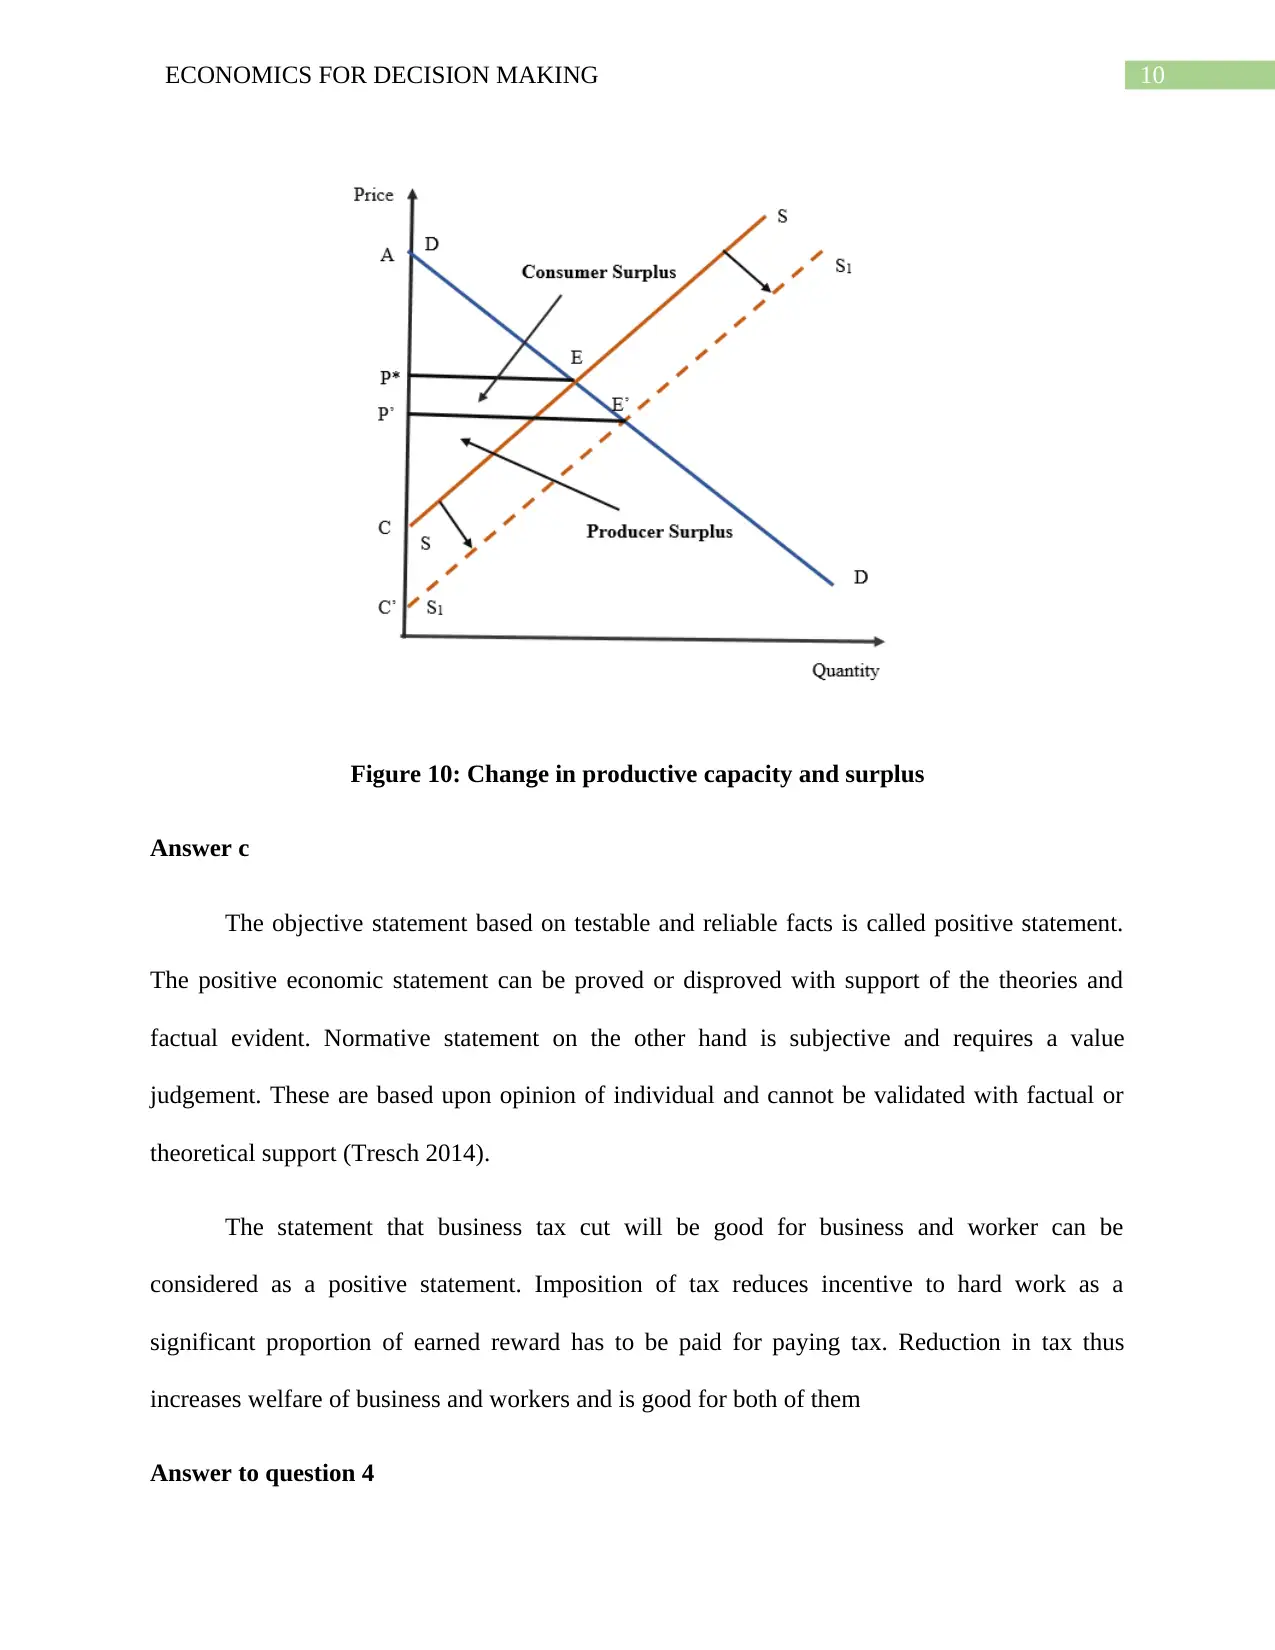
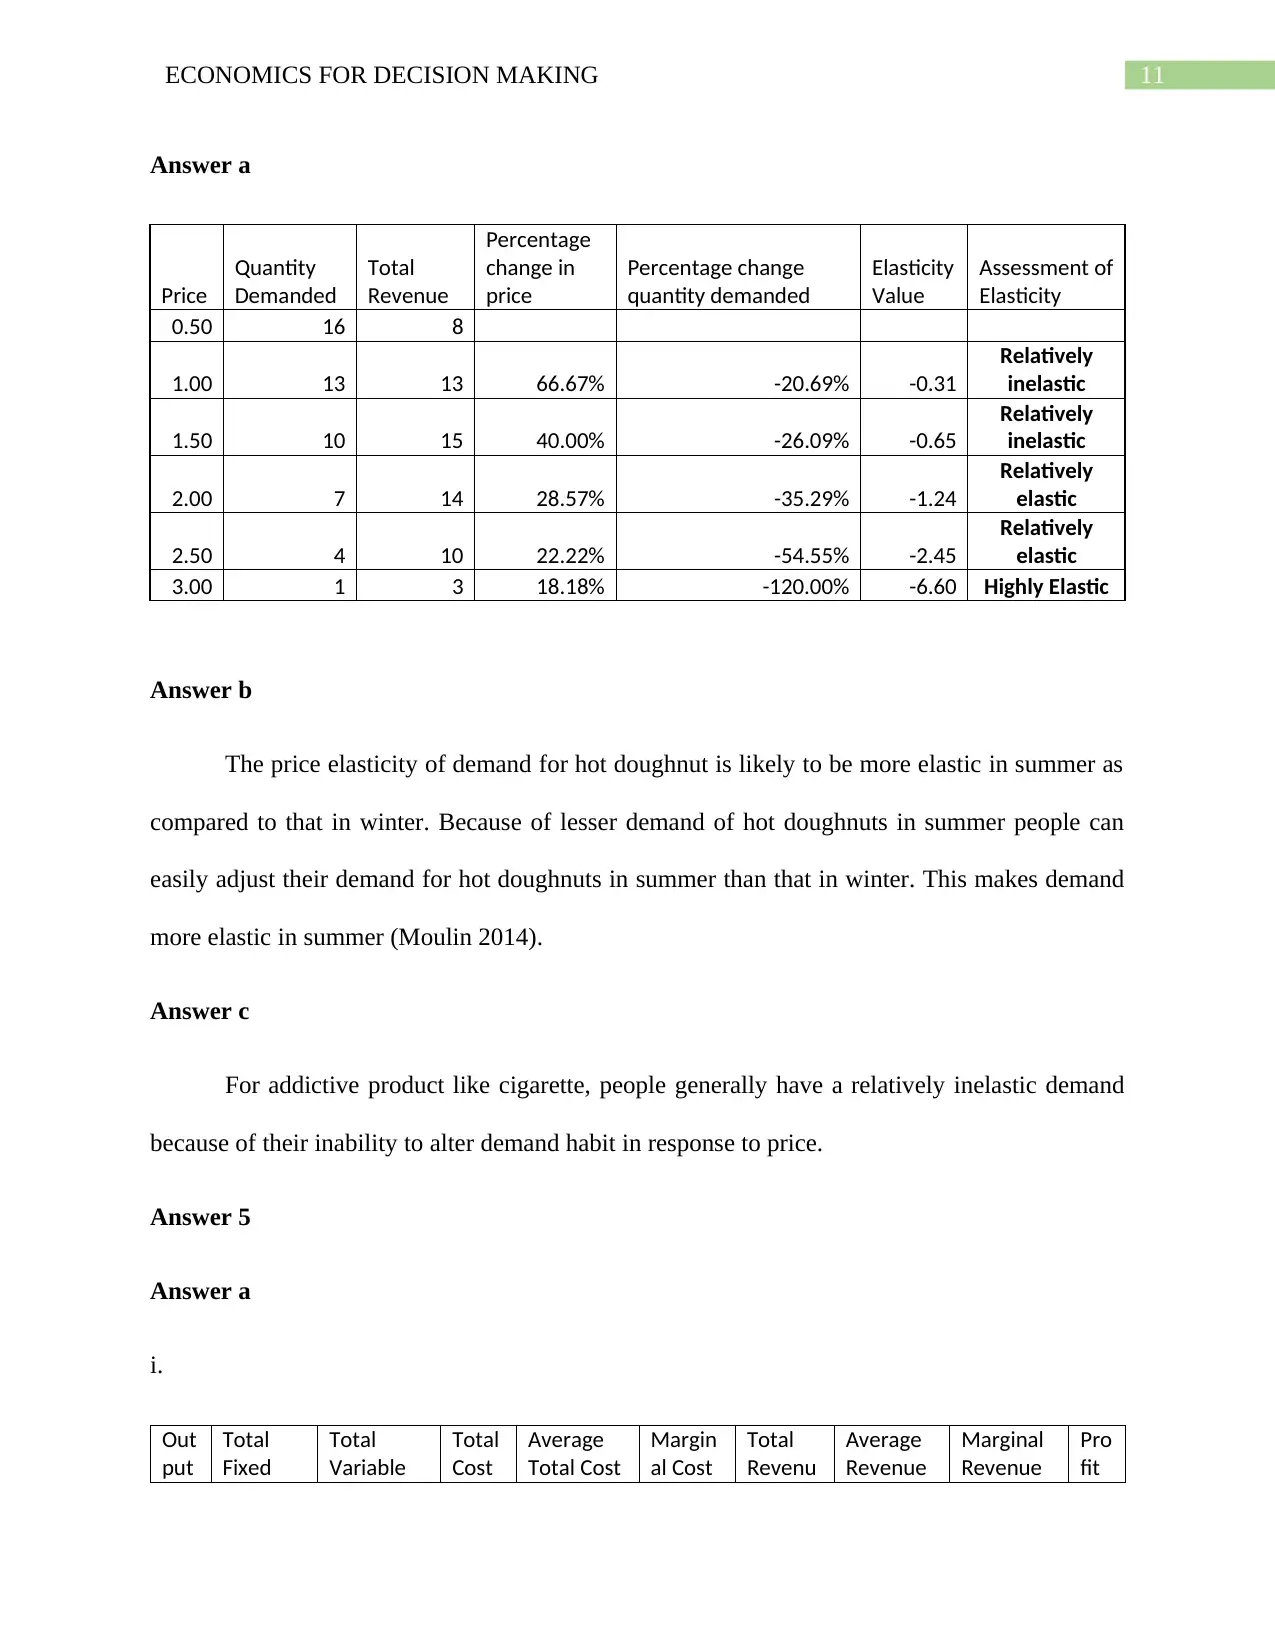
This document presents a detailed solution to an economics assignment focusing on decision-making principles. It covers various topics, including production possibility curves, opportunity cost, market equilibrium, and the impact of taxes on industries like coal and solar power. The solution also delves into consumer and producer surplus, price elasticity of demand, and cost analysis for firms, including the concepts of total cost, marginal cost, and profit maximization in a competitive market. The assignment uses graphs and calculations to illustrate economic concepts and provide answers to specific questions related to supply, demand, and market interventions.
1 out of 15
Related Documents


Your All-in-One AI-Powered Toolkit for Academic Success.
+13062052269
info@desklib.com
Available 24*7 on WhatsApp / Email
![[object Object]](/_next/static/media/star-bottom.7253800d.svg)
Copyright © 2020–2026 A2Z Services. All Rights Reserved. Developed and managed by ZUCOL.