Economics: Indifference Curve, Marginal Rate of Substitution, Budget Constraints, Diminishing Marginal Utility, Income and Substitution Effects, Behavioural Economics
VerifiedAdded on 2022/10/12
|11
|2466
|293
AI Summary
This article explains the concepts of Indifference Curve, Marginal Rate of Substitution, Budget Constraints, Diminishing Marginal Utility, Income and Substitution Effects, and Behavioural Economics in Economics. It also critically evaluates the reasons behind consumers’ irrational behaviours.
Contribute Materials
Your contribution can guide someone’s learning journey. Share your
documents today.

Running Head: Economics
Economics
Economics
Secure Best Marks with AI Grader
Need help grading? Try our AI Grader for instant feedback on your assignments.
Economics
Contents
Answer 1.........................................................................................................................................................2
a. Consumer’s Indifference Curve...........................................................................................................2
b. Marginal Rate of Substitution..............................................................................................................3
c. Consumer’s Budget Constraints..........................................................................................................4
d. Diminishing Marginal Utility..............................................................................................................5
e. Income and Substitution Effects..........................................................................................................6
Answer 2.........................................................................................................................................................7
Behavioural Economics...............................................................................................................................7
Critical Evaluation of the Reasons behind Consumers’ Irrational Behaviours............................................8
References.....................................................................................................................................................10
1
Economics
Answer 1.
a. Consumer’s Indifference Curve
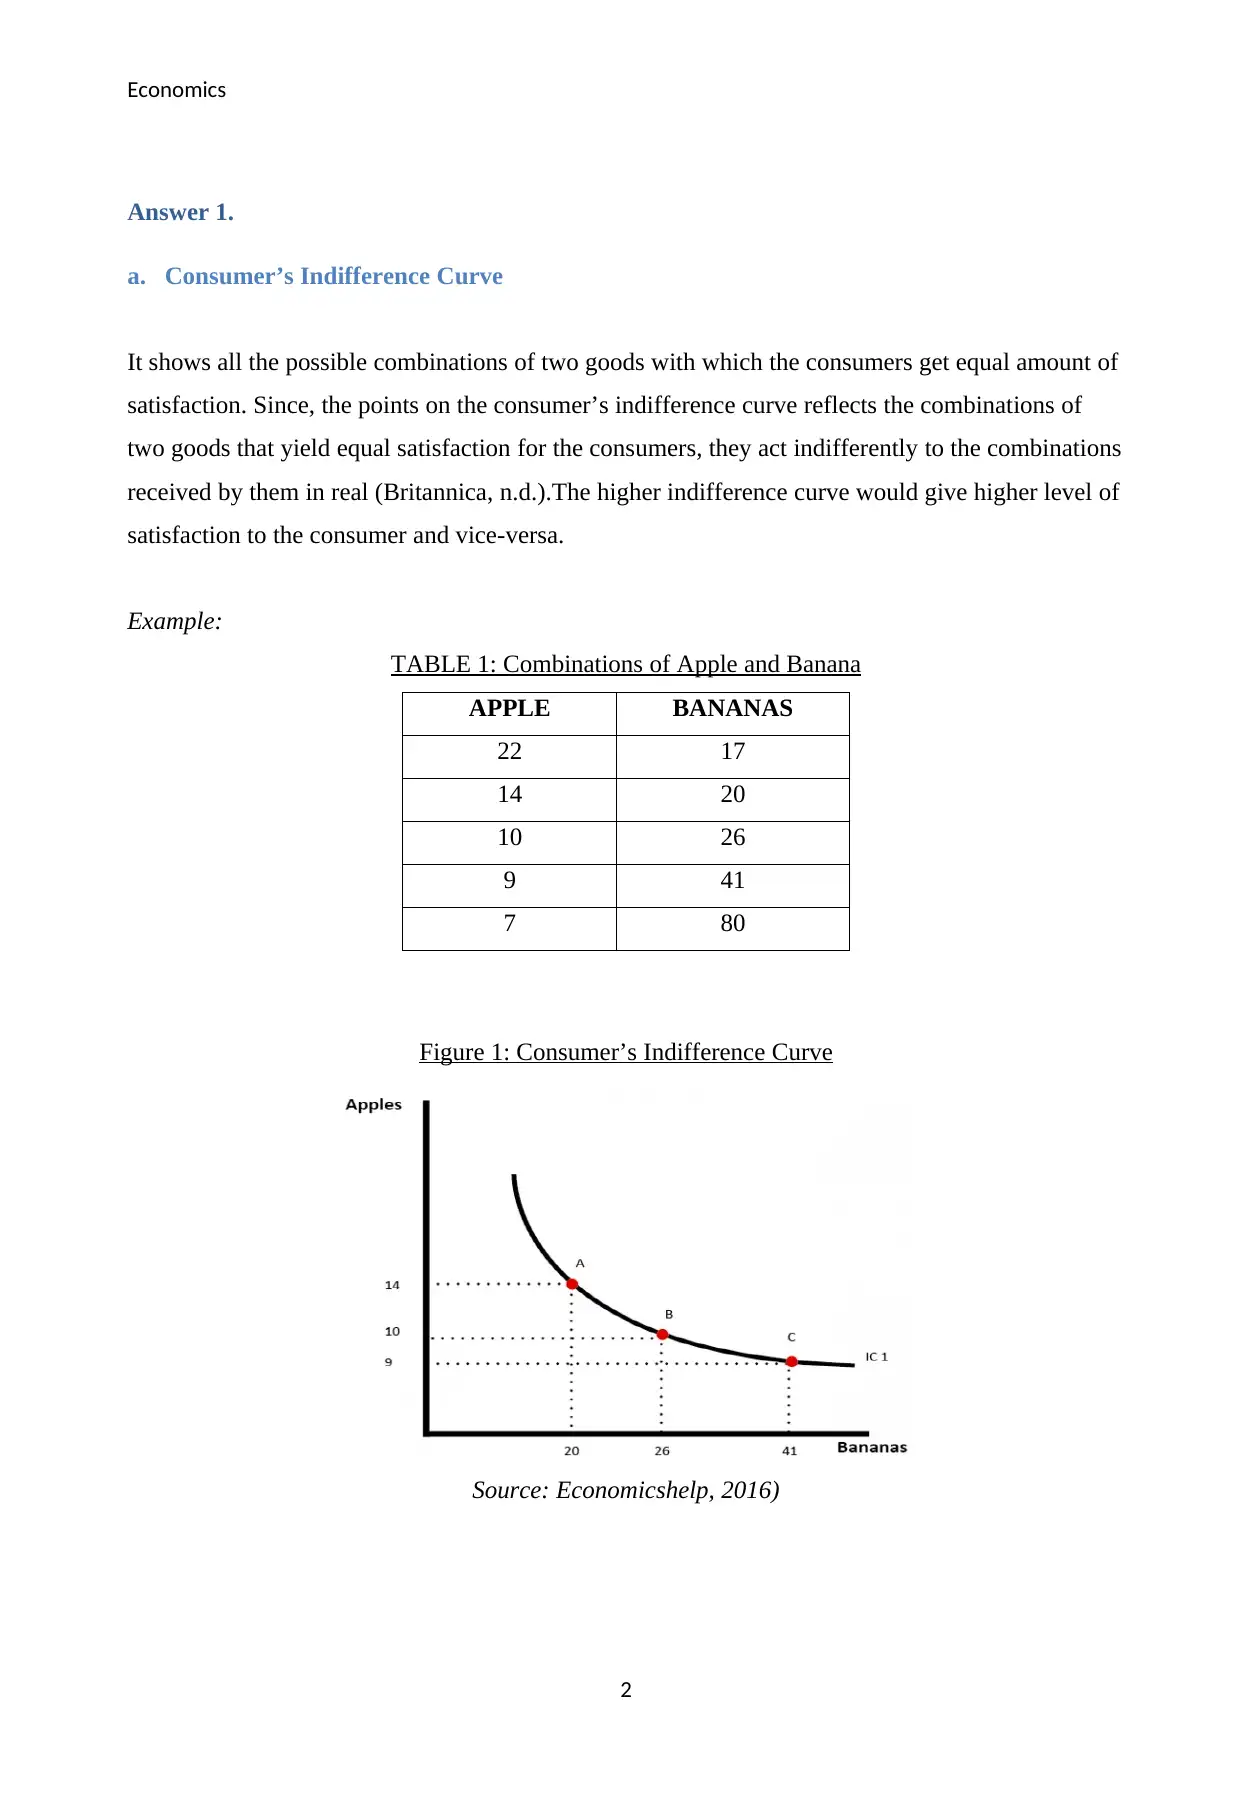
It shows all the possible combinations of two goods with which the consumers get equal amount of
satisfaction. Since, the points on the consumer’s indifference curve reflects the combinations of
two goods that yield equal satisfaction for the consumers, they act indifferently to the combinations
received by them in real (Britannica, n.d.).The higher indifference curve would give higher level of
satisfaction to the consumer and vice-versa.
Example:
TABLE 1: Combinations of Apple and Banana
APPLE BANANAS
22 17
14 20
10 26
9 41
7 80
Figure 1: Consumer’s Indifference Curve
Source: Economicshelp, 2016)
2
Answer 1.
a. Consumer’s Indifference Curve
It shows all the possible combinations of two goods with which the consumers get equal amount of
satisfaction. Since, the points on the consumer’s indifference curve reflects the combinations of
two goods that yield equal satisfaction for the consumers, they act indifferently to the combinations
received by them in real (Britannica, n.d.).The higher indifference curve would give higher level of
satisfaction to the consumer and vice-versa.
Example:
TABLE 1: Combinations of Apple and Banana
APPLE BANANAS
22 17
14 20
10 26
9 41
7 80
Figure 1: Consumer’s Indifference Curve
Source: Economicshelp, 2016)
2
Economics
The consumer’s indifference curve in figure 1 shows the different combinations of Apple and
Banana that yields the same level of utility for the consumers that is, 22 Apples and 17 Bananas
would give the same satisfaction to consumer as 9 Apples and 41 Bananas. Therefore, indifference
curve is mostly negatively sloped, could never intersect at any point and are always convex to the
point of origin.
b. Marginal Rate of Substitution
The marginal rate of substitution is the rate at which the consumers are ready to give up some
amount of one product in exchange of another product as long as the same level of utility or
satisfaction is provided by the new product (The Economy, 2015). Each point on the curve shows
the quantities of product A and product B that consumers are ready to substitute for one another.
This concept of MRS was introduced by Dr. J.R. Hicks and Prof. R.G.D. Allen (Economics
Concept, n.d.).
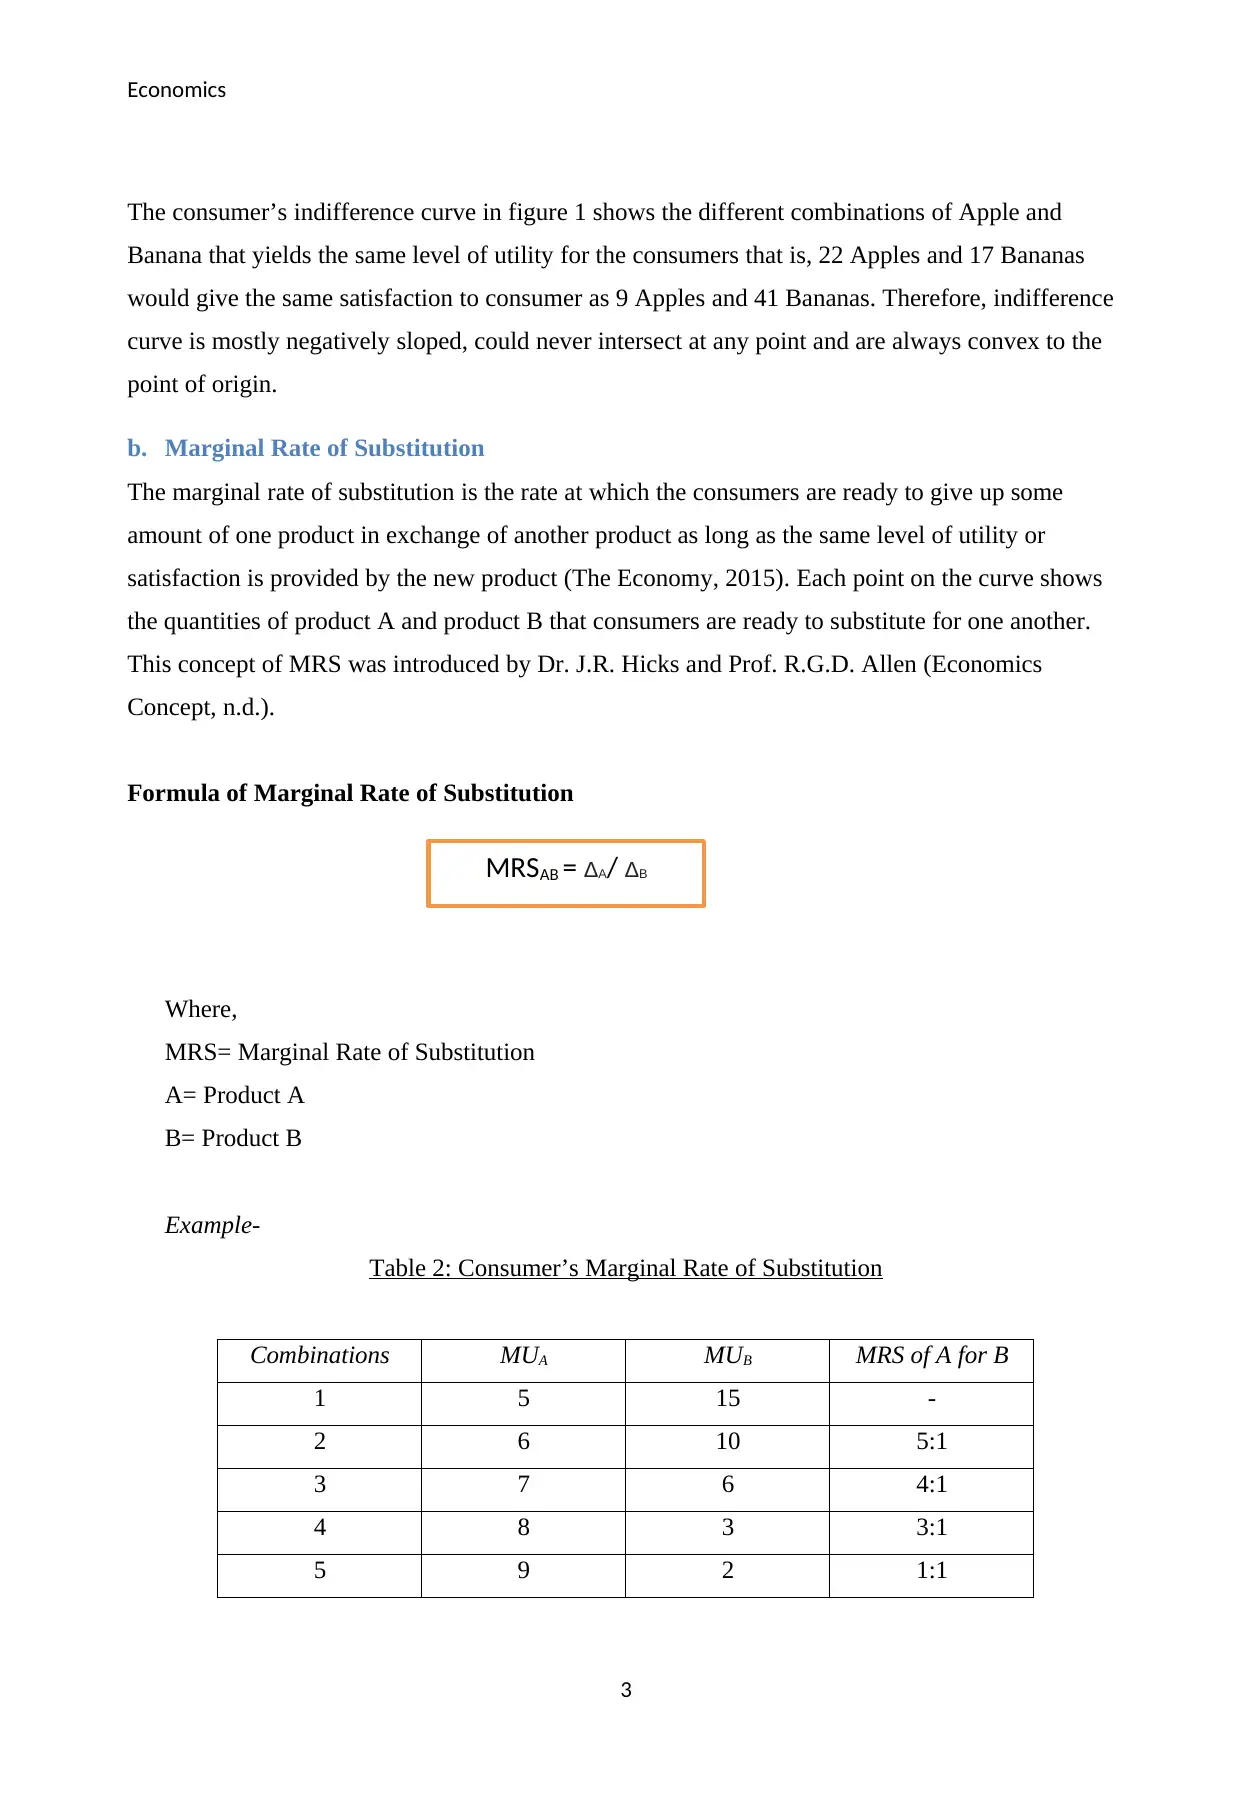
Formula of Marginal Rate of Substitution
Where,
MRS= Marginal Rate of Substitution
A= Product A
B= Product B
Example-
Table 2: Consumer’s Marginal Rate of Substitution
Combinations MUA MUB MRS of A for B
1 5 15 -
2 6 10 5:1
3 7 6 4:1
4 8 3 3:1
5 9 2 1:1
3
MRSAB = ΔA/ ΔB
The consumer’s indifference curve in figure 1 shows the different combinations of Apple and
Banana that yields the same level of utility for the consumers that is, 22 Apples and 17 Bananas
would give the same satisfaction to consumer as 9 Apples and 41 Bananas. Therefore, indifference
curve is mostly negatively sloped, could never intersect at any point and are always convex to the
point of origin.
b. Marginal Rate of Substitution
The marginal rate of substitution is the rate at which the consumers are ready to give up some
amount of one product in exchange of another product as long as the same level of utility or
satisfaction is provided by the new product (The Economy, 2015). Each point on the curve shows
the quantities of product A and product B that consumers are ready to substitute for one another.
This concept of MRS was introduced by Dr. J.R. Hicks and Prof. R.G.D. Allen (Economics
Concept, n.d.).
Formula of Marginal Rate of Substitution
Where,
MRS= Marginal Rate of Substitution
A= Product A
B= Product B
Example-
Table 2: Consumer’s Marginal Rate of Substitution
Combinations MUA MUB MRS of A for B
1 5 15 -
2 6 10 5:1
3 7 6 4:1
4 8 3 3:1
5 9 2 1:1
3
MRSAB = ΔA/ ΔB
Secure Best Marks with AI Grader
Need help grading? Try our AI Grader for instant feedback on your assignments.
Economics
From the above table we could see the following:
1. Under first combinations, the consumer is getting 5 units of product A and 15 units of
product B
2. Under second combination, the consumer is sacrificing 5 units of Product B for 1 unit of
Product A
3. Under third combination, the consumer is sacrificing only 4 units of Product B for 1 unit of
Product A
4. Under fourth combination, the consumer is sacrificing only 3 units of Product B for 1 unit
of Product A
5. At the end, the consumer is sacrificing only 1 units of Product B for 1 unit of Product A
This shows the diminishing marginal rate of substitution.
c. Consumer’s Budget Constraints
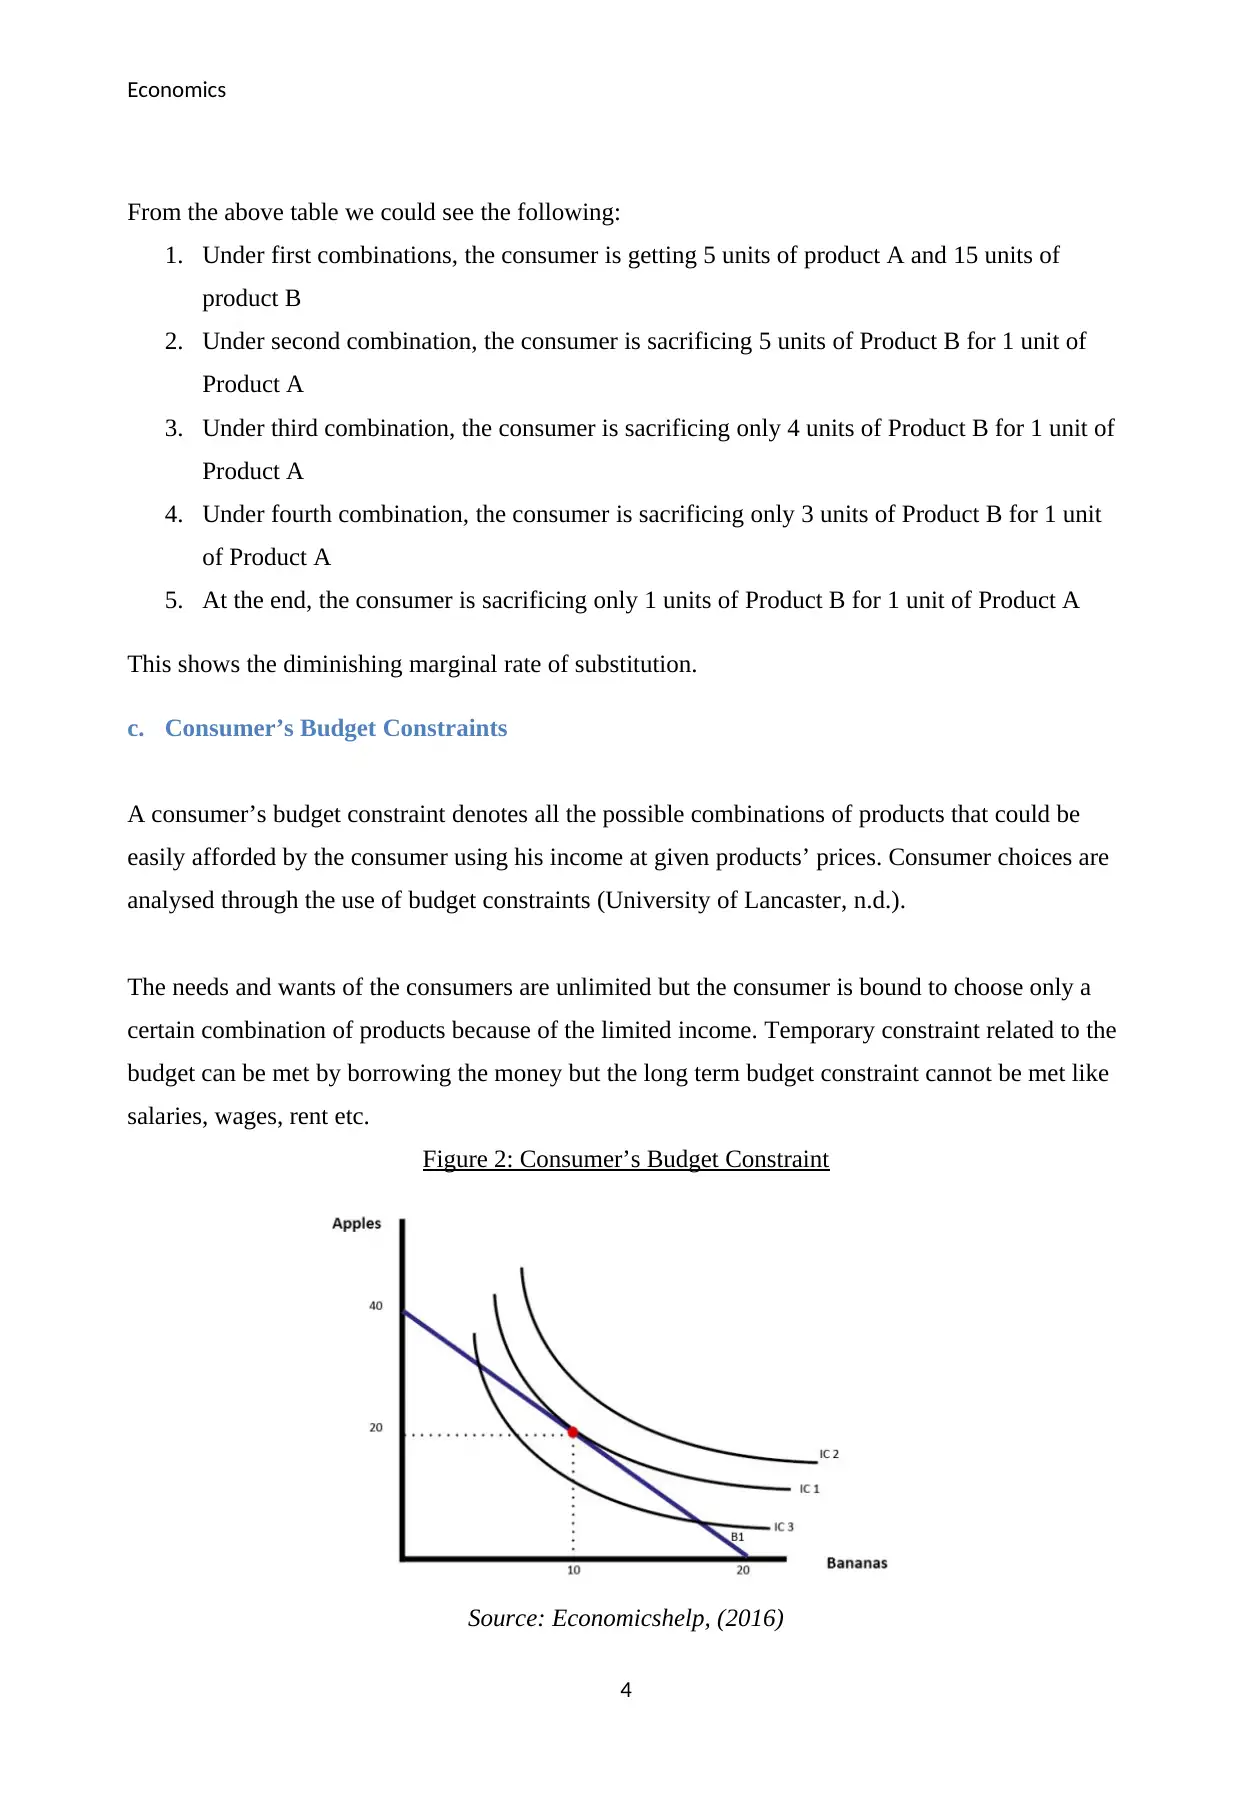
A consumer’s budget constraint denotes all the possible combinations of products that could be
easily afforded by the consumer using his income at given products’ prices. Consumer choices are
analysed through the use of budget constraints (University of Lancaster, n.d.).
The needs and wants of the consumers are unlimited but the consumer is bound to choose only a
certain combination of products because of the limited income. Temporary constraint related to the
budget can be met by borrowing the money but the long term budget constraint cannot be met like
salaries, wages, rent etc.
Figure 2: Consumer’s Budget Constraint
Source: Economicshelp, (2016)
4
From the above table we could see the following:
1. Under first combinations, the consumer is getting 5 units of product A and 15 units of
product B
2. Under second combination, the consumer is sacrificing 5 units of Product B for 1 unit of
Product A
3. Under third combination, the consumer is sacrificing only 4 units of Product B for 1 unit of
Product A
4. Under fourth combination, the consumer is sacrificing only 3 units of Product B for 1 unit
of Product A
5. At the end, the consumer is sacrificing only 1 units of Product B for 1 unit of Product A
This shows the diminishing marginal rate of substitution.
c. Consumer’s Budget Constraints
A consumer’s budget constraint denotes all the possible combinations of products that could be
easily afforded by the consumer using his income at given products’ prices. Consumer choices are
analysed through the use of budget constraints (University of Lancaster, n.d.).
The needs and wants of the consumers are unlimited but the consumer is bound to choose only a
certain combination of products because of the limited income. Temporary constraint related to the
budget can be met by borrowing the money but the long term budget constraint cannot be met like
salaries, wages, rent etc.
Figure 2: Consumer’s Budget Constraint
Source: Economicshelp, (2016)
4
Economics
Where,
B1 = Budget Line
IC= Indifference Curve
From the figure 2, we could interpret that with the current income (denoted by B1) the consumer
can opt for IC1 that is twenty Apples and 10 Bananas. In case, the income of the consumer falls
(rises) the consumer can go for the product combinations lying on IC3 (IC2).
d. Diminishing Marginal Utility
The law of diminishing marginal utility says that when a consumer consumes a product, the utility
he gets from the product at the initial stage goes on decreasing as he consumes more units of that
product. For example- a customer is consuming a cake of brand A but then after consuming it for
10 or 20 days he switched to the cake of brand B. This happened because the satisfaction he was
getting after consuming cake of Brand A diminished within 10-20days and therefore he switched to
cake of Brand B.
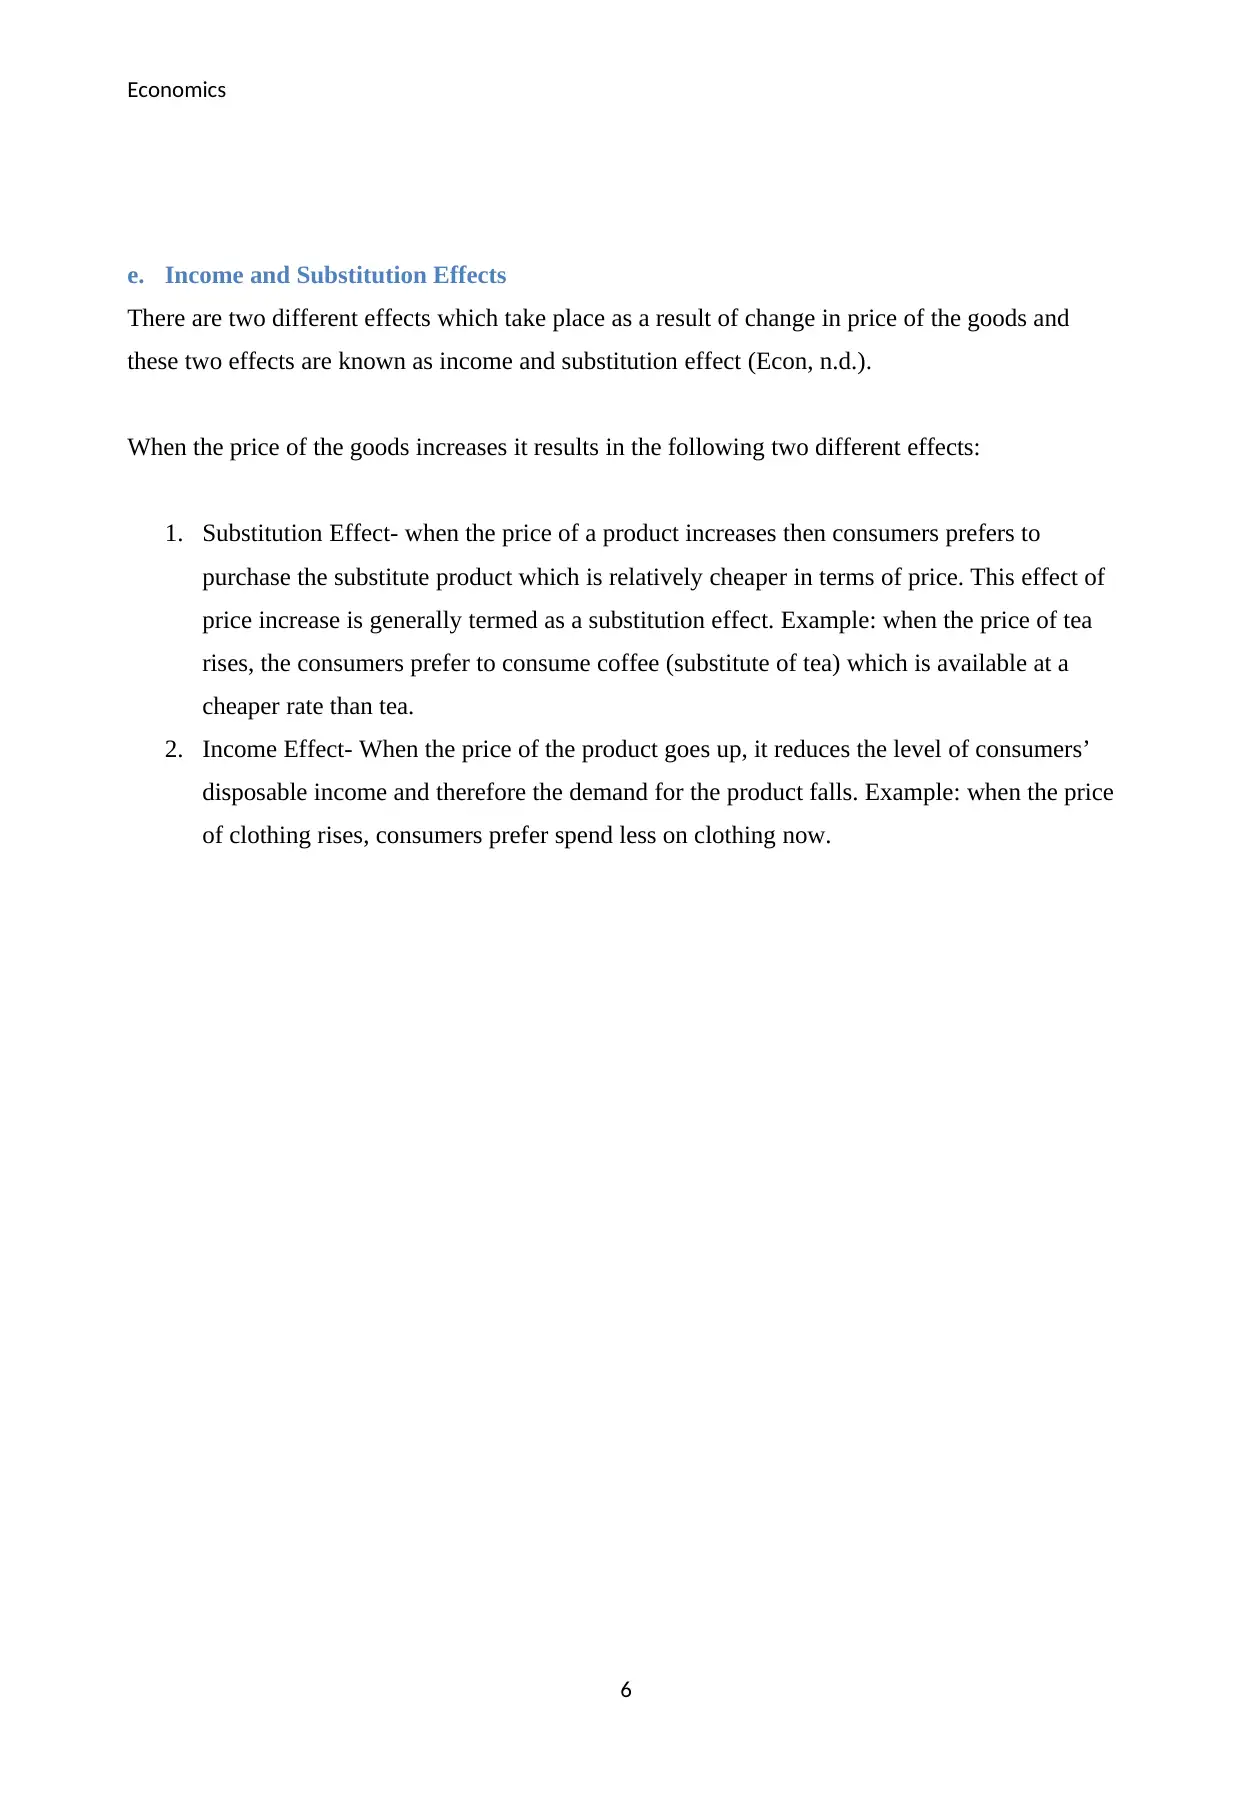
Example-
Table 3: Diminishing Marginal Utility
Unit of Consumption Marginal Utility Total Utility
1 20 20
2 15 35
3 10 45
4 5 50
5 00 50
6 -05 45
From Table 3 we could see when consumer had first unit of Apple, the marginal utility was 20 but
when the second unit of Apple was consumed by the consumer the Marginal utility fell to 15 in
spite of rise in total utility. This shows that utility of Apples diminishes as an additional unit of it is
consumed by the consumer. On consuming the 5th Apple the consumer reached to its saturation
point as a result the marginal utility became 0 and if he goes for the consumption of 6th Apple the
marginal utility becomes negative (Owlcation, 2017).
5
Where,
B1 = Budget Line
IC= Indifference Curve
From the figure 2, we could interpret that with the current income (denoted by B1) the consumer
can opt for IC1 that is twenty Apples and 10 Bananas. In case, the income of the consumer falls
(rises) the consumer can go for the product combinations lying on IC3 (IC2).
d. Diminishing Marginal Utility
The law of diminishing marginal utility says that when a consumer consumes a product, the utility
he gets from the product at the initial stage goes on decreasing as he consumes more units of that
product. For example- a customer is consuming a cake of brand A but then after consuming it for
10 or 20 days he switched to the cake of brand B. This happened because the satisfaction he was
getting after consuming cake of Brand A diminished within 10-20days and therefore he switched to
cake of Brand B.
Example-
Table 3: Diminishing Marginal Utility
Unit of Consumption Marginal Utility Total Utility
1 20 20
2 15 35
3 10 45
4 5 50
5 00 50
6 -05 45
From Table 3 we could see when consumer had first unit of Apple, the marginal utility was 20 but
when the second unit of Apple was consumed by the consumer the Marginal utility fell to 15 in
spite of rise in total utility. This shows that utility of Apples diminishes as an additional unit of it is
consumed by the consumer. On consuming the 5th Apple the consumer reached to its saturation
point as a result the marginal utility became 0 and if he goes for the consumption of 6th Apple the
marginal utility becomes negative (Owlcation, 2017).
5
Economics
e. Income and Substitution Effects
There are two different effects which take place as a result of change in price of the goods and
these two effects are known as income and substitution effect (Econ, n.d.).
When the price of the goods increases it results in the following two different effects:
1. Substitution Effect- when the price of a product increases then consumers prefers to
purchase the substitute product which is relatively cheaper in terms of price. This effect of
price increase is generally termed as a substitution effect. Example: when the price of tea
rises, the consumers prefer to consume coffee (substitute of tea) which is available at a
cheaper rate than tea.
2. Income Effect- When the price of the product goes up, it reduces the level of consumers’
disposable income and therefore the demand for the product falls. Example: when the price
of clothing rises, consumers prefer spend less on clothing now.
6
Paraphrase This Document
Need a fresh take? Get an instant paraphrase of this document with our AI Paraphraser
Economics
Answer 2.
Behavioural Economics
Behavioural Economics makes use of both psychology and economics to explain the fact that
sometimes consumers do not behave in the way it is beneficial for them. With the help of
behavioural economics one could know what makes the consumers commit the errors (Psychology
Today, 2017). The traditional model says the consumers always makes such decisions which are of
self-interest and rational whereas behaviour economics is just opposite of it. Behavioural
economics also explains the way in which the customers’ decisions could be corrected and prove
beneficial for both customers and the producers (PWC, 2016).
Critical Evaluation of the Reasons behind Consumers’ Irrational Behaviours
1. Herding behaviour- The consumption behaviour of the consumers is highly influenced by
what others are doing or consuming. For example: when a student sees his friends
consuming alcohol, it is very likely that he would also start consuming the alcohol.
In a study, it was seen that consumers who shops from online sites makes their consumption
decision after studying choices and evaluations of other consumers highlighted under the
head of ‘Customers’ Reviews’. Here, the practice of herding can be considered good
because it saves the consumers from the possibility of getting cheated by the online sellers
(Huang and Chen, 2006). However, in case of student consuming alcohol just because his
friends are doing so, herding becomes dangerous as he made drinking decision in spite of
knowing the fact that alcohol consumption is injurious to health.
2. Status Quo- People are always faced with the new choices and options of doing the things
differently but still majority of the people prefer to stick with the older options. There are
various studies which proved that people always prefer to stick with the existing option of
doing a particular thing instead of entering in an entirely changed option. This tendency of
human beings of preferring the state of inertia is termed as status quo bias (International
Banker, 2016).
In a study, it was seen that people preferred to stick with their current electricity service
provider over the new electricity service provider who were ready to provide the service at
a more reliable and cheaper rate (Shevchenko, Helversen and Scheibehenne, 2014). This
step of choosing the service of current electricity provider cannot be considered wise
because it leaded customers pay a price higher for the same service which they could have
availed at a lower price. However, if we look it in another way then it might be a wise step
7
Economics
because availing the service from the current service provider reduces the chance of service
failure and would result in undisturbed electricity flow which would save both time and
money of the customers.
There was also an in-store survey which revealed that on average consumers spent only
thirteen seconds to make their buying decision. Also, there were only 11% of consumers
who preferred to examine two or more products before buying detergent. Most of them
stick with their previous product choice and made the purchase (Ren, 2014). This indicates
that people like to buy the same product with which they had a satisfactory experience and
hardly bother to try the new products. It is good in a way that it saves the time and efforts of
the consumers in selecting and trying a new product. Then again it cannot be regarded as a
rational behaviour of consumers because without evaluating the new options they could not
arrive at the best possible choice.
A study also revealed the behaviour of University employees of strongly sticking with the
status quo. University introduced new options in the employment based healthcare plan and
of course those employees who joined after this change took advantage of newly added
options. However, majority of the previously employed faculty did not bother of switching
to the new options in spite of having the right to do so (The University of Nottingham,
2010). Again this reflects the tendency of switching with old in spite of having new and
more advantageous options.
3. Mental Accounting
Mental accounting is when people value and treat money in a different manner depending
upon the source from which it has come and where those money are kept.
There is a famous example of New York taxi drivers who prefer working for longer hours
on bad days and shorter hours on good days when the option of customisation are more.
According to the traditional theory, they should work for longer hours on good days for
maximising their monthly income. However, this behaviour of taxi drivers contradicts the
traditional theory because these taxi drivers have their own mental accounting according to
which they stop working once their daily target is achieved and this happens quickly on
good days and takes time on bad days (The University of Nottingham, 2010).
8
Economics
References
Britannica. (n.d.). Indifference curve. Available at: https://www.britannica.com/topic/indifference-
curve/us/companion.websites/9780195336108/pdf/Salvatore_Chapter_3.pdf [Accessed 5 August,
2019).
Economics Concept. (n.d.). Marginal Rate of Substitution (MRS). Available at:
https://economicsconcepts.com/marginal_rate_of_substitution.htm [Accessed 5 August, 2019).
Econ. (n.d.). Income and Substitution Effects — A Summary. Available at:
http://www2.econ.iastate.edu/classes/econ101/hallam/Income_Substitution.pdf [Accessed 5
August, 2019).
Economicshelp. (2016). Budget constraints. Available at:
https://www.economicshelp.org/blog/glossary/budget-constraints/ [Accessed 5 August, 2019).
Huang, J.H. and Chen, Y. (2006). Herding in online product choice.Psychology &
Marketing.23(5). pp. 413-428. Available at:
https://onlinelibrary.wiley.com/doi/abs/10.1002/mar.20119 [Accessed 5 August, 2019).
International Banker. (2016). Cognitive bias series: 4. Status quo bias. Available at:
https://internationalbanker.com/brokerage/cognitive-bias-series-4-status-quo-bias/ [Accessed 5
August, 2019).
Owlcation. (2017). Law of Diminishing Marginal Utility - Detailed Explanation. Available at:
https://owlcation.com/social-sciences/Law-of-Diminishing-Marginal-Utility-Detailed-Explanation
[Accessed 5 August, 2019).
PWC. (2016). “How disruptive do you think changes in customer behaviour will be for your
industry over the next five years?. Available at: https://www.pwc.com/ca/en/industries/financial-
services/insurance-speak-blog/behavioural-economics-as-a-competitive-advantage.html [Accessed
5 August, 2019).
9
Secure Best Marks with AI Grader
Need help grading? Try our AI Grader for instant feedback on your assignments.
Economics
Psychology Today. (2017). What Is Behavioral Economics?. Available at:
https://www.psychologytoday.com/us/blog/science-choice/201705/what-is-behavioral-economics
[Accessed 5 August, 2019).
Ren, Y. (2014). Status Quo Bias and Choice Overload: An Experimental Approach. Available at:
https://pdfs.semanticscholar.org/fe00/87c26b7f6edeeb33f53c3315a2ed8043314c.pdf [Accessed 5
August, 2019).
Shevchenko, Y., Helversen, B.V. and Scheibehenne, B. (2014). Change and status quo in decisions
with defaults: The effect of incidental emotions depends on the type of default.Judgement and
Decision Making.9(3). pp. 287–296. Available at: http://journal.sjdm.org/13/13722/jdm13722.pdf.
[Accessed 5 August, 2019).
The University of Nottingham. (2010). Behavioural Economics and the Financial Services
Consumer: A Review. Available at:
https://www.nottingham.ac.uk/business/businesscentres/gcbfi/documents/researchreports/
paper92.pdf [Accessed 5 August, 2019).
The Economy. (2015).The marginal rate of substitution. Available at: https://core-econ.org/the-
economy/book/text/leibniz-03-02-01.html [Accessed 5 August, 2019).
University of Lancaster. (n.d.). Budget constraints. Available at:
https://www.lancaster.ac.uk/staff/desilvad/Varian9e_LecturePPTs_Ch02.pdf [Accessed 5 August,
2019).
10
1 out of 11
Related Documents


Your All-in-One AI-Powered Toolkit for Academic Success.
+13062052269
info@desklib.com
Available 24*7 on WhatsApp / Email
![[object Object]](/_next/static/media/star-bottom.7253800d.svg)
Unlock your academic potential
© 2024 | Zucol Services PVT LTD | All rights reserved.