Economics Assignment 3: Analyzing Australian GDP and Real Wage Trends
VerifiedAdded on 2023/03/17
|11
|2274
|28
Report
AI Summary
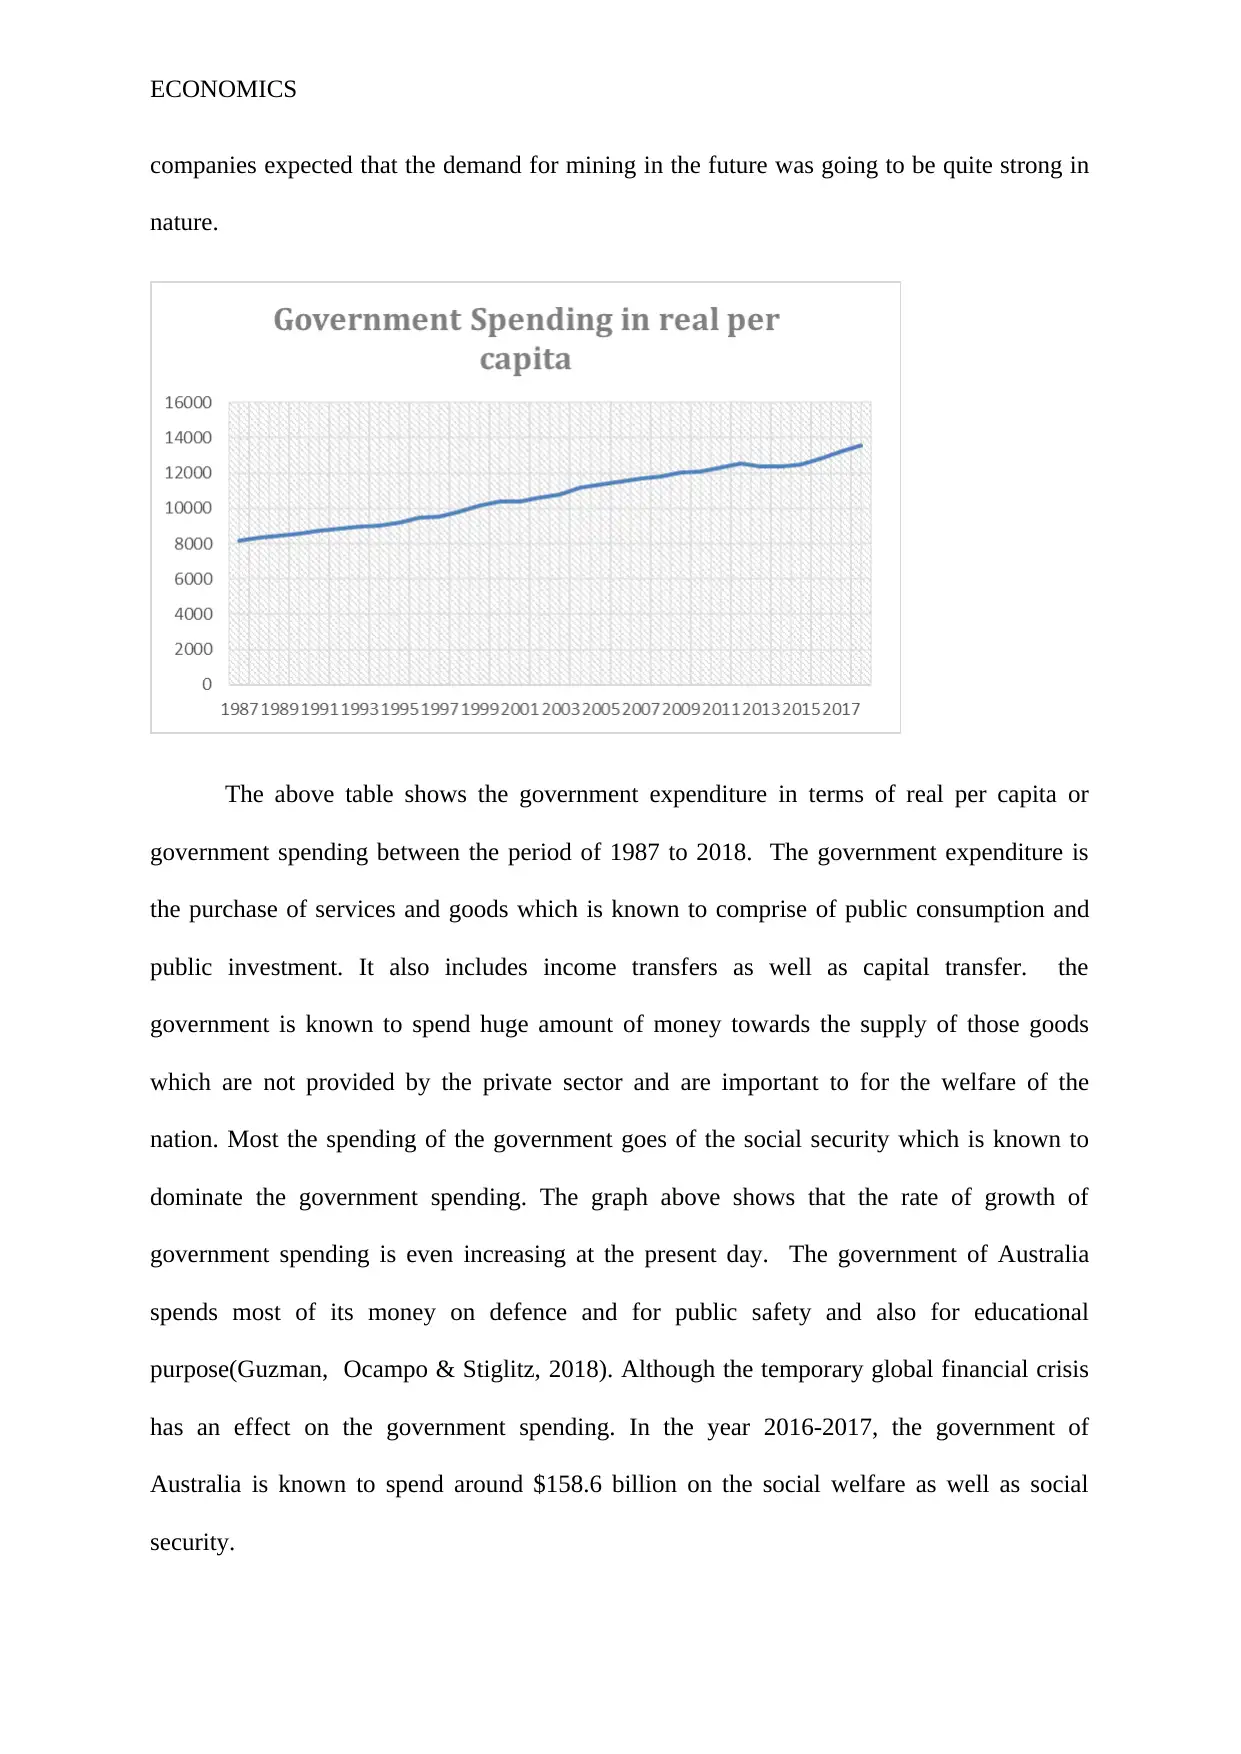
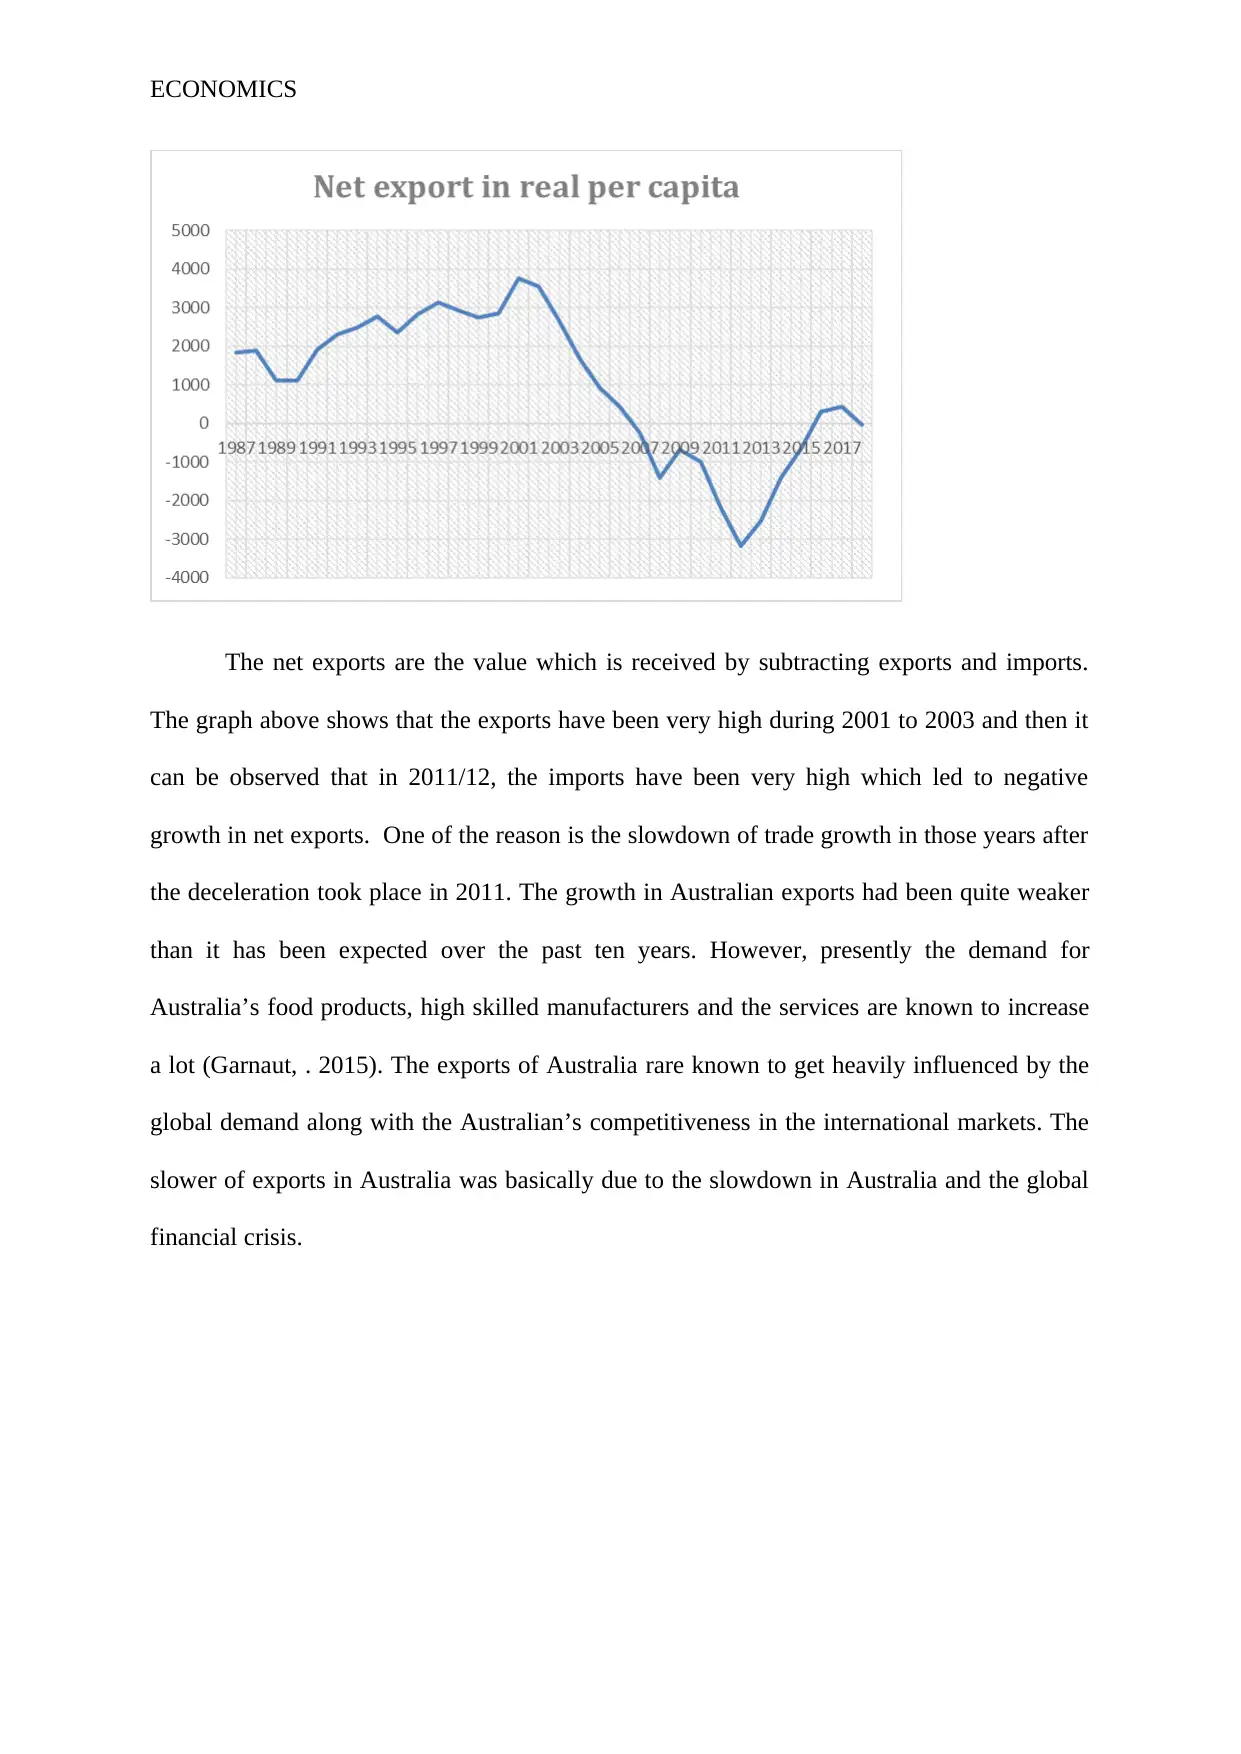
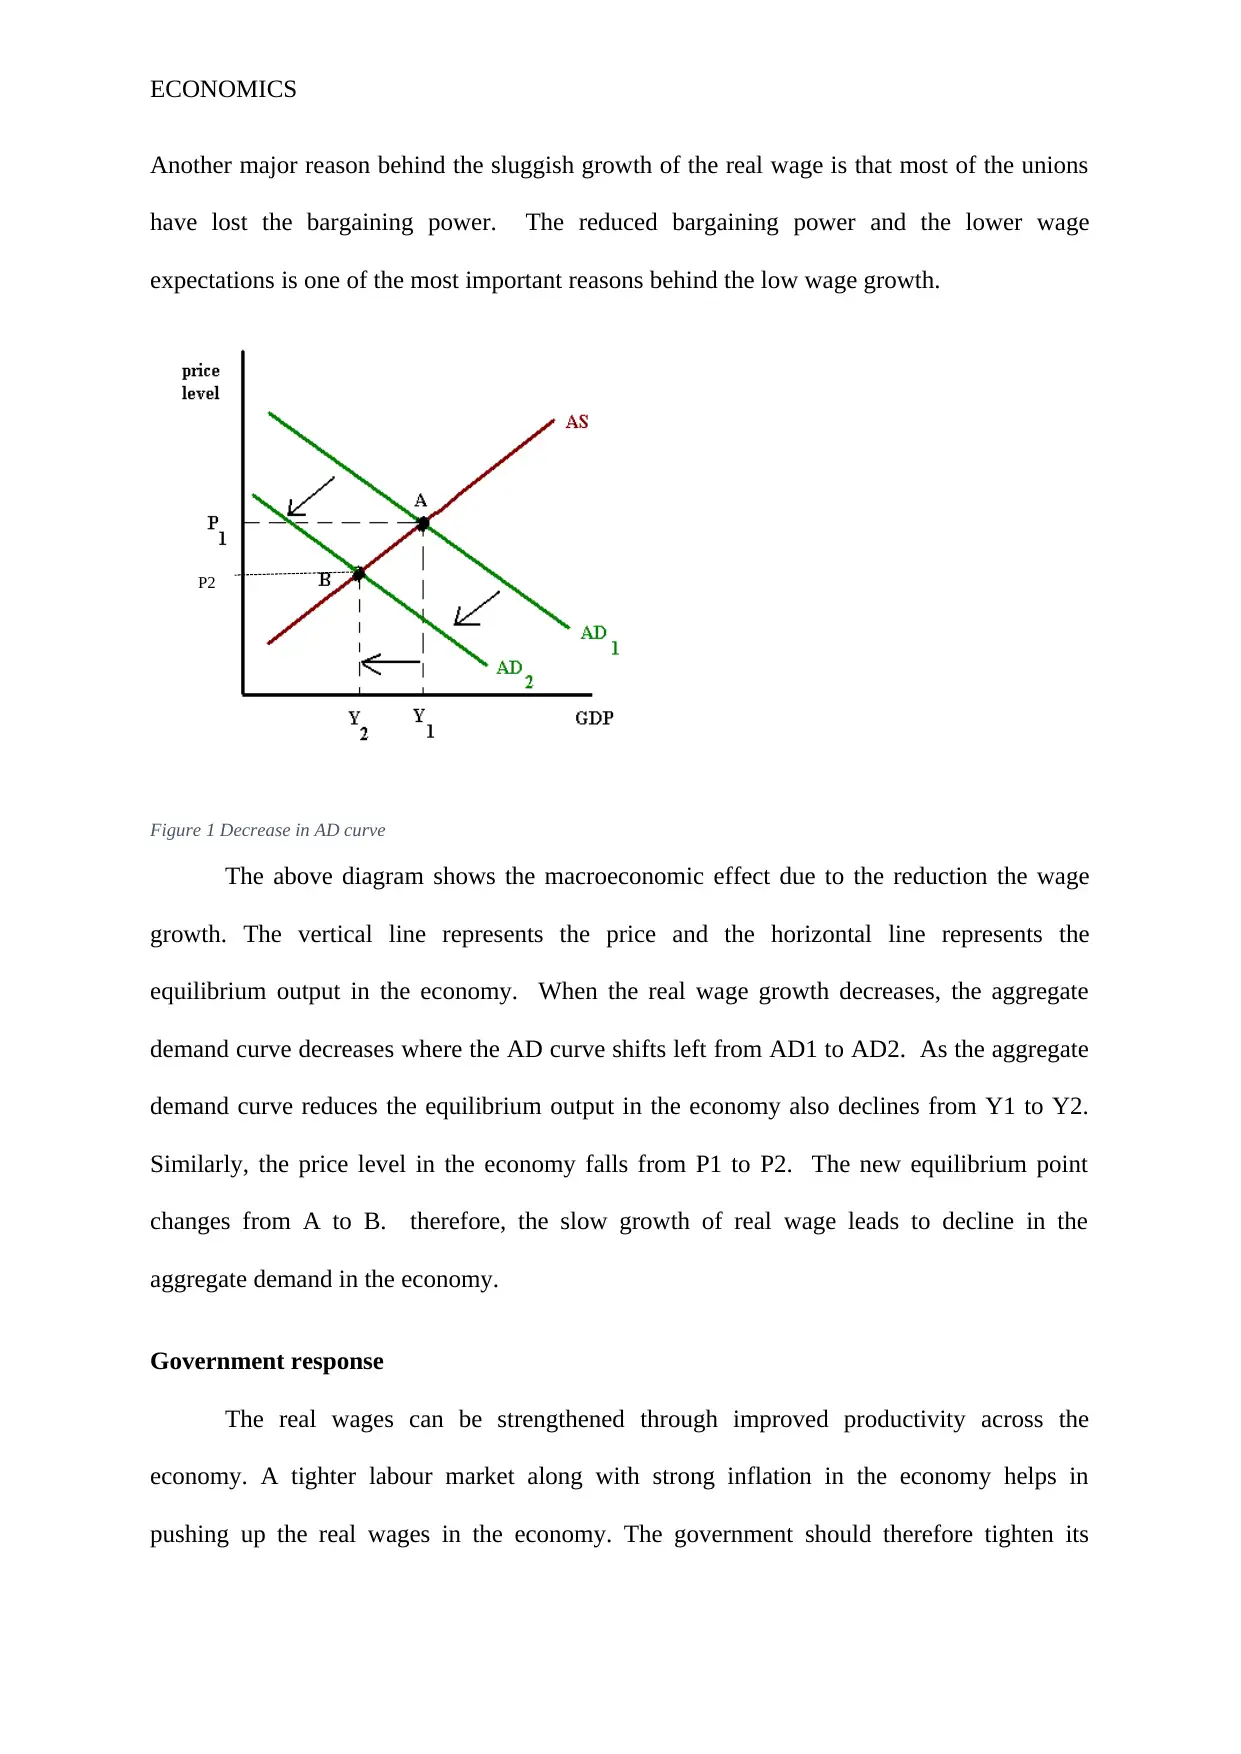
This economics assignment analyzes the Australian economy from 1987 to 2018, focusing on Gross Domestic Product (GDP) components and real wage dynamics. The report begins by examining the four expenditure components of GDP – consumption, investment, government expenditure, and net exports – using data from the Australian Bureau of Statistics (ABS). These components are analyzed in real per capita terms and plotted over time, providing economic explanations for observed trends. The analysis then shifts to real wages, examining the likely impact of low real wage growth on macroeconomic equilibrium in Australia. This includes an exploration of the factors contributing to low wage growth, such as weak productivity, and the macroeconomic effects as shown by the shift in the aggregate demand curve. The report concludes by discussing potential government responses to address these economic challenges, emphasizing the importance of productivity improvements and strategic monetary policies. The assignment incorporates relevant diagrams, data analysis, and economic principles to support its conclusions and recommendations.
1 out of 11
Related Documents


Your All-in-One AI-Powered Toolkit for Academic Success.
+13062052269
info@desklib.com
Available 24*7 on WhatsApp / Email
![[object Object]](/_next/static/media/star-bottom.7253800d.svg)
Copyright © 2020–2026 A2Z Services. All Rights Reserved. Developed and managed by ZUCOL.