Economics Assignment 3: GDP, Wages, and Government Intervention
VerifiedAdded on 2023/03/23
|13
|2684
|63
Homework Assignment
AI Summary
This economics assignment analyzes the Australian Gross Domestic Product (GDP) from 1987/88 to 2017/18, examining its components: consumption, investment, net exports, and government spending, all expressed in real per capita terms. The assignment uses data from the Australian Bureau of Statistics (ABS) and explores the trends and patterns in these components, providing economic explanations for the observed changes. Furthermore, the assignment delves into the concept of real wage growth in Australia, investigating the reasons behind low wage growth and its impact on the aggregate demand (AD) and aggregate supply (AS) curves. It also discusses potential government responses to address the issue, supporting the analysis with diagrams and economic principles. The assignment adheres to APA 6th style for referencing and presents the findings in a structured format, addressing the core concepts of economic analysis and the role of government intervention.

Running head: ECONOMICS
Economics
Name of the university
Name of the student
Author note
Economics
Name of the university
Name of the student
Author note
Paraphrase This Document
Need a fresh take? Get an instant paraphrase of this document with our AI Paraphraser
2ECONOMICS
Table of Contents
Answer 1....................................................................................................................................3
Investment..............................................................................................................................3
Net exports.............................................................................................................................4
Government spending............................................................................................................5
Consumption..........................................................................................................................6
Answer 2....................................................................................................................................8
Concept of the real wage growth...........................................................................................8
Reasons behind the low wage growth in Australia ( media reports).....................................8
Impact of low real wage growth on the AD AS curve.........................................................10
Response of the government................................................................................................10
Reference list............................................................................................................................12
3ECONOMICS
Answer 1
The value have been collected from Table 2. Expenditure on Gross Domestic
Product (GDP) from Australian System of National Accounts. After that the determinants
of GDP which are consumption, net exports, consumer spending and government expenditure
are divided by the population from 1987/88 to 2017/18 in order to find the values in per
capita terms. The net exports is calculated by subtracting the exports and imports.
Investment
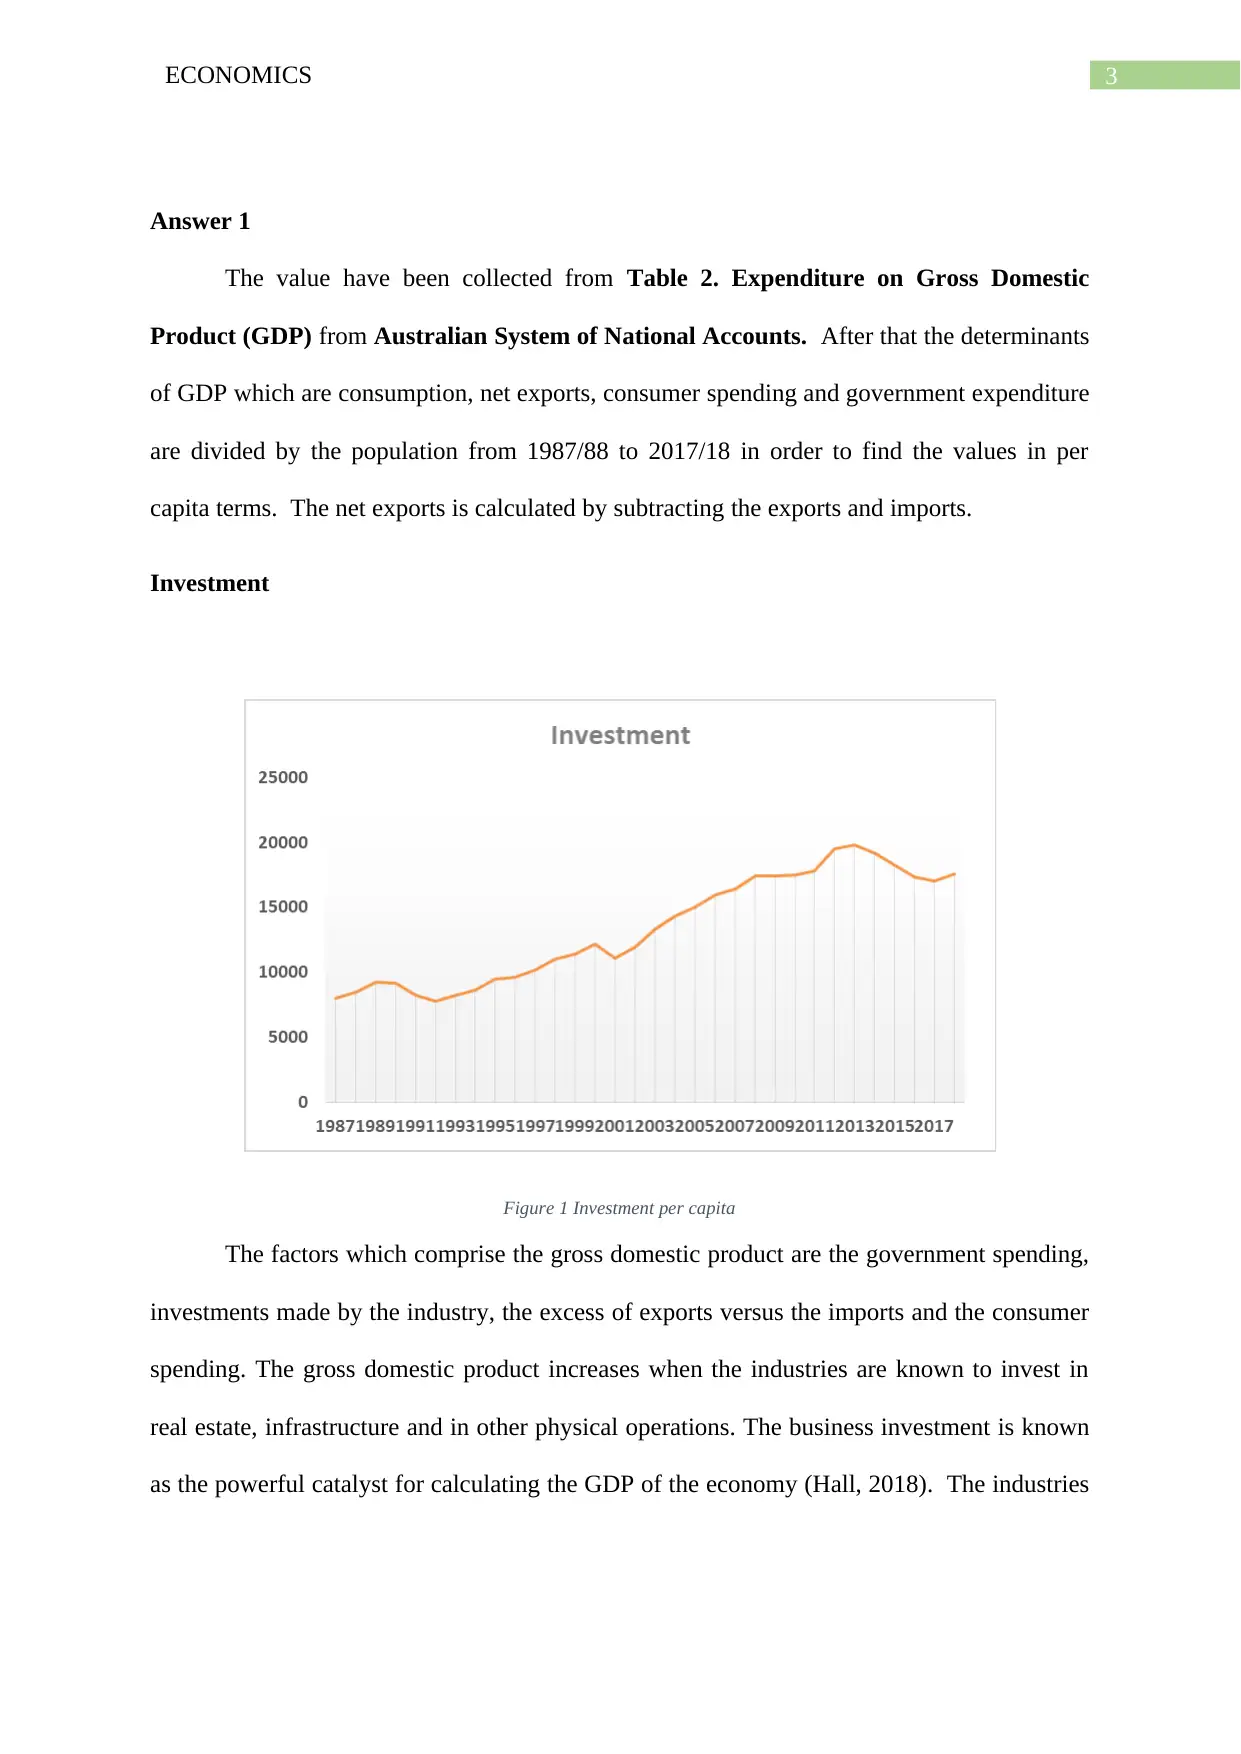
Figure 1 Investment per capita
The factors which comprise the gross domestic product are the government spending,
investments made by the industry, the excess of exports versus the imports and the consumer
spending. The gross domestic product increases when the industries are known to invest in
real estate, infrastructure and in other physical operations. The business investment is known
as the powerful catalyst for calculating the GDP of the economy (Hall, 2018). The industries
Answer 1
The value have been collected from Table 2. Expenditure on Gross Domestic
Product (GDP) from Australian System of National Accounts. After that the determinants
of GDP which are consumption, net exports, consumer spending and government expenditure
are divided by the population from 1987/88 to 2017/18 in order to find the values in per
capita terms. The net exports is calculated by subtracting the exports and imports.
Investment
Figure 1 Investment per capita
The factors which comprise the gross domestic product are the government spending,
investments made by the industry, the excess of exports versus the imports and the consumer
spending. The gross domestic product increases when the industries are known to invest in
real estate, infrastructure and in other physical operations. The business investment is known
as the powerful catalyst for calculating the GDP of the economy (Hall, 2018). The industries
⊘ This is a preview!⊘
Do you want full access?
Subscribe today to unlock all pages.
Trusted by 1+ million students worldwide
4ECONOMICS
whose business invest more of its profits will be growing and it comprise a large percentage
of the gross domestic product. Investment can also result to boom in the economy.
The graph above shows the investment in terms of per capita from the year 1987 to
2018. The graph shows that the rate of investment had not been so high during the initial
periods. However it starts increasing from 1997 and reached the record high during 2012
2013. One of the reason for this high rise is due to the mining boom which took place during
2012 and 2013. Therefore it can be said that the during the period of 2012 and 2013, mostly
took place due to the mining investment or the commodity bubble. The investment spending
had been historically high from the past decade.
Net exports
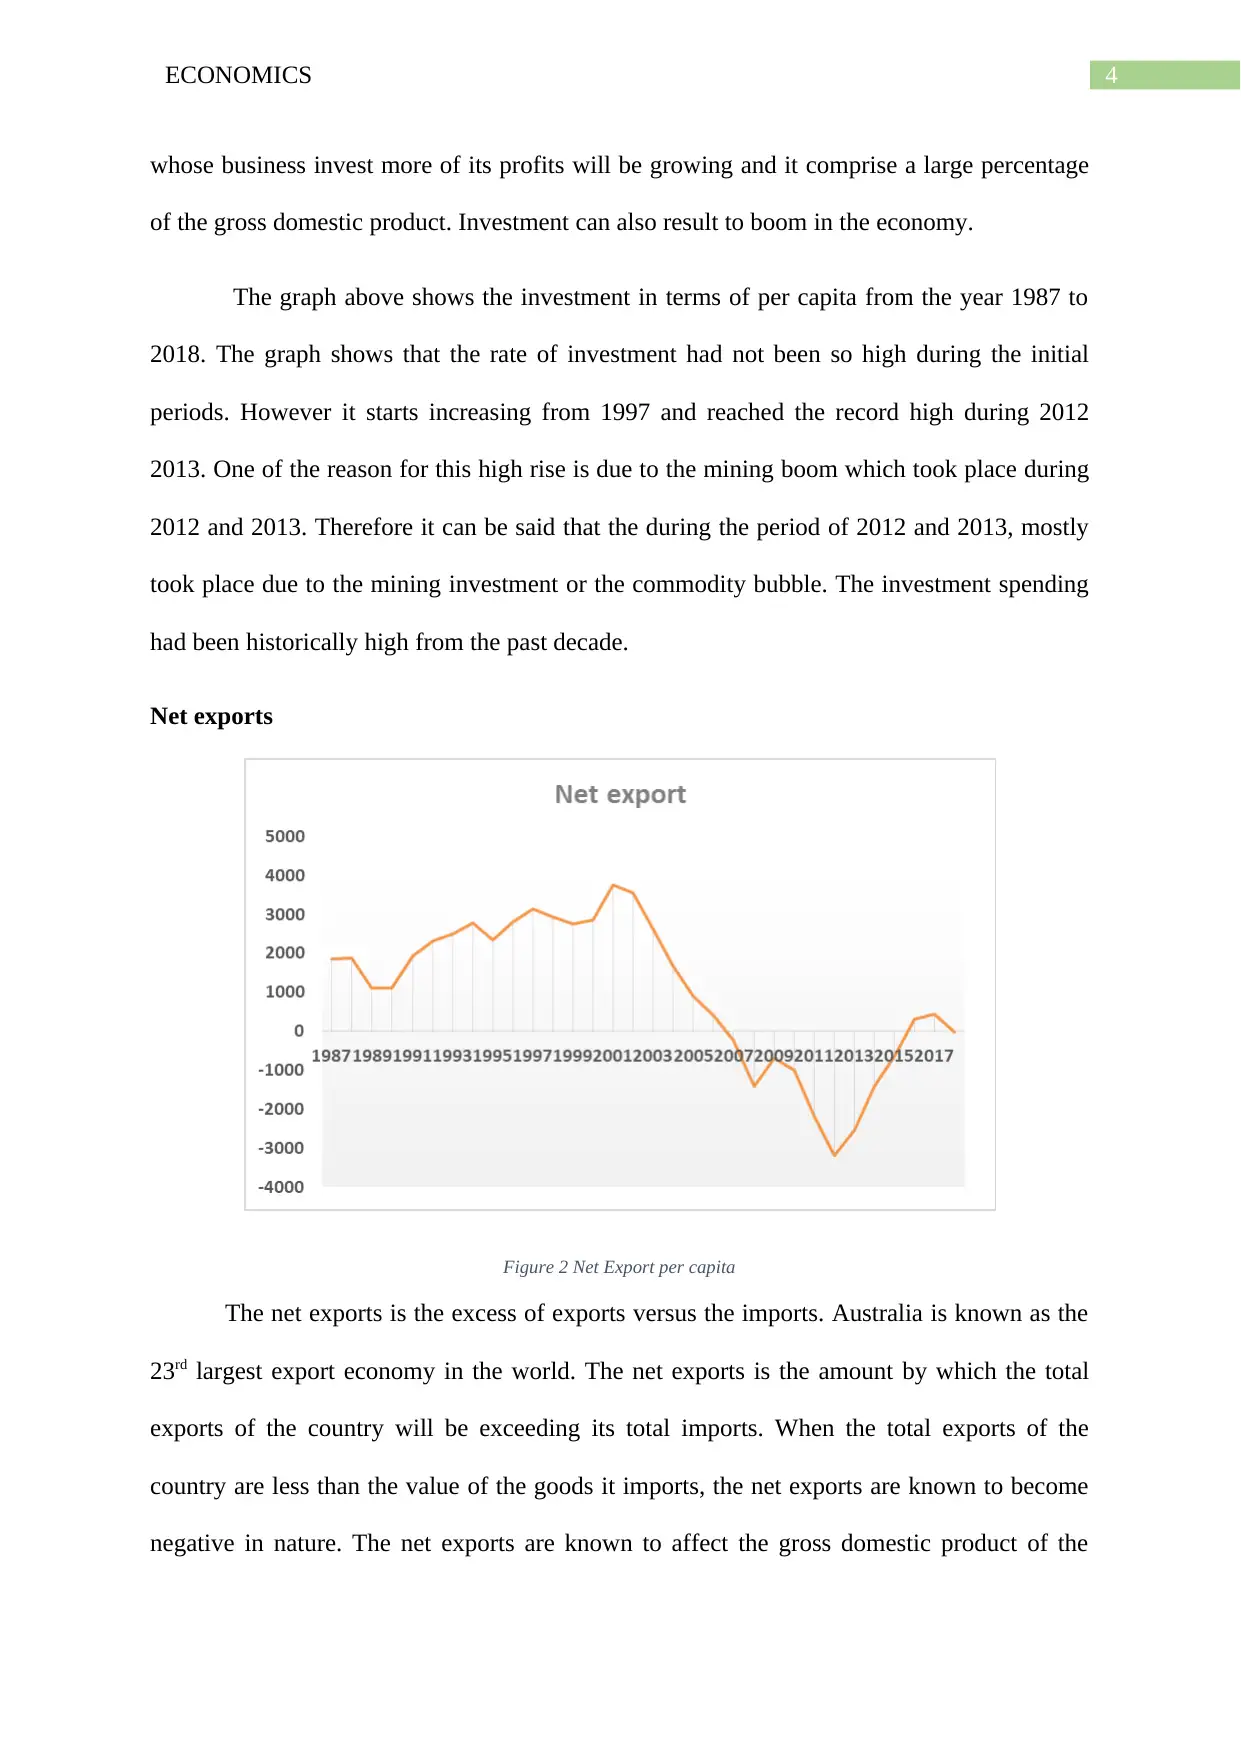
Figure 2 Net Export per capita
The net exports is the excess of exports versus the imports. Australia is known as the
23rd largest export economy in the world. The net exports is the amount by which the total
exports of the country will be exceeding its total imports. When the total exports of the
country are less than the value of the goods it imports, the net exports are known to become
negative in nature. The net exports are known to affect the gross domestic product of the
whose business invest more of its profits will be growing and it comprise a large percentage
of the gross domestic product. Investment can also result to boom in the economy.
The graph above shows the investment in terms of per capita from the year 1987 to
2018. The graph shows that the rate of investment had not been so high during the initial
periods. However it starts increasing from 1997 and reached the record high during 2012
2013. One of the reason for this high rise is due to the mining boom which took place during
2012 and 2013. Therefore it can be said that the during the period of 2012 and 2013, mostly
took place due to the mining investment or the commodity bubble. The investment spending
had been historically high from the past decade.
Net exports
Figure 2 Net Export per capita
The net exports is the excess of exports versus the imports. Australia is known as the
23rd largest export economy in the world. The net exports is the amount by which the total
exports of the country will be exceeding its total imports. When the total exports of the
country are less than the value of the goods it imports, the net exports are known to become
negative in nature. The net exports are known to affect the gross domestic product of the
Paraphrase This Document
Need a fresh take? Get an instant paraphrase of this document with our AI Paraphraser
5ECONOMICS
economy. When any country exports goods, it will sell them to the foreign market that is to
the consumers in another country (Hutchens & Jericho, 2018). Then those exports will be
bringing money into the country that will increase the gross domestic product of the
exporting country.
When the country will be importing more than the exports, the money leaves the
economy which then decreases the gross domestic product of the importing nation. The next
exports became negative from the year 2007 since the imports were known to be exceeding
the exports however, the value have seen to be improved after 2015 (Australian Bureau of
Statistics, Australian Government., 2019). The net exports had been quite high during 2001
to 2003.
Government spending
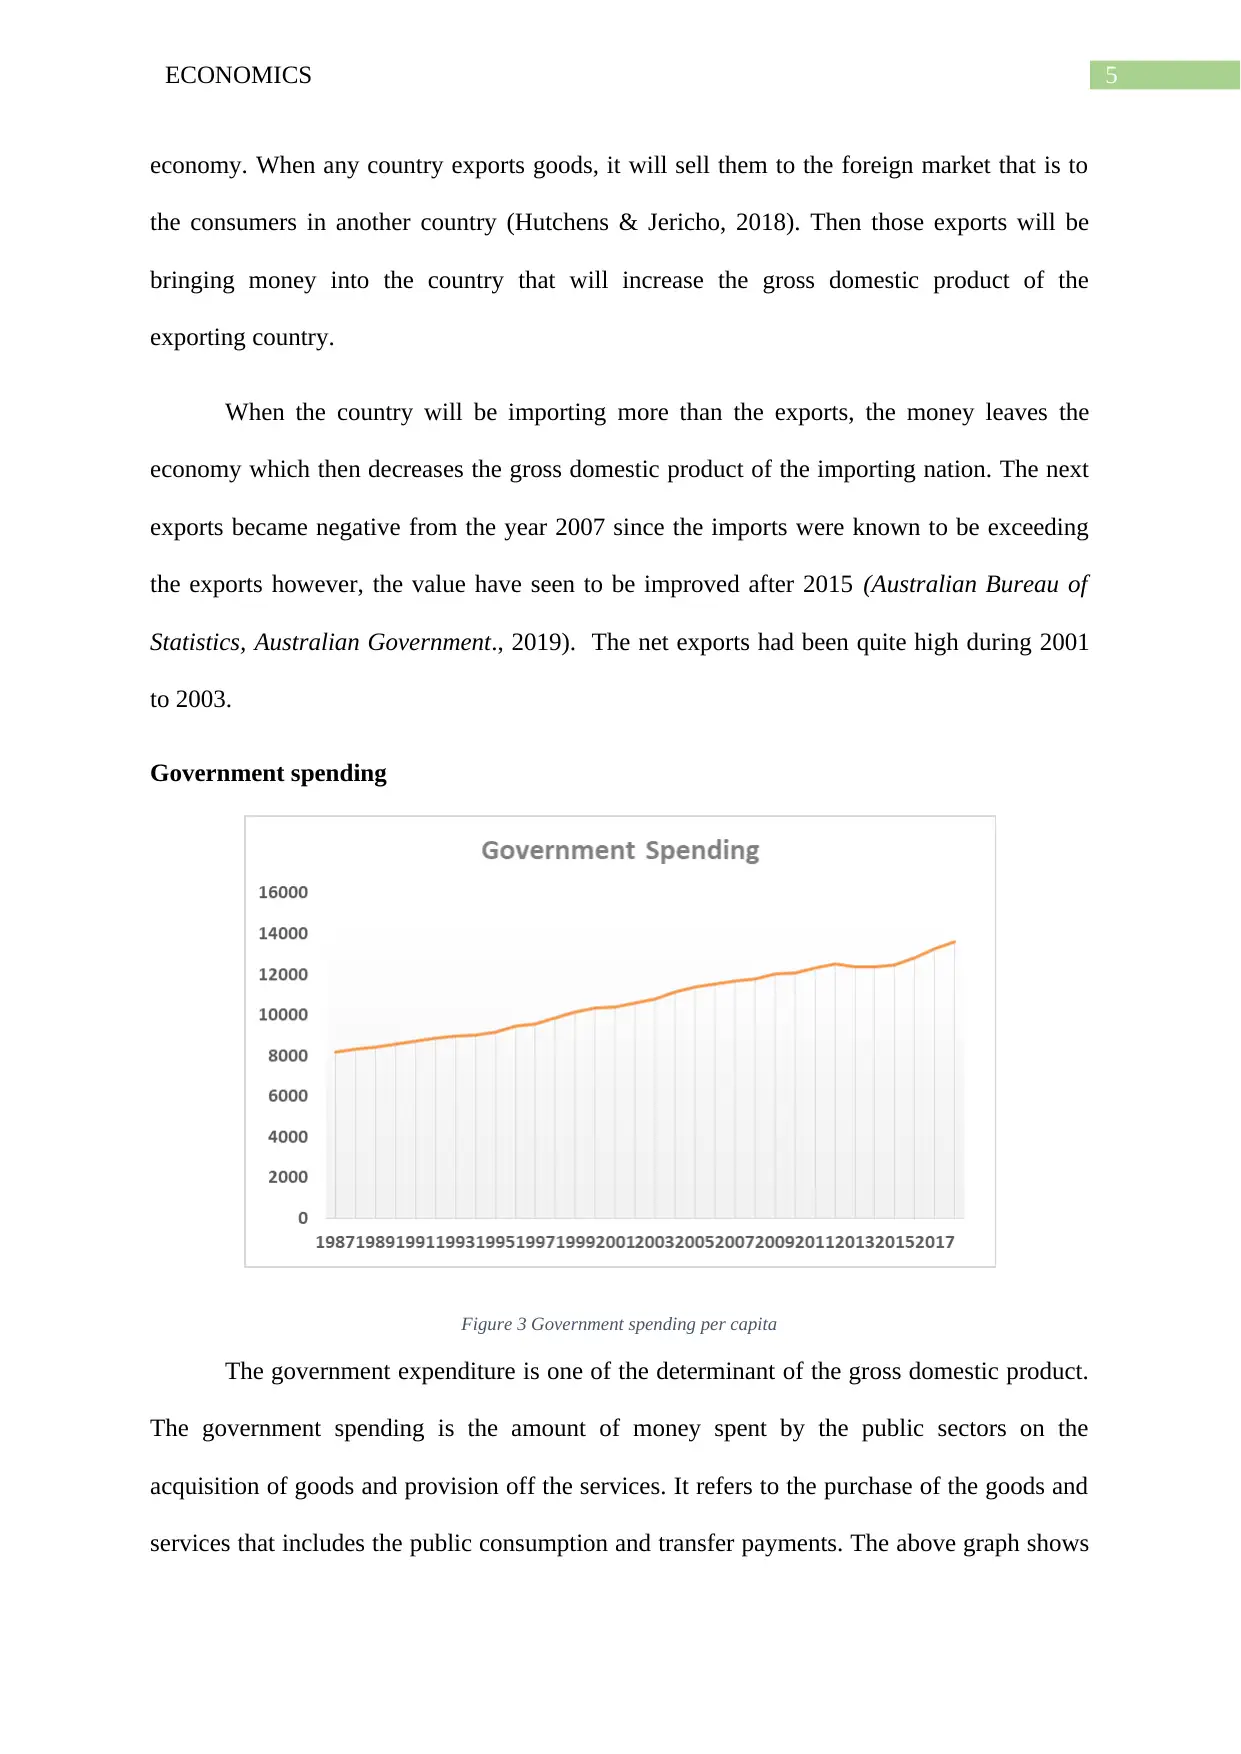
Figure 3 Government spending per capita
The government expenditure is one of the determinant of the gross domestic product.
The government spending is the amount of money spent by the public sectors on the
acquisition of goods and provision off the services. It refers to the purchase of the goods and
services that includes the public consumption and transfer payments. The above graph shows
economy. When any country exports goods, it will sell them to the foreign market that is to
the consumers in another country (Hutchens & Jericho, 2018). Then those exports will be
bringing money into the country that will increase the gross domestic product of the
exporting country.
When the country will be importing more than the exports, the money leaves the
economy which then decreases the gross domestic product of the importing nation. The next
exports became negative from the year 2007 since the imports were known to be exceeding
the exports however, the value have seen to be improved after 2015 (Australian Bureau of
Statistics, Australian Government., 2019). The net exports had been quite high during 2001
to 2003.
Government spending
Figure 3 Government spending per capita
The government expenditure is one of the determinant of the gross domestic product.
The government spending is the amount of money spent by the public sectors on the
acquisition of goods and provision off the services. It refers to the purchase of the goods and
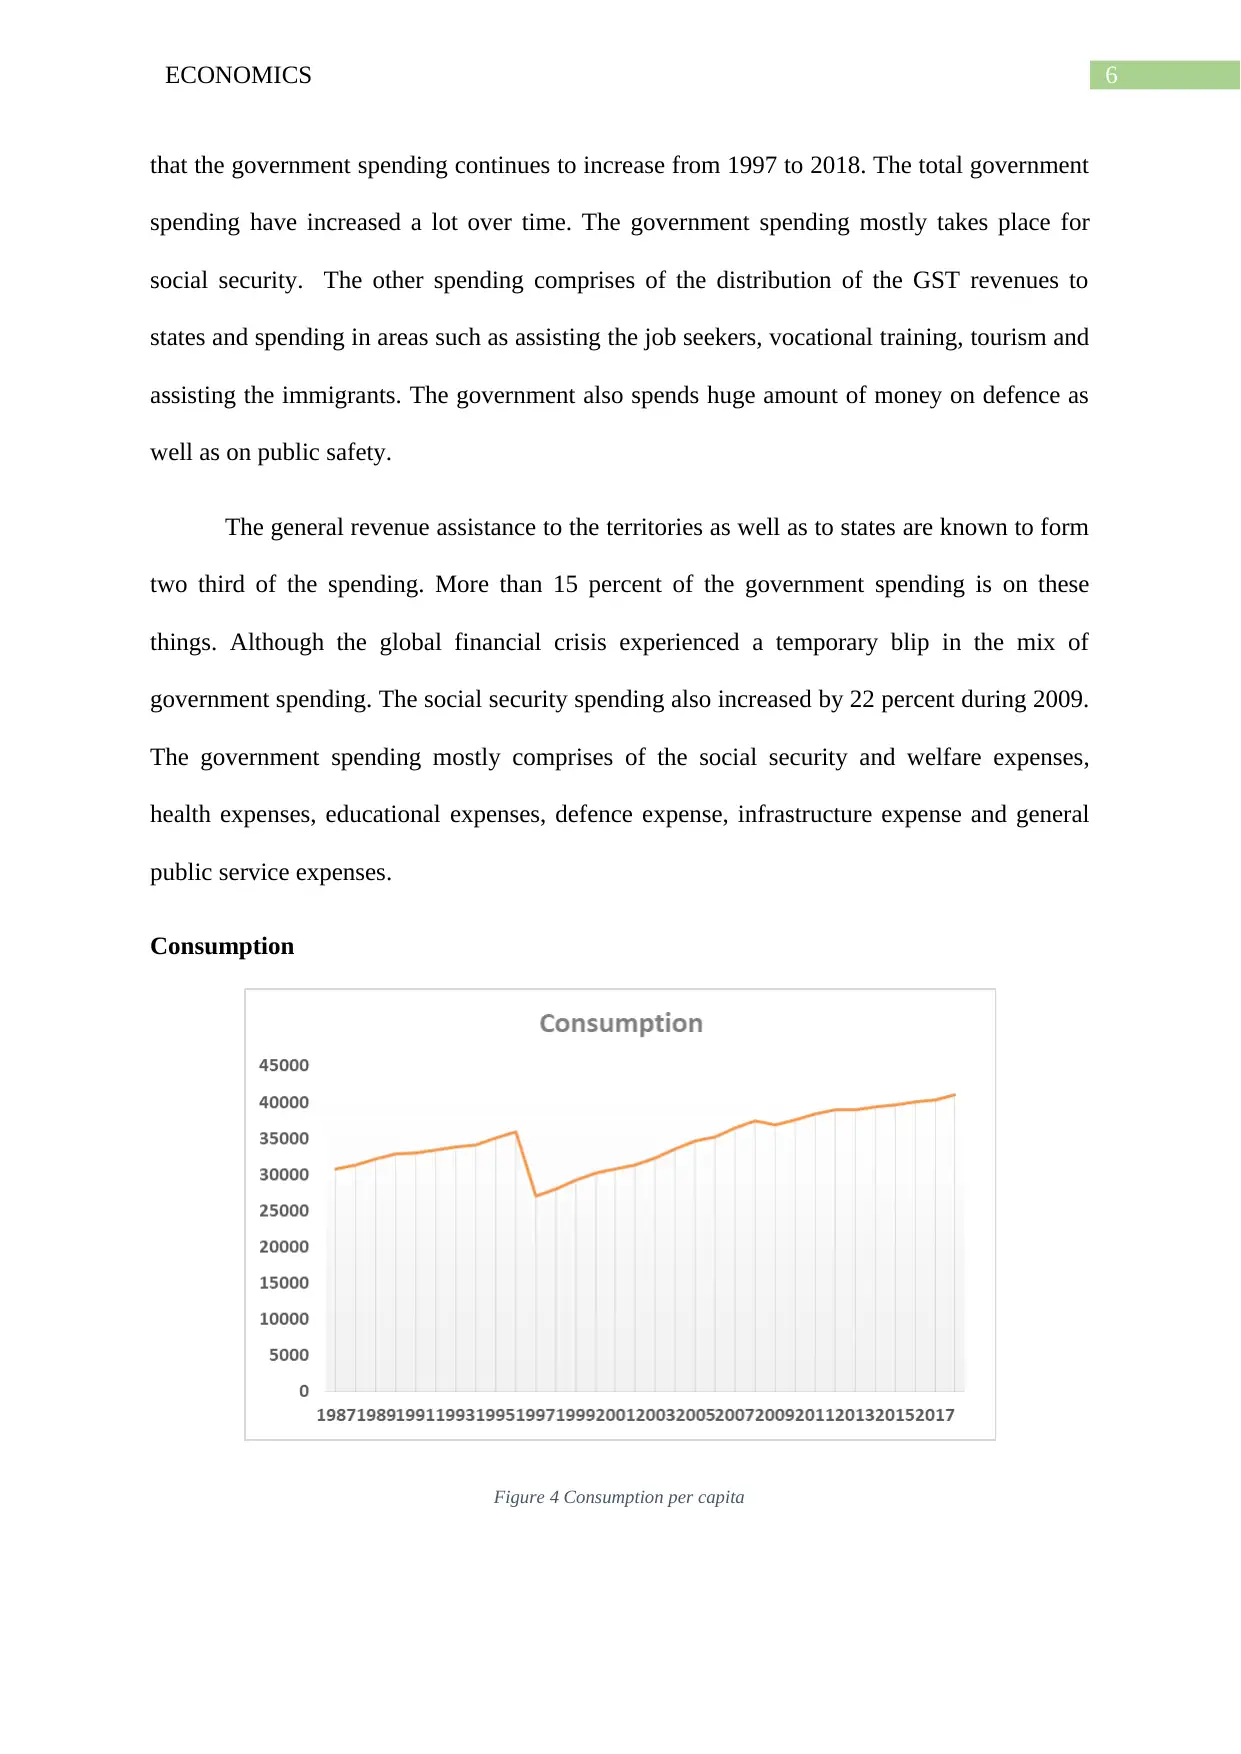
services that includes the public consumption and transfer payments. The above graph shows
6ECONOMICS
that the government spending continues to increase from 1997 to 2018. The total government
spending have increased a lot over time. The government spending mostly takes place for
social security. The other spending comprises of the distribution of the GST revenues to
states and spending in areas such as assisting the job seekers, vocational training, tourism and
assisting the immigrants. The government also spends huge amount of money on defence as
well as on public safety.
The general revenue assistance to the territories as well as to states are known to form
two third of the spending. More than 15 percent of the government spending is on these
things. Although the global financial crisis experienced a temporary blip in the mix of
government spending. The social security spending also increased by 22 percent during 2009.
The government spending mostly comprises of the social security and welfare expenses,
health expenses, educational expenses, defence expense, infrastructure expense and general
public service expenses.
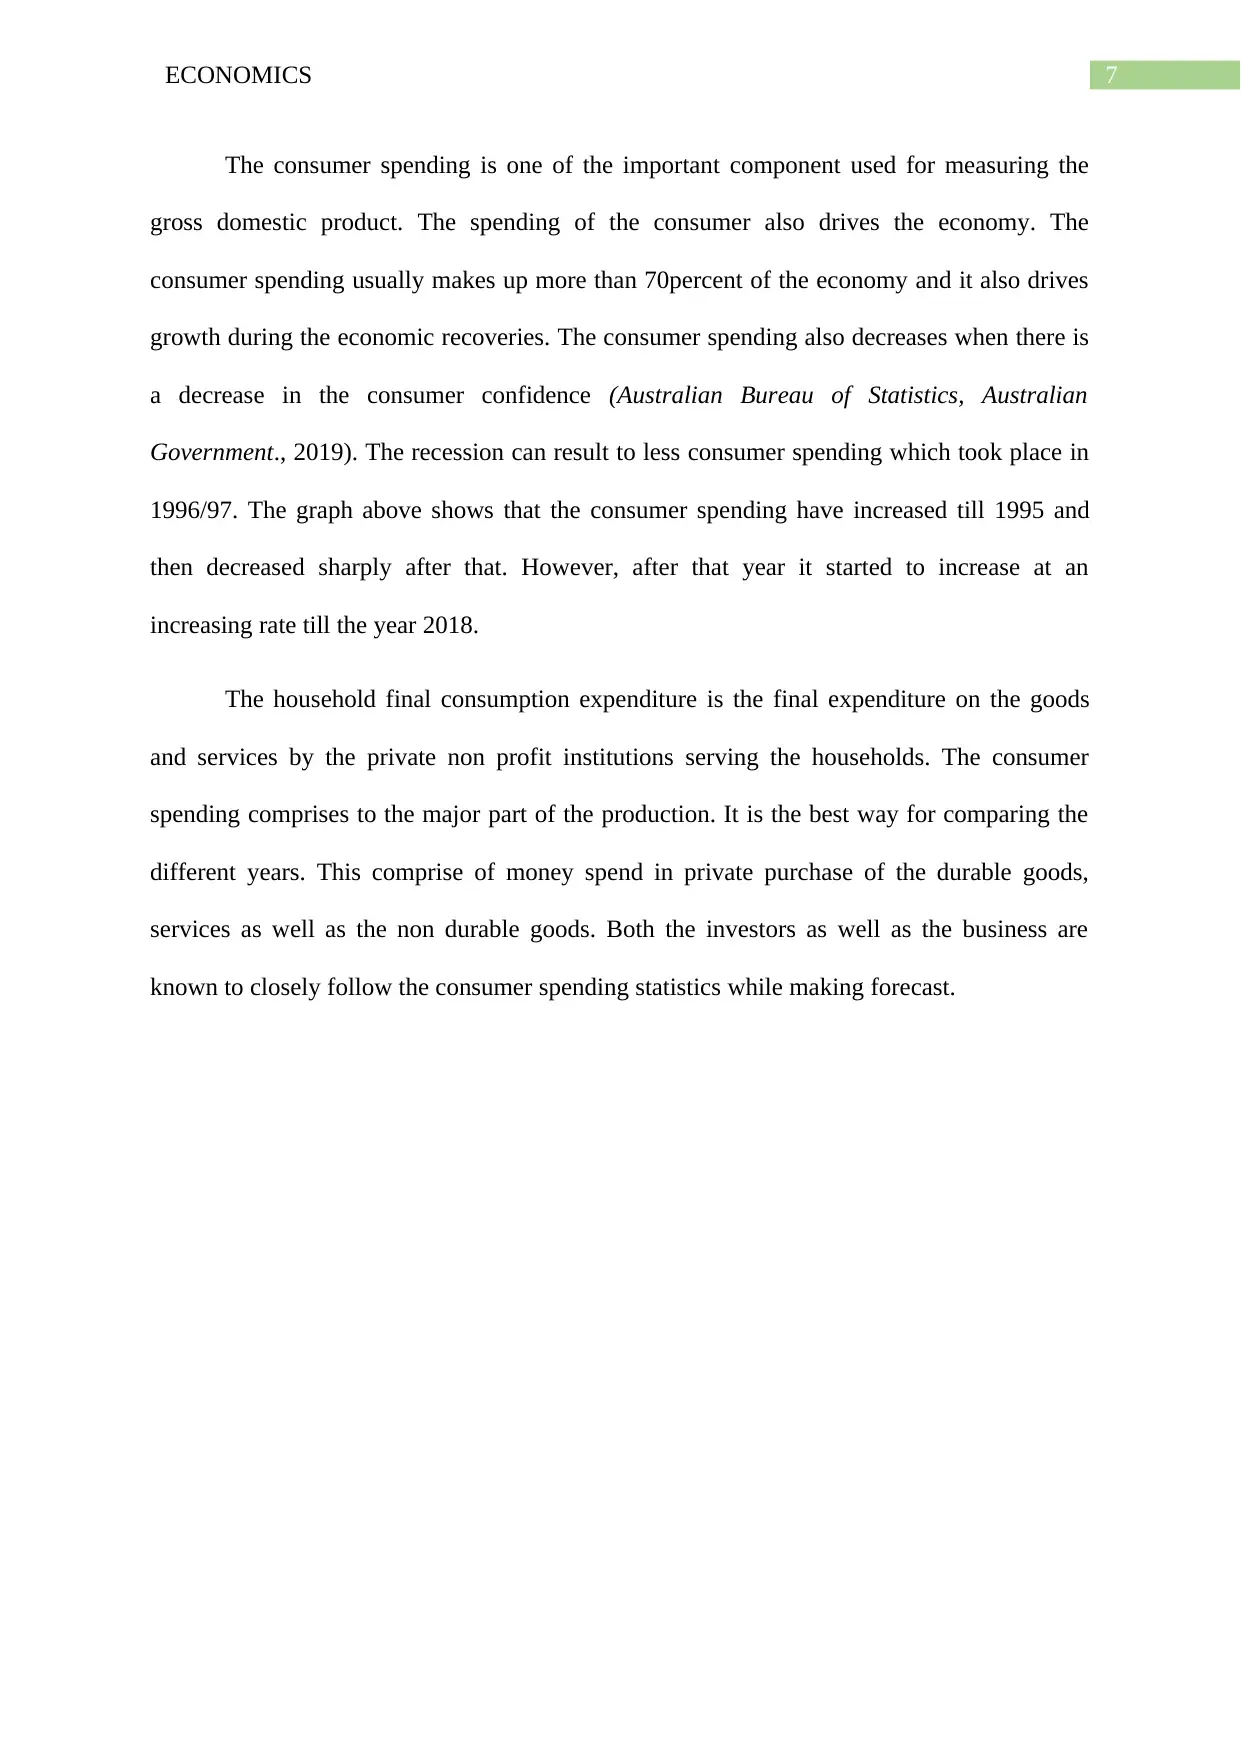
Consumption
Figure 4 Consumption per capita
that the government spending continues to increase from 1997 to 2018. The total government
spending have increased a lot over time. The government spending mostly takes place for
social security. The other spending comprises of the distribution of the GST revenues to
states and spending in areas such as assisting the job seekers, vocational training, tourism and
assisting the immigrants. The government also spends huge amount of money on defence as
well as on public safety.
The general revenue assistance to the territories as well as to states are known to form
two third of the spending. More than 15 percent of the government spending is on these
things. Although the global financial crisis experienced a temporary blip in the mix of
government spending. The social security spending also increased by 22 percent during 2009.
The government spending mostly comprises of the social security and welfare expenses,
health expenses, educational expenses, defence expense, infrastructure expense and general
public service expenses.
Consumption
Figure 4 Consumption per capita
⊘ This is a preview!⊘
Do you want full access?
Subscribe today to unlock all pages.
Trusted by 1+ million students worldwide
7ECONOMICS
The consumer spending is one of the important component used for measuring the
gross domestic product. The spending of the consumer also drives the economy. The
consumer spending usually makes up more than 70percent of the economy and it also drives
growth during the economic recoveries. The consumer spending also decreases when there is
a decrease in the consumer confidence (Australian Bureau of Statistics, Australian
Government., 2019). The recession can result to less consumer spending which took place in
1996/97. The graph above shows that the consumer spending have increased till 1995 and
then decreased sharply after that. However, after that year it started to increase at an
increasing rate till the year 2018.
The household final consumption expenditure is the final expenditure on the goods
and services by the private non profit institutions serving the households. The consumer
spending comprises to the major part of the production. It is the best way for comparing the
different years. This comprise of money spend in private purchase of the durable goods,
services as well as the non durable goods. Both the investors as well as the business are
known to closely follow the consumer spending statistics while making forecast.
Paraphrase This Document
Need a fresh take? Get an instant paraphrase of this document with our AI Paraphraser
8ECONOMICS
Answer 2
Concept of the real wage growth
The wages which are adjusted for inflation in terms of the amount of goods which can
be brought are termed as the real wages. The real wages are known to be adjusted to account
for the changes in prices of goods and services in order to provide a clear representation of
the wages of individuals in terms of what they can afford to buy with those wages.
There are presence of difference between the real wage and the nominal wage. The
nominal wages are those wages which are received by the worker in the form of money. This
kind of wages are termed as the money wages. On the other hand, the real wage are the
amount of goods and services which the worker purchases from the nominal wages. For this
reason, it can be said that the real wages are the purchasing power of the nominal wages. The
classical theories the labour supply is known to be determined by the real wages whereas the
Keynes states that labour supply mainly depends in nominal wages. Therefore, in case of real
wages are known to depend on inflation whereas the nominal wage does not depend on
inflation.
Reasons behind the low wage growth in Australia ( media reports)
It have been found out that there have been significant slowing in the wage growth in
Australia over the past five years. The wage problem in Australia started with the global
financial crisis and leads to a difficult economic environment. The low wage growth in
Australia is known to reflect mostly the poor performance which took place mostly due to the
end of the commodity price boom with the increase in the labour force underutilization rate
(Low wage growth is not just harming you, it's threatening the economy. 2018). However, the
recent wage growth appears to be very much less sensitive to the improvements in the
underutilization rate as result of the reduced bargaining power.
9ECONOMICS
The four most important factor behind the slowdown of the real wage growth in Australia
are;
Presence of excess capacity in the labour market- the presence of excess capacity
means that the demand for the labour is less than the supply. The excess capacity
therefore can sometimes hurt the economy. The rate of unemployment had been
falling steadily from 6 percent in 2014 to 5 percent where the rate of unemployment
had bee also quite high in nature. The numbers suggest that there is a still a huge
number of people who are known to look for jobs resulting to subdued wage growth.
Both the unemployed and underemployed people have increased in the recent decade.
Decline in the terms of trade- the terms of trade leads to sharp fall due to the winding
back of the boom in the mining investment. The Australian firms are known to offer
higher wages during those period when the terms of trade had been more favourable
in nature. As the mining boom had subsided the terms of trade went back to the lower
levels declining by 35 percent between 2011 and 2016 (The extent and causes of the
wage growth slowdown in Australia – Parliament of Australia, 2019). During the mid
2008 the mining industry peaked at 6 percent and despite shortage of skills they used
to offer higher wages to the people.
Reduced bargaining power- the reduced bargaining power is one of the reason behind
the sluggish wage growth in Australia. Lagging inflation along with the reduced union
power leads to low wage growth in Australia.
Declining expectation of inflation- the decline in the expectation of inflation in the
economy takes place due to the subdued wage growth that is supported by the union
official. The declining expectation of inflation leads to a sluggish wage growth. The
actual rate of inflation have been recorded quite low below the expectation for both
the trade unions and market economist.
⊘ This is a preview!⊘
Do you want full access?
Subscribe today to unlock all pages.
Trusted by 1+ million students worldwide
10ECONOMICS
Impact of low real wage growth on the AD AS curve
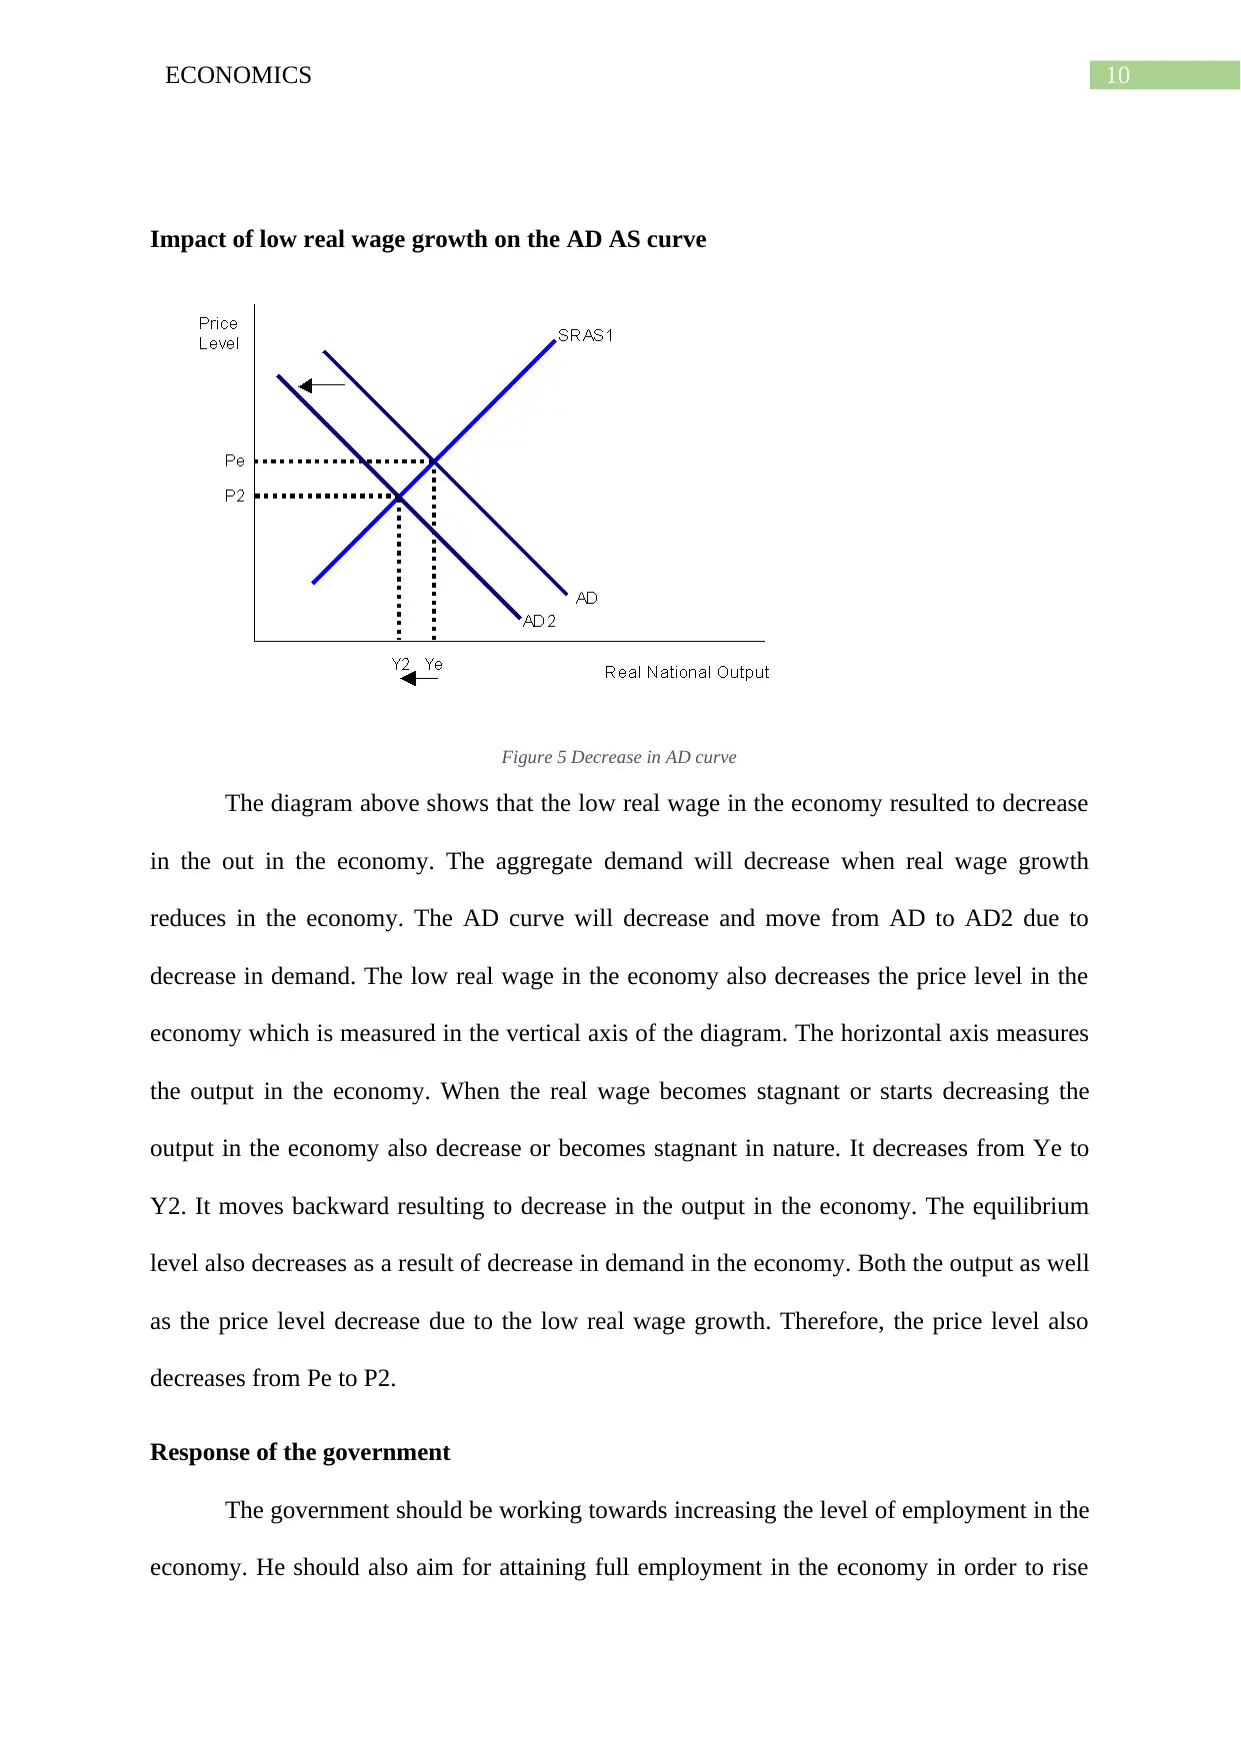
Figure 5 Decrease in AD curve
The diagram above shows that the low real wage in the economy resulted to decrease
in the out in the economy. The aggregate demand will decrease when real wage growth
reduces in the economy. The AD curve will decrease and move from AD to AD2 due to
decrease in demand. The low real wage in the economy also decreases the price level in the
economy which is measured in the vertical axis of the diagram. The horizontal axis measures
the output in the economy. When the real wage becomes stagnant or starts decreasing the
output in the economy also decrease or becomes stagnant in nature. It decreases from Ye to
Y2. It moves backward resulting to decrease in the output in the economy. The equilibrium
level also decreases as a result of decrease in demand in the economy. Both the output as well
as the price level decrease due to the low real wage growth. Therefore, the price level also
decreases from Pe to P2.
Response of the government
The government should be working towards increasing the level of employment in the
economy. He should also aim for attaining full employment in the economy in order to rise
Impact of low real wage growth on the AD AS curve
Figure 5 Decrease in AD curve
The diagram above shows that the low real wage in the economy resulted to decrease
in the out in the economy. The aggregate demand will decrease when real wage growth
reduces in the economy. The AD curve will decrease and move from AD to AD2 due to
decrease in demand. The low real wage in the economy also decreases the price level in the
economy which is measured in the vertical axis of the diagram. The horizontal axis measures
the output in the economy. When the real wage becomes stagnant or starts decreasing the
output in the economy also decrease or becomes stagnant in nature. It decreases from Ye to
Y2. It moves backward resulting to decrease in the output in the economy. The equilibrium
level also decreases as a result of decrease in demand in the economy. Both the output as well
as the price level decrease due to the low real wage growth. Therefore, the price level also
decreases from Pe to P2.
Response of the government
The government should be working towards increasing the level of employment in the
economy. He should also aim for attaining full employment in the economy in order to rise
Paraphrase This Document
Need a fresh take? Get an instant paraphrase of this document with our AI Paraphraser
11ECONOMICS
the real wage in the economy. The government should be making such policies that will
create jobs or help in reaching full employment in the economy. He should be investing in
education, reducing trade deficit, increase investment in transportation( The extent and
causes of the wage growth slowdown in Australia – Parliament of Australia, 2019). The
government should be reforming the monetary policies which will target full employment in
the economy. The monetary policy should be allowing the wage growth to match the gains of
productivity. Reducing trade deficit will also help in revitalizing the economy.
The low wage growth in Australia is known to reflect mostly the poor performance
which took place mostly due to the end of the commodity price boom with the increase in the
labour force underutilization rate the trade deficit leads to a huge reduction in gross domestic
product of the output (Robinson, Nguyen & Wang, 2017). Therefore exports should be
increased and should be more than imports which will help in revitalizing the economic
growth. The government should also invest in infrastructure, transportation and business.
Public investment can help in creation of new jobs which in terms raises productivity and
growth.
12ECONOMICS
Reference list
Low wage growth is not just harming you, it's threatening the economy. (2018). ABC News.
Retrieved 14 May 2019, from https://www.abc.net.au/news/2018-06-14/low-wage-growth-
working-australias-great-struggle/9871514
Australian Bureau of Statistics, Australian Government. (2019). Abs.gov.au. Retrieved 14
May 2019, from https://www.abs.gov.au/
The extent and causes of the wage growth slowdown in Australia – Parliament of Australia .
(2019). Aph.gov.au. Retrieved 14 May 2019, from
https://www.aph.gov.au/About_Parliament/Parliamentary_Departments/
Parliamentary_Library/pubs/rp/rp1819/WageSlowdown
Hutchens, G., & Jericho, G. (2018). Who is to blame for Australia's stalled wages?. the
Guardian. Retrieved 14 May 2019, from
https://www.theguardian.com/australia-news/2018/mar/02/who-is-to-blame-for-australias-
stalled-wages
Rees, D. M., Smith, P., & Hall, J. (2016). A Multi‐sector Model of the Australian Economy.
Economic Record, 92(298), 374-408.
Schroeder, S. (2018). Just how fragile is the Australian economy?. Australian Options, (87),
18.
Manalo, J., Perera, D., & Rees, D. M. (2015). Exchange rate movements and the Australian
economy. Economic Modelling, 47, 53-62.
Rizvi, F. (2017). Asian Diaspora Advantage in the changing Australian economy. In Journal
and Proceedings of the Royal Society of New South Wales (Vol. 150, No. 463/464, p. 110).
Royal Society of New South Wales.
⊘ This is a preview!⊘
Do you want full access?
Subscribe today to unlock all pages.
Trusted by 1+ million students worldwide
1 out of 13
Related Documents


Your All-in-One AI-Powered Toolkit for Academic Success.
+13062052269
info@desklib.com
Available 24*7 on WhatsApp / Email
![[object Object]](/_next/static/media/star-bottom.7253800d.svg)
Unlock your academic potential
Copyright © 2020–2026 A2Z Services. All Rights Reserved. Developed and managed by ZUCOL.