(Doc) Economics for Business: Assignment
VerifiedAdded on 2021/06/17
|14
|2862
|135
AI Summary
Contribute Materials
Your contribution can guide someone’s learning journey. Share your
documents today.
Running Head: ECONOMICS FOR BUSINESS
Economics for Business
Name of the Student
Name of the University
Course ID
Economics for Business
Name of the Student
Name of the University
Course ID
Secure Best Marks with AI Grader
Need help grading? Try our AI Grader for instant feedback on your assignments.
1ECONOMICS FOR BUSINESS
Macroeconomic performance of a nation depends on several indicators. Gross Domestic
Product is considered as one composite measure of overall output of an economy. It gives an
overview overall performance and considered as a gross index of measuring social and economic
well-being (Mankiw 2014). The economic growth of a nation is measured as a percentage
change in GDP. In this essay, the trend growth rate of Australia over the past five years has been
discussed. Australia is a developed nation accounting a historically stable growth rate for a
considerable long period. Like most other developed nation, service sector is the biggest
contributor of GDP followed by industrial and agricultural sector. In terms of GDP, Australia
ranked 12th in the world. Australia successfully maintained its strong position in the international
market even in the phase of global financial crisis of 2008. The economy of Australia remained
relatively less harmed during global recessionary shocks. Recently, the economy however is
going through a continuous phase of economic downturn. The recent slowdown in economic
growth has resulted from a number of internal and external factors. Among the internal factors
instability in housing market and continuous decline in mining investment are the two primary
factors (Thorpe and Leitao 2014). External forces include deteriorating terms of trade flowing
slowing growth in China and depreciation of Australian dollar. The slow growth however is less
likely to put the nation in any future economic recession because of faster growth in service and
non-mining sectors. The paper aims to provide important insight about past and future prospect
economic growth of Australia.
Australia is counted as one of the fastest growing nations in the developed world. The
recent growth rate of Australia is however below the 50 years’ average growth rate of 3.2% or
even lower than the average growth rate of 20th century. The comfort news for Australia is that
there are developed nations in the world that records a slower growth rate than that Australia
2ECONOMICS FOR BUSINESS
does and also faced with problems like increasing level of national debt, burden of high taxation,
large deficit in government budget and excessive legislation.
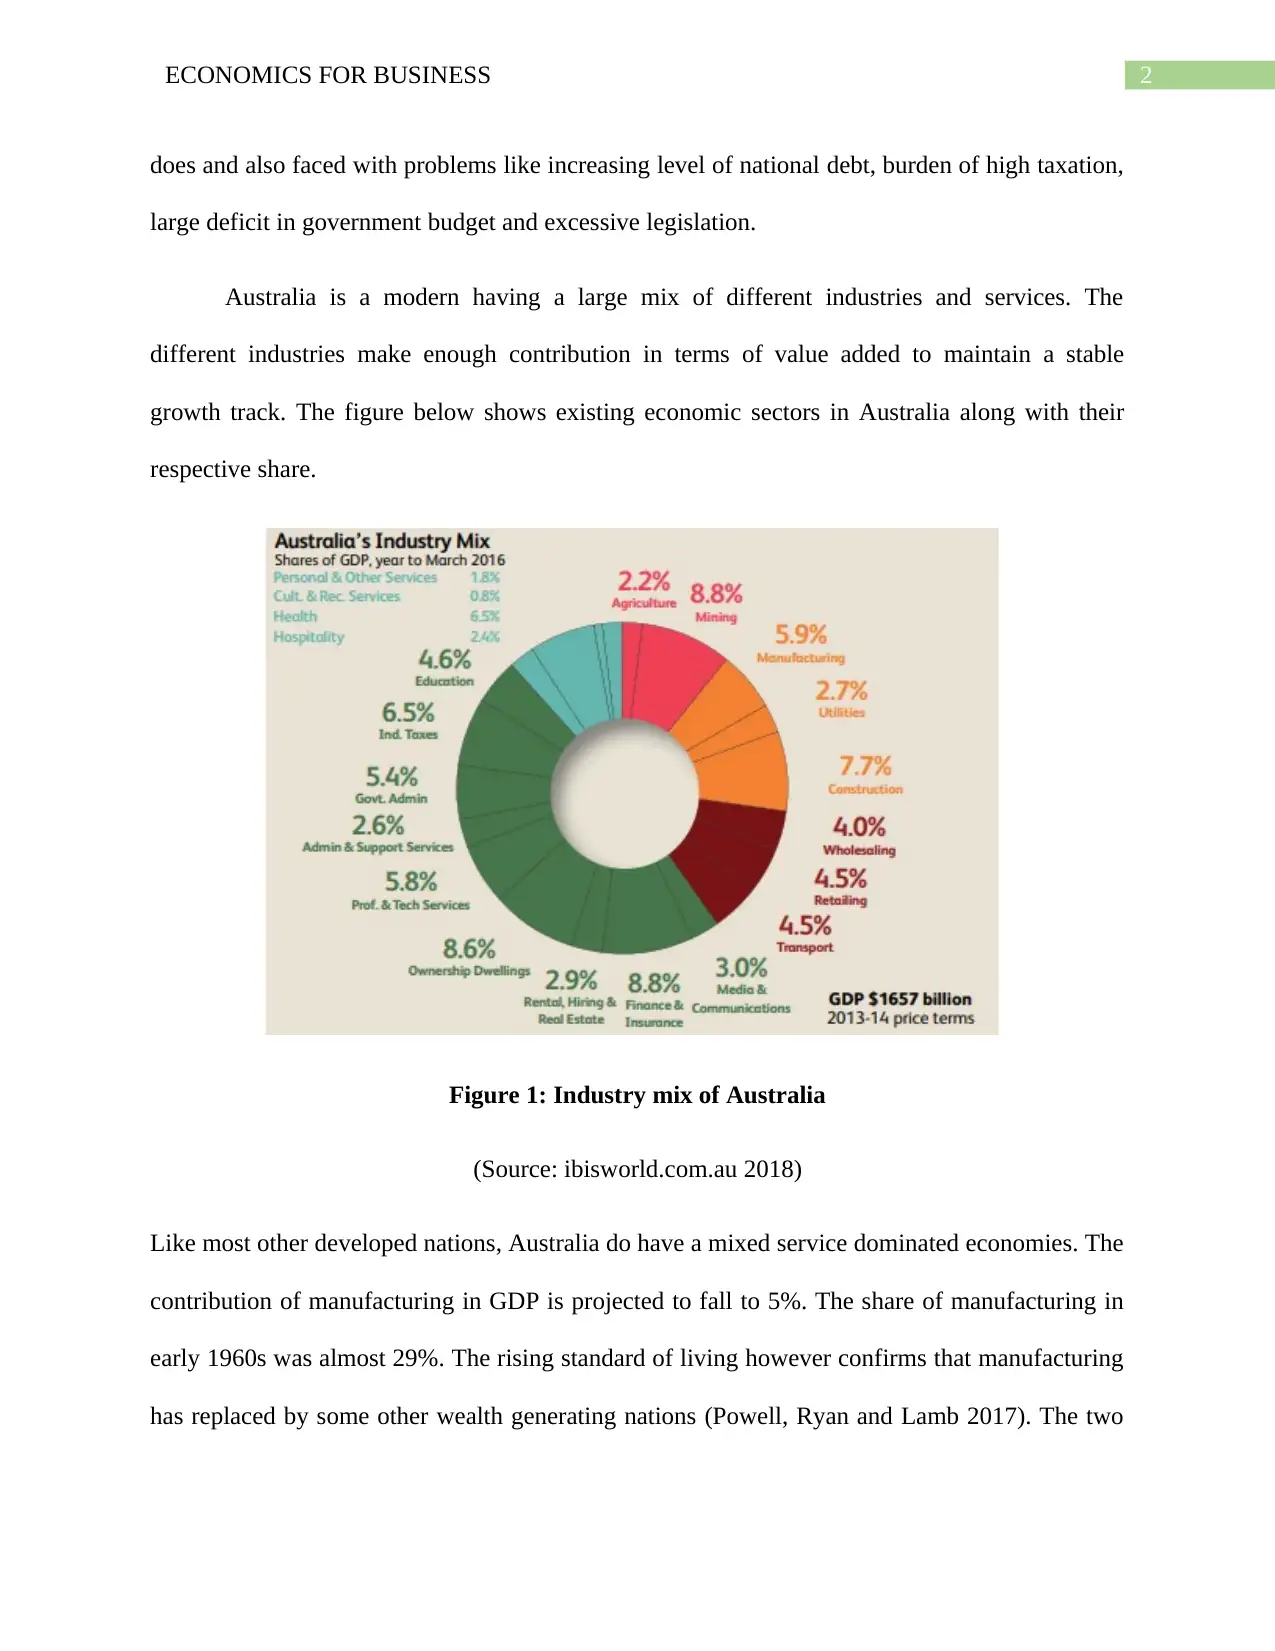
Australia is a modern having a large mix of different industries and services. The
different industries make enough contribution in terms of value added to maintain a stable
growth track. The figure below shows existing economic sectors in Australia along with their
respective share.
Figure 1: Industry mix of Australia
(Source: ibisworld.com.au 2018)
Like most other developed nations, Australia do have a mixed service dominated economies. The
contribution of manufacturing in GDP is projected to fall to 5%. The share of manufacturing in
early 1960s was almost 29%. The rising standard of living however confirms that manufacturing
has replaced by some other wealth generating nations (Powell, Ryan and Lamb 2017). The two
does and also faced with problems like increasing level of national debt, burden of high taxation,
large deficit in government budget and excessive legislation.
Australia is a modern having a large mix of different industries and services. The
different industries make enough contribution in terms of value added to maintain a stable
growth track. The figure below shows existing economic sectors in Australia along with their
respective share.
Figure 1: Industry mix of Australia
(Source: ibisworld.com.au 2018)
Like most other developed nations, Australia do have a mixed service dominated economies. The
contribution of manufacturing in GDP is projected to fall to 5%. The share of manufacturing in
early 1960s was almost 29%. The rising standard of living however confirms that manufacturing
has replaced by some other wealth generating nations (Powell, Ryan and Lamb 2017). The two
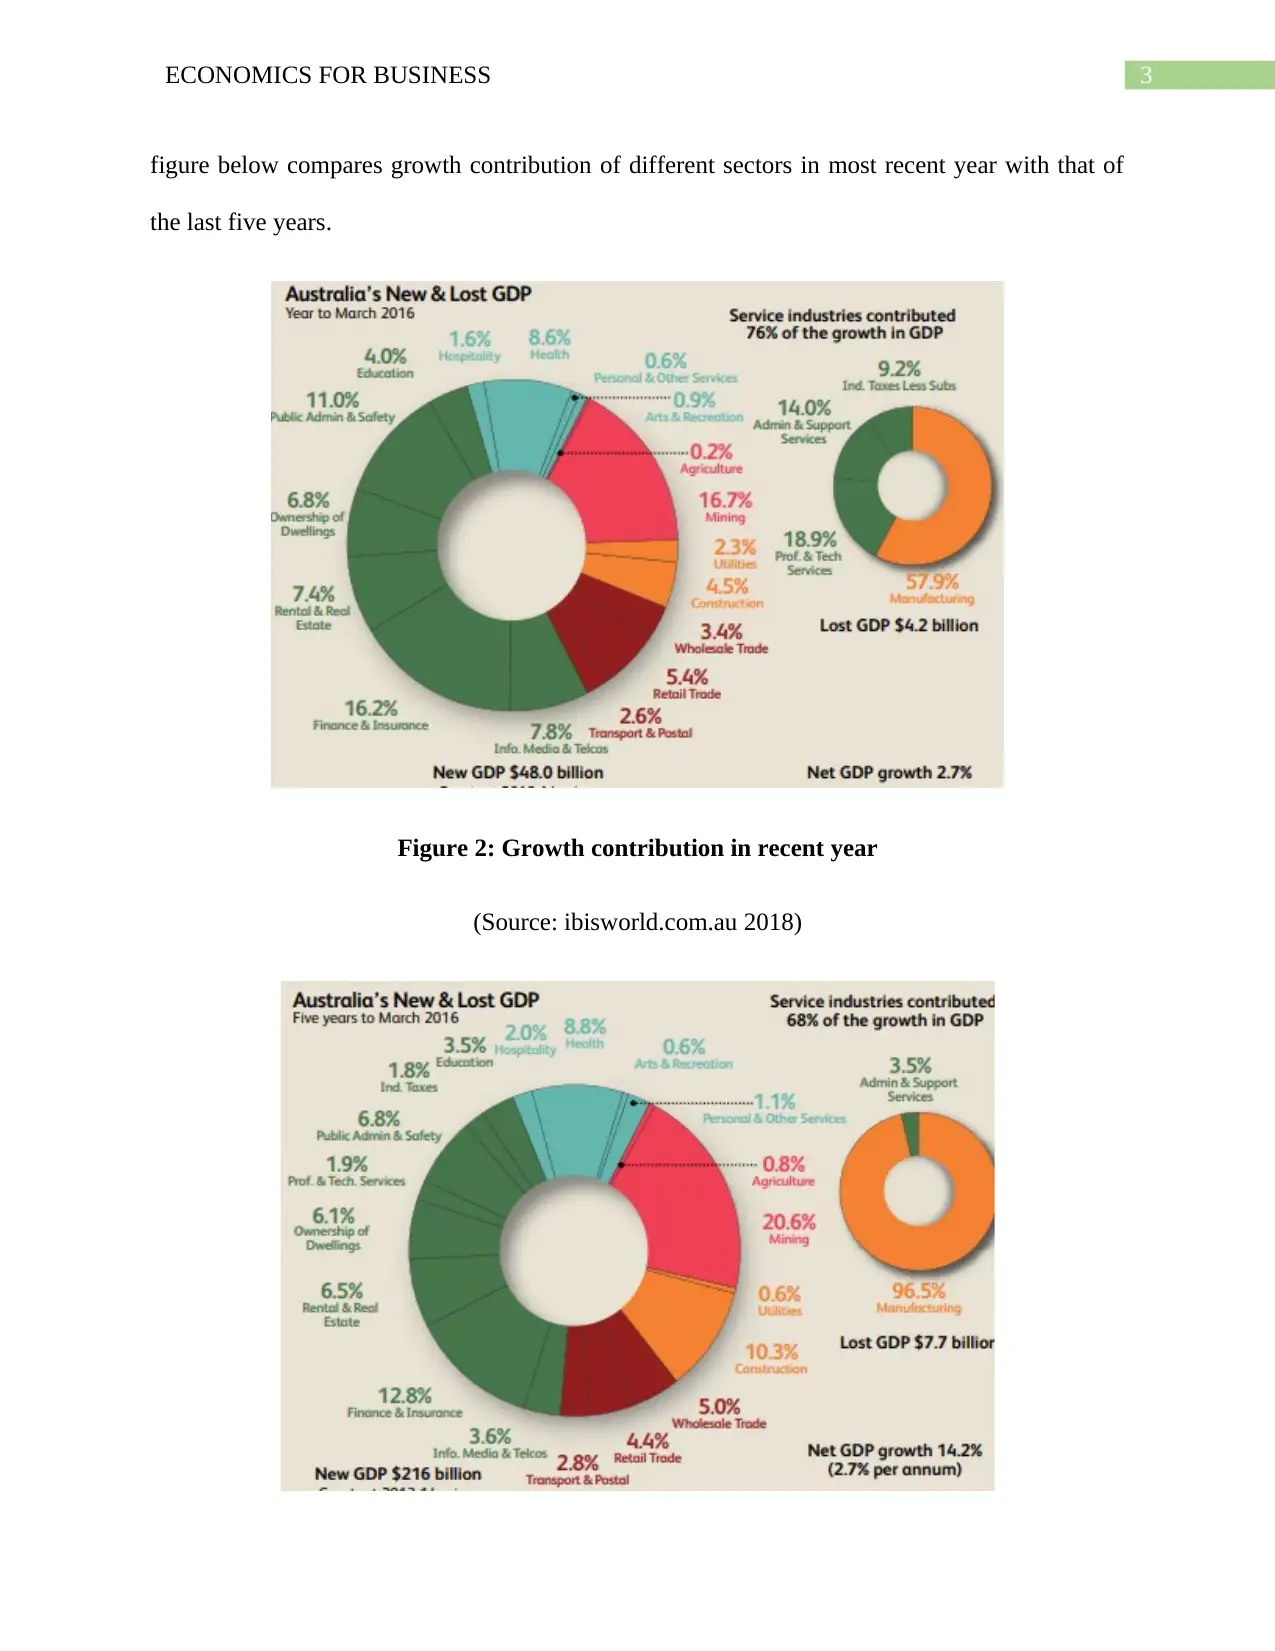
3ECONOMICS FOR BUSINESS
figure below compares growth contribution of different sectors in most recent year with that of
the last five years.
Figure 2: Growth contribution in recent year
(Source: ibisworld.com.au 2018)
figure below compares growth contribution of different sectors in most recent year with that of
the last five years.
Figure 2: Growth contribution in recent year
(Source: ibisworld.com.au 2018)
Secure Best Marks with AI Grader
Need help grading? Try our AI Grader for instant feedback on your assignments.
4ECONOMICS FOR BUSINESS
Figure 3: average sectorial contribution in last five years
(Source: ibisworld.com.au 2018)
The goods producing industries contributing to economic growth include mining and
construction. In the last five years, most losses in output has been realized in manufacturing
sector. Mining though has experienced a drastic fall in prices but volume of output from the
sector continues to grow. In the past five years, more than 70% of GDP was contributed by
different service industries.
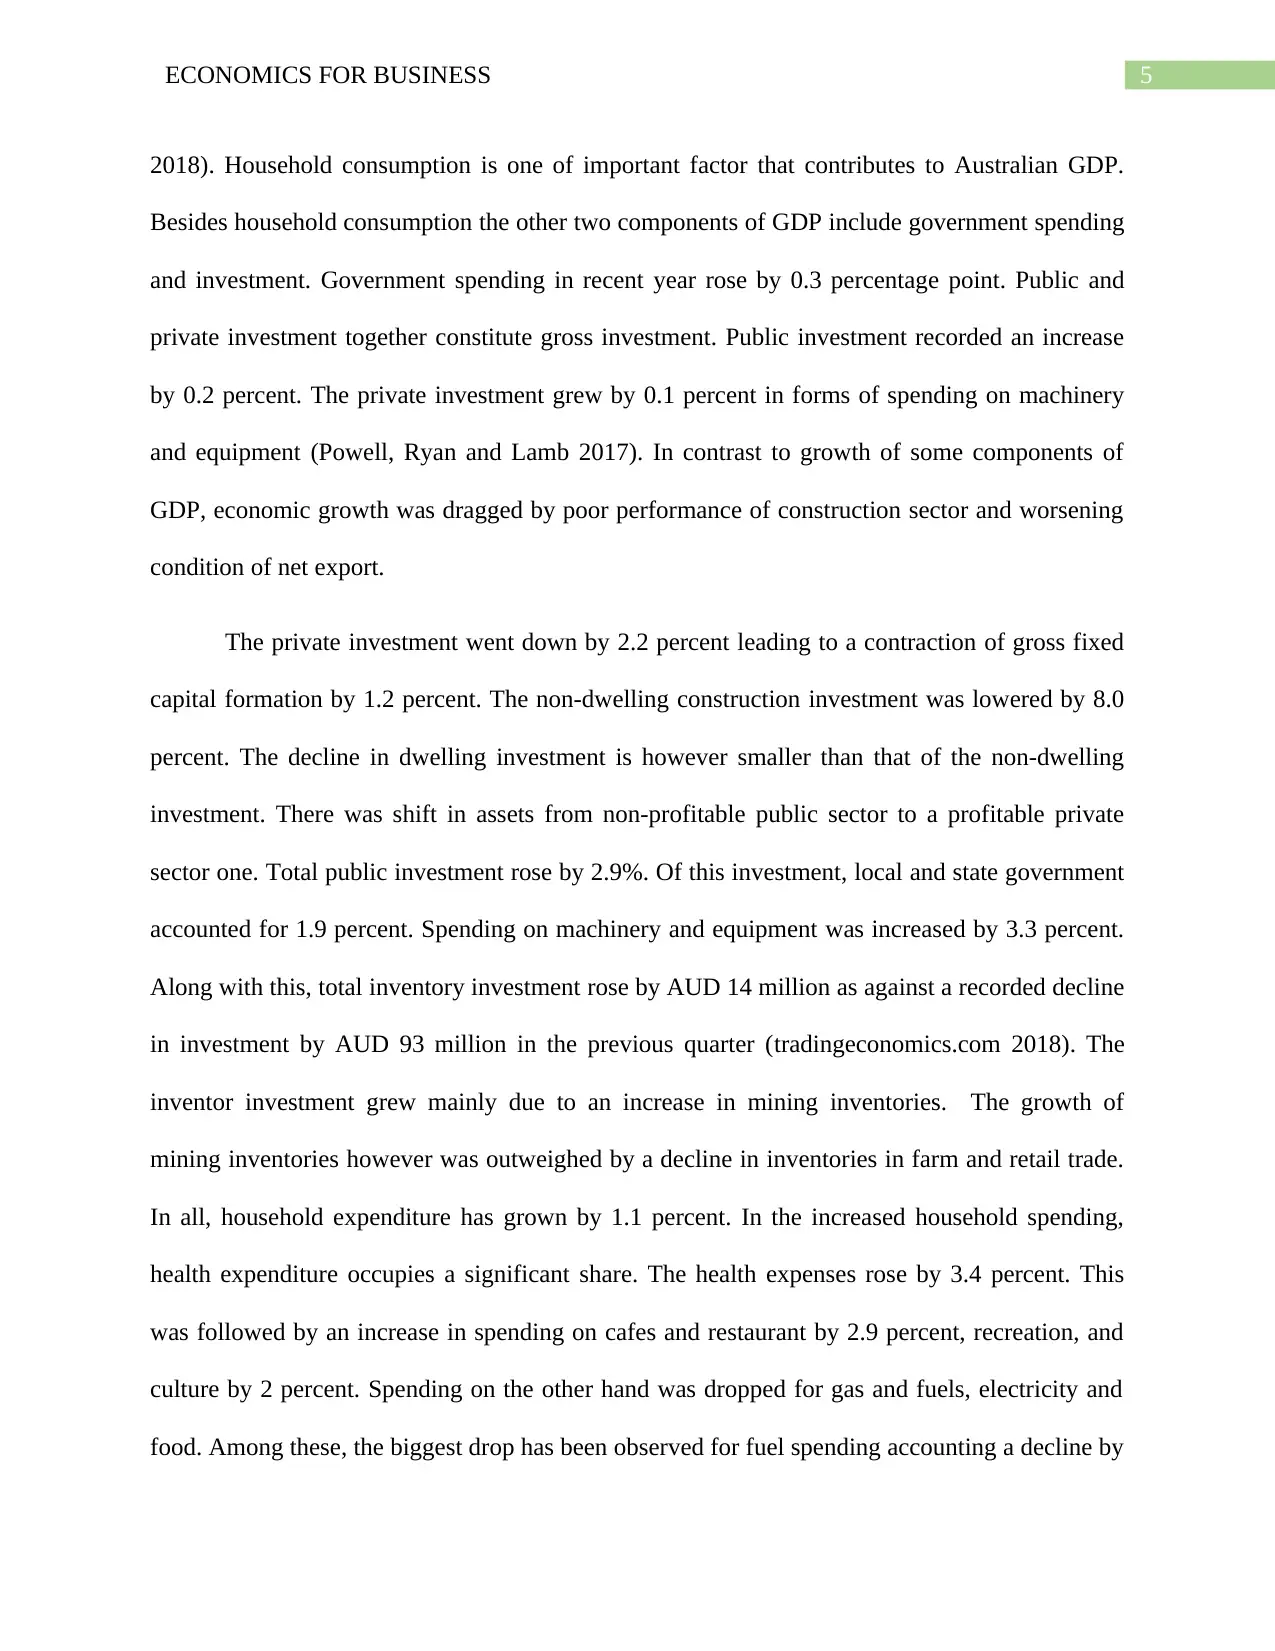
Figure 5: Annual economic growth rate of Australia
(Source: tradingeconomics.com 2018)
The last recorded growth rate of Australia is 2.4%. The growth rate is below the expected growth
rate and that of market consensus rate. The economy has experienced a decline in the growth rate
since third quarter of 2016. Growth however slightly recovered since 2017. The positive outlook
toward consumption spending helps to make an upward revision of growth. Downward pressure
on growth is coming from contraction of construction sectors and a downturn in net export.
Household consumption had recorded a growth rate of 0.6 percentage (tradingeconomics.com
Figure 3: average sectorial contribution in last five years
(Source: ibisworld.com.au 2018)
The goods producing industries contributing to economic growth include mining and
construction. In the last five years, most losses in output has been realized in manufacturing
sector. Mining though has experienced a drastic fall in prices but volume of output from the
sector continues to grow. In the past five years, more than 70% of GDP was contributed by
different service industries.
Figure 5: Annual economic growth rate of Australia
(Source: tradingeconomics.com 2018)
The last recorded growth rate of Australia is 2.4%. The growth rate is below the expected growth
rate and that of market consensus rate. The economy has experienced a decline in the growth rate
since third quarter of 2016. Growth however slightly recovered since 2017. The positive outlook
toward consumption spending helps to make an upward revision of growth. Downward pressure
on growth is coming from contraction of construction sectors and a downturn in net export.
Household consumption had recorded a growth rate of 0.6 percentage (tradingeconomics.com
5ECONOMICS FOR BUSINESS
2018). Household consumption is one of important factor that contributes to Australian GDP.
Besides household consumption the other two components of GDP include government spending
and investment. Government spending in recent year rose by 0.3 percentage point. Public and
private investment together constitute gross investment. Public investment recorded an increase
by 0.2 percent. The private investment grew by 0.1 percent in forms of spending on machinery
and equipment (Powell, Ryan and Lamb 2017). In contrast to growth of some components of
GDP, economic growth was dragged by poor performance of construction sector and worsening
condition of net export.
The private investment went down by 2.2 percent leading to a contraction of gross fixed
capital formation by 1.2 percent. The non-dwelling construction investment was lowered by 8.0
percent. The decline in dwelling investment is however smaller than that of the non-dwelling
investment. There was shift in assets from non-profitable public sector to a profitable private
sector one. Total public investment rose by 2.9%. Of this investment, local and state government
accounted for 1.9 percent. Spending on machinery and equipment was increased by 3.3 percent.
Along with this, total inventory investment rose by AUD 14 million as against a recorded decline
in investment by AUD 93 million in the previous quarter (tradingeconomics.com 2018). The
inventor investment grew mainly due to an increase in mining inventories. The growth of
mining inventories however was outweighed by a decline in inventories in farm and retail trade.
In all, household expenditure has grown by 1.1 percent. In the increased household spending,
health expenditure occupies a significant share. The health expenses rose by 3.4 percent. This
was followed by an increase in spending on cafes and restaurant by 2.9 percent, recreation, and
culture by 2 percent. Spending on the other hand was dropped for gas and fuels, electricity and
food. Among these, the biggest drop has been observed for fuel spending accounting a decline by
6ECONOMICS FOR BUSINESS
3.1 percent as against a 0.7 percent decline in food (tradingeconomics.com 2018). Total
government expenditure has documented an increase by 1.7 percent. The growth in government
spending gas contributed from a growth of national government by 3.1 percent and that of local
and state government by 1.7 percent.
Net export is another important factor that contributes to GDP outlook of a nation. net
export is obtained as value of export less the value of import. In recent years, following an
increase in value of import along with a decline in value of export put a downward pressure on
net export and hence, on GDP growth. Both rural and non-rural export marked a steady decline.
Non-rural export declined by a lesser extent as compared to rural export. As against the fall in
export, import of both consumption and intermediary goods increased with a respective growth
percentage of 4.7 and 4.1. The service export however went down by 2.7 percent. Coming to
sector wise growth, overall mining output rose by 1.3 percent. The small expansion of mining
industry is mainly contributed from coal mining and iron ore mining. The oil and gas extraction
sector was contracted by 1.8 percent. Construction sector expanded only by 0.3 percent.
Construction of building rose by 0.9 percent. In the service industry, telecommunication
accounted a growth rate of 3.5 percent. Financial service though contributed a significant portion
of GDP but in recent years had recorded a slow growth rate with financial and insurance service
grew only by 0.2 percent. The growing attention on private and public health spending,
healthcare and social assistance system advanced by 1.9 percent (Kramer 2016). The primary
sector including fishery, forestry and agriculture contracted by 2.7 percent. The manufacturing
output declined by 1 percent. Following a fall in water supply and associated water services, a
marked declined has been observed in waste and water services. The electricity and gas supply
on contracted by 0.2 percent and 1.1 percent respectively.
Paraphrase This Document
Need a fresh take? Get an instant paraphrase of this document with our AI Paraphraser
7ECONOMICS FOR BUSINESS
Over the past five years, Australia thus has accounted a low to moderate growth rate with
rate of growth moving around 2 to 3 percent. Expansion of public investment and consumption
spending makes some positive contribution to economic growth. This however has more than
offset by tight condition in housing market and a drastic fall in goods export along with an
increase in volume of import. With a persistent decline in real GDP growth rate, output has gone
below the potential output. Australia now accounted a per capita growth rate of only 0.8%. The
figure forbore capita GDP growth is much lower than other developed nations. The potential
threat on the domestic economy include a lower average price of houses, decline in construction
growth, a declining and uncertain growth of consumption spending, decline in mining investment
and a depreciation of Australian dollar. Mining and construction are the two pillar industries of
Australia. The fast growth of China benefitted Australia from an increase in export demand of
mineral used as primary raw materials in different industries of China (Kramer 2016). The recent
slowdown of China’s growth worsens terms of trade for Australia indicating an end of mining
boom. The mining sector is expected to experience a decline in investment by 15% in the next
few years. The fast growth of construction sector had significant contribution in Australia’s
growth. With an unstable condition of housing market, the construction sector has accounted a
contraction. The lower inflation expectation hurt the expected wage growth. Even the relatively
strong Australian dollar failed to revise inflation expectation.
Despite the slow economic growth there is still hope that Australian economy will be
successful in avoiding any recessionary pressure. The declining phase of mining investment has
reached close to its end. Five years ago, mining investment in Australia accelerated to almost 7%
of GDP and then has started falling. The investment has declined at a rate of 1.5 percent per
8ECONOMICS FOR BUSINESS
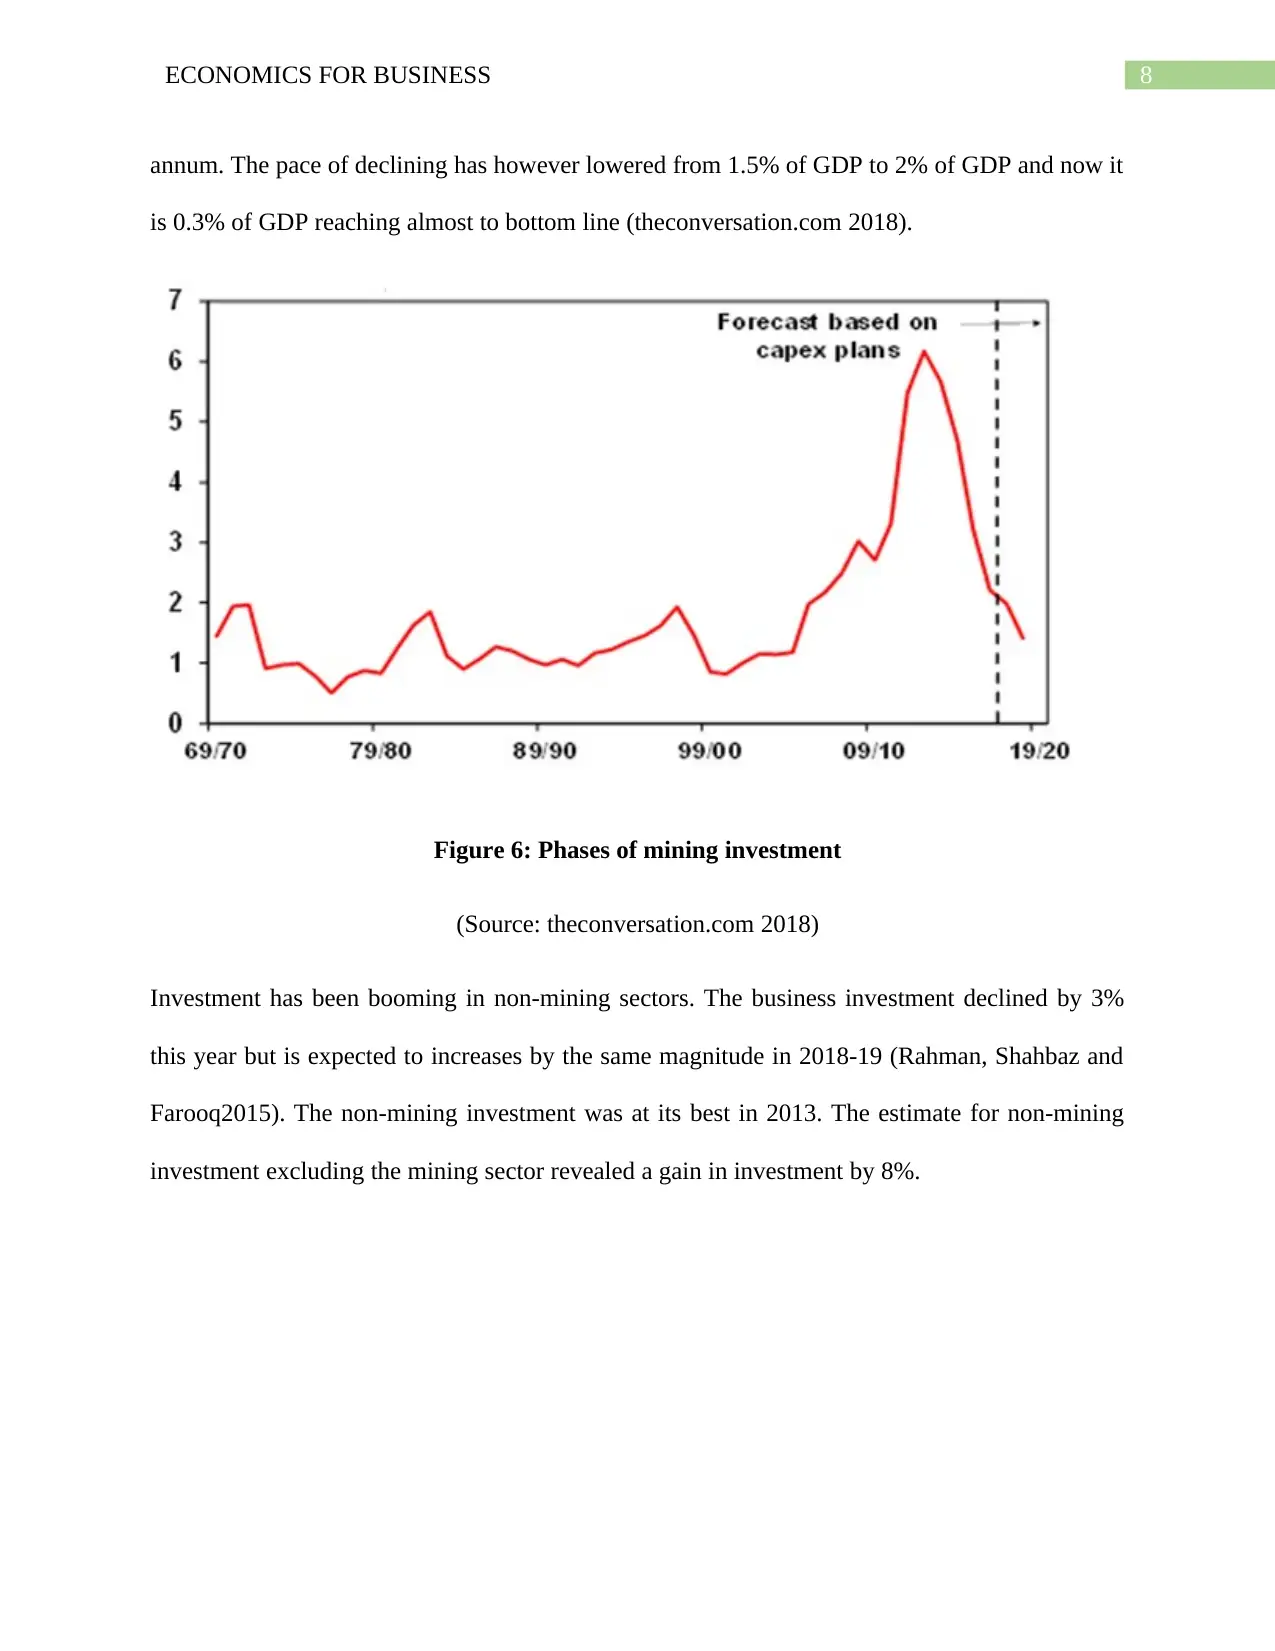
annum. The pace of declining has however lowered from 1.5% of GDP to 2% of GDP and now it
is 0.3% of GDP reaching almost to bottom line (theconversation.com 2018).
Figure 6: Phases of mining investment
(Source: theconversation.com 2018)
Investment has been booming in non-mining sectors. The business investment declined by 3%
this year but is expected to increases by the same magnitude in 2018-19 (Rahman, Shahbaz and
Farooq2015). The non-mining investment was at its best in 2013. The estimate for non-mining
investment excluding the mining sector revealed a gain in investment by 8%.
9ECONOMICS FOR BUSINESS
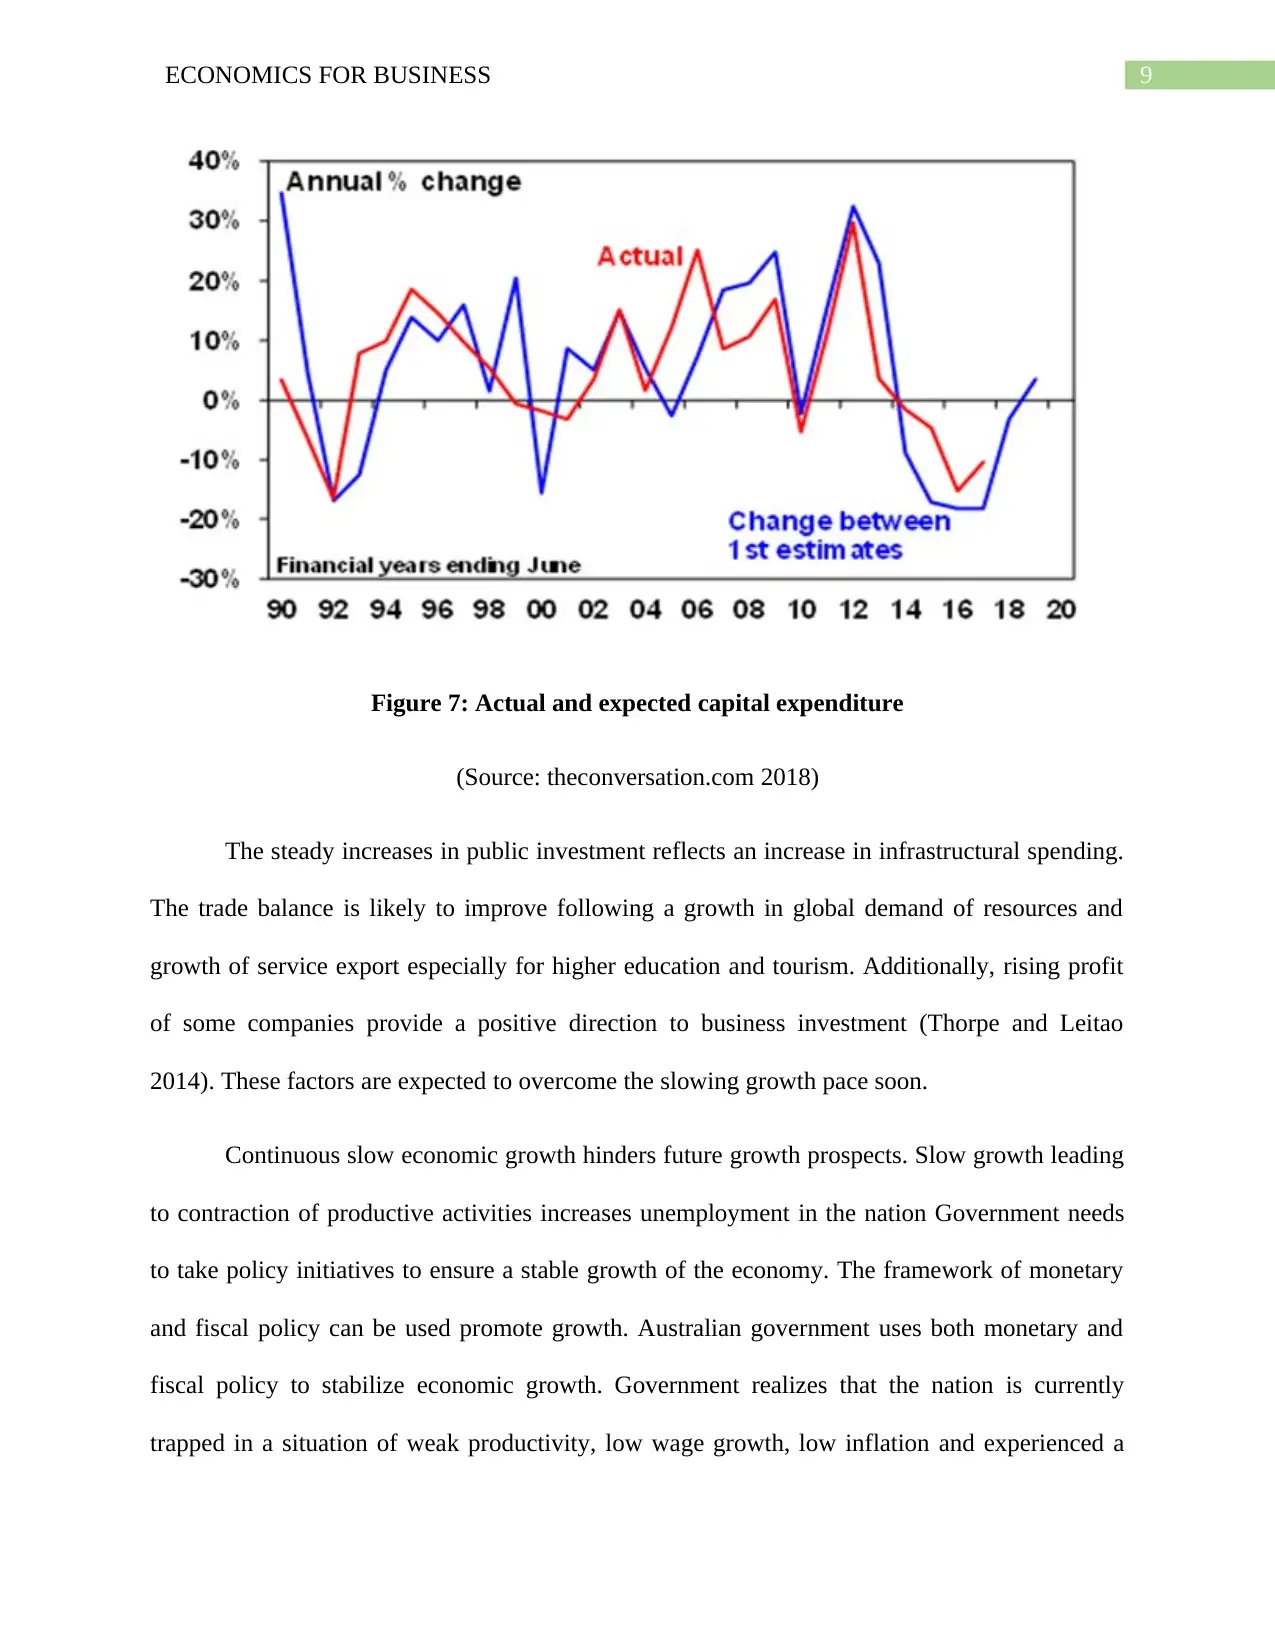
Figure 7: Actual and expected capital expenditure
(Source: theconversation.com 2018)
The steady increases in public investment reflects an increase in infrastructural spending.
The trade balance is likely to improve following a growth in global demand of resources and
growth of service export especially for higher education and tourism. Additionally, rising profit
of some companies provide a positive direction to business investment (Thorpe and Leitao
2014). These factors are expected to overcome the slowing growth pace soon.
Continuous slow economic growth hinders future growth prospects. Slow growth leading
to contraction of productive activities increases unemployment in the nation Government needs
to take policy initiatives to ensure a stable growth of the economy. The framework of monetary
and fiscal policy can be used promote growth. Australian government uses both monetary and
fiscal policy to stabilize economic growth. Government realizes that the nation is currently
trapped in a situation of weak productivity, low wage growth, low inflation and experienced a
Secure Best Marks with AI Grader
Need help grading? Try our AI Grader for instant feedback on your assignments.
10ECONOMICS FOR BUSINESS
lower than expected growth rate. The Reserve Bank of Australia designs and executes monetary
policy. Using the instrument of interest rate policymakers maintain the internal balance of
economy with a low inflation and low unemployment. The RBA kept a hard interest rate after
global financial crisis of 2008 and put back the interest rate to the previous level once the
recessionary shock overs. In response to weak mining driven growth, RBA began to cut the cash
rate reaching to a historically low level of 2.5 percent in 2013. In 2015 again, RBA cut its cash
rate and this time cash rate reached to a level as low as 1.5 percent. In the past few years, cash
rate thus recorded a total fall of 3.75 percent since November 2011. Despite easing monetary
policy, the economy continued to record a below trend growth rate. This reflects the
ineffectiveness of monetary policy easing to restore economic growth. An alternative policy
measure is to use the instrument of fiscal policy (Mankiw 2014). Government has designed a
medium term fiscal strategy to maintain a surplus in budget along the objective of economic
growth. Fiscal policy tools works using tools of government spending and taxes. In order to
increase productivity government has raise its spending on human capital. To strengthen the
human capital base government has raised its spending on education (theconversation.com
2018). To maintain a budget surplus government has increase the tax rate that has detrimental
effect on productivity. However, while implementing taxes government should shift the tax
burden the areas that are less directly related to productivity. Additionally, government needs to
raise spending on innovation and advanced technology to enhance productivity.
The essay summarizes Australian growth history in the last five years. The Australian
economy is well-known for maintaining a steady growth rate over a long period. Recently, the
economic growth in Austral has slowed down with a decline in investment in dwelling and non-
dwelling housing and mining. The worsening terms of trade following a depreciation of
11ECONOMICS FOR BUSINESS
Australian dollar and decline demand exported goods dragged the economy’s growth rate.
Despite period of slow growth, the economy is expected to avoid future recessionary pressure.
Slowing mining investment has almost come to its last stage. Investment in non-mining sector on
the other hand is increasing making a positive contribution to growth. The public investment has
increased improving the infrastructure of the economy. Government uses monetary and fiscal
instrument to revive economic growth. The policy of monetary easing however is unable to
bring back the economic growth to its earlier level. Under fiscal policy measures government
raise its spending in different areas to improve productivity. More measures however needs to be
taken the ensure a moderate and stable growth in future.
12ECONOMICS FOR BUSINESS
References
Australia GDP Growth Rate | 1959-2018 | Data | Chart | Calendar | Forecast. (2018). Retrieved
from https://tradingeconomics.com/australia/gdp-growth
Kramer, T., 2016. Economic issues arising from the mining boom. Ecodate, 30(4), p.3.
Mankiw, N.G., 2014. Principles of macroeconomics. Cengage Learning.
Powell, R., Ryan, M. and Lamb, S., 2017. The impact of the mining boom on the dining industry
in Western Australia. Australasian Journal of Regional Studies, 23(2), p.243.
Rahman, M.M., Shahbaz, M. and Farooq, A., 2015. Financial development, international trade,
and economic growth in Australia: new evidence from multivariate framework analysis. Journal
of Asia-Pacific Business, 16(1), pp.21-43.
Ruthven, P. (2018). Australia’s Growth Industries : Media Centre. Retrieved from
https://www.ibisworld.com.au/media/2016/08/10/australias-growth-industries/
The Conversation. (2018). Does government spending on education promote economic growth?.
[online] Available at: https://theconversation.com/does-government-spending-on-education-
promote-economic-growth-60229 [Accessed 18 May 2018].
Thorpe, M. and Leitão, N.C., 2014. Economic growth in Australia: Globalisation, trade and
foreign direct investment. Global Business and Economics Review, 16(1), pp.75-86.
Paraphrase This Document
Need a fresh take? Get an instant paraphrase of this document with our AI Paraphraser

13ECONOMICS FOR BUSINESS
1 out of 14
Related Documents


Your All-in-One AI-Powered Toolkit for Academic Success.
+13062052269
info@desklib.com
Available 24*7 on WhatsApp / Email
![[object Object]](/_next/static/media/star-bottom.7253800d.svg)
Unlock your academic potential
© 2024 | Zucol Services PVT LTD | All rights reserved.