ASSIGNMENT ON ECONOMICS FOR DECISION MAKING.
VerifiedAdded on 2022/09/14
|9
|1375
|13
Assignment
AI Summary
Contribute Materials
Your contribution can guide someone’s learning journey. Share your
documents today.
Running head: ECONOMICS FOR DECISION MAKING
Economics for Decision Making
Name of the Student
Name of the University
Course ID
Economics for Decision Making
Name of the Student
Name of the University
Course ID
Secure Best Marks with AI Grader
Need help grading? Try our AI Grader for instant feedback on your assignments.
1ECONOMICS FOR DECISION MAKING
Table of Contents
Question 1........................................................................................................................................2
Question a....................................................................................................................................2
Question b....................................................................................................................................2
Question c....................................................................................................................................3
Question 2........................................................................................................................................4
Question a....................................................................................................................................4
Question b....................................................................................................................................5
Question 3........................................................................................................................................5
Question a....................................................................................................................................5
Question b....................................................................................................................................6
References........................................................................................................................................8
2ECONOMICS FOR DECISION MAKING
Question 1
Question a
Gross Domestic Product is the sum of values of all goods and services that a nation
produces in a given accounting year. GDP determines values of goods or services in terms of
their market value. Since, product or services included in the GDP are assess at their market
value, for an activity to be counted in GDP, it must be marketed. Without any monetary
transaction taking place activities do not count under GDP (Heijdra 2017). When someone is
paid for mowing lawn there occurs a monetary transaction where the mowing service is
exchanged for money and therefore it is a part of GDP. However, if the housemate does the same
at free of cost then the service though is done but not counted in GDP since no monetary
transaction takes places. Since service done by housemate for free is not marketed, this is not
included in the GDP.
Similar is the case for cooking in home and that in restaurant. In case some is working in
a restaurant as a cook and get paid for cooking service then it is included in GDP. However, if
the same is done for the family members without any monetary payment, then it is not included
in GDP.
Question b
i)
Classica’s consumption in 2012 includes total purchase made on new goods and services
in the year both by domestic and foreigners. Therefore, Classica’s consumption in 2012 is
Consumption=$ 1 billion
3ECONOMICS FOR DECISION MAKING
¿ 1000 million
ii)
Classica’ s investment in 2012 only include sell of new housing stock.
Investment=$ 100 million
iii)
GDP is sum of values of all the produced goods and services. GDP of Classica therefore
is
GDP=Consumption+Investment +Government expenditure+ Net export
¿ ( $ 1000+$ 100+ $ 200+ $ 50 ) million
¿ $ 1350 million
Question c
The UN human development report defines human development as a summary measure
people’s achievement in various dimension of development such as a healthy and longer live,
better knowledge and achievement of a decent standard of living. An index for measure standard
of living within the nation the Gross National Income (GNI) per capita. GNI of a nation is again
is again obtained by dividing national income by population. Therefore, in order to determine
living standard information on both national income and population size is required
(Hdr.undp.org. 2020). Country with high GDP but also with large size of population have a
smaller per capita GDP. On the other hand, country with smaller GDO with small population
size have a large per capita GDP and therefore a better living standard (Uribe and Schmitt-Grohe
2017). In the above statement information is given only on real GDP of China and Belgium.
Secure Best Marks with AI Grader
Need help grading? Try our AI Grader for instant feedback on your assignments.
4ECONOMICS FOR DECISION MAKING
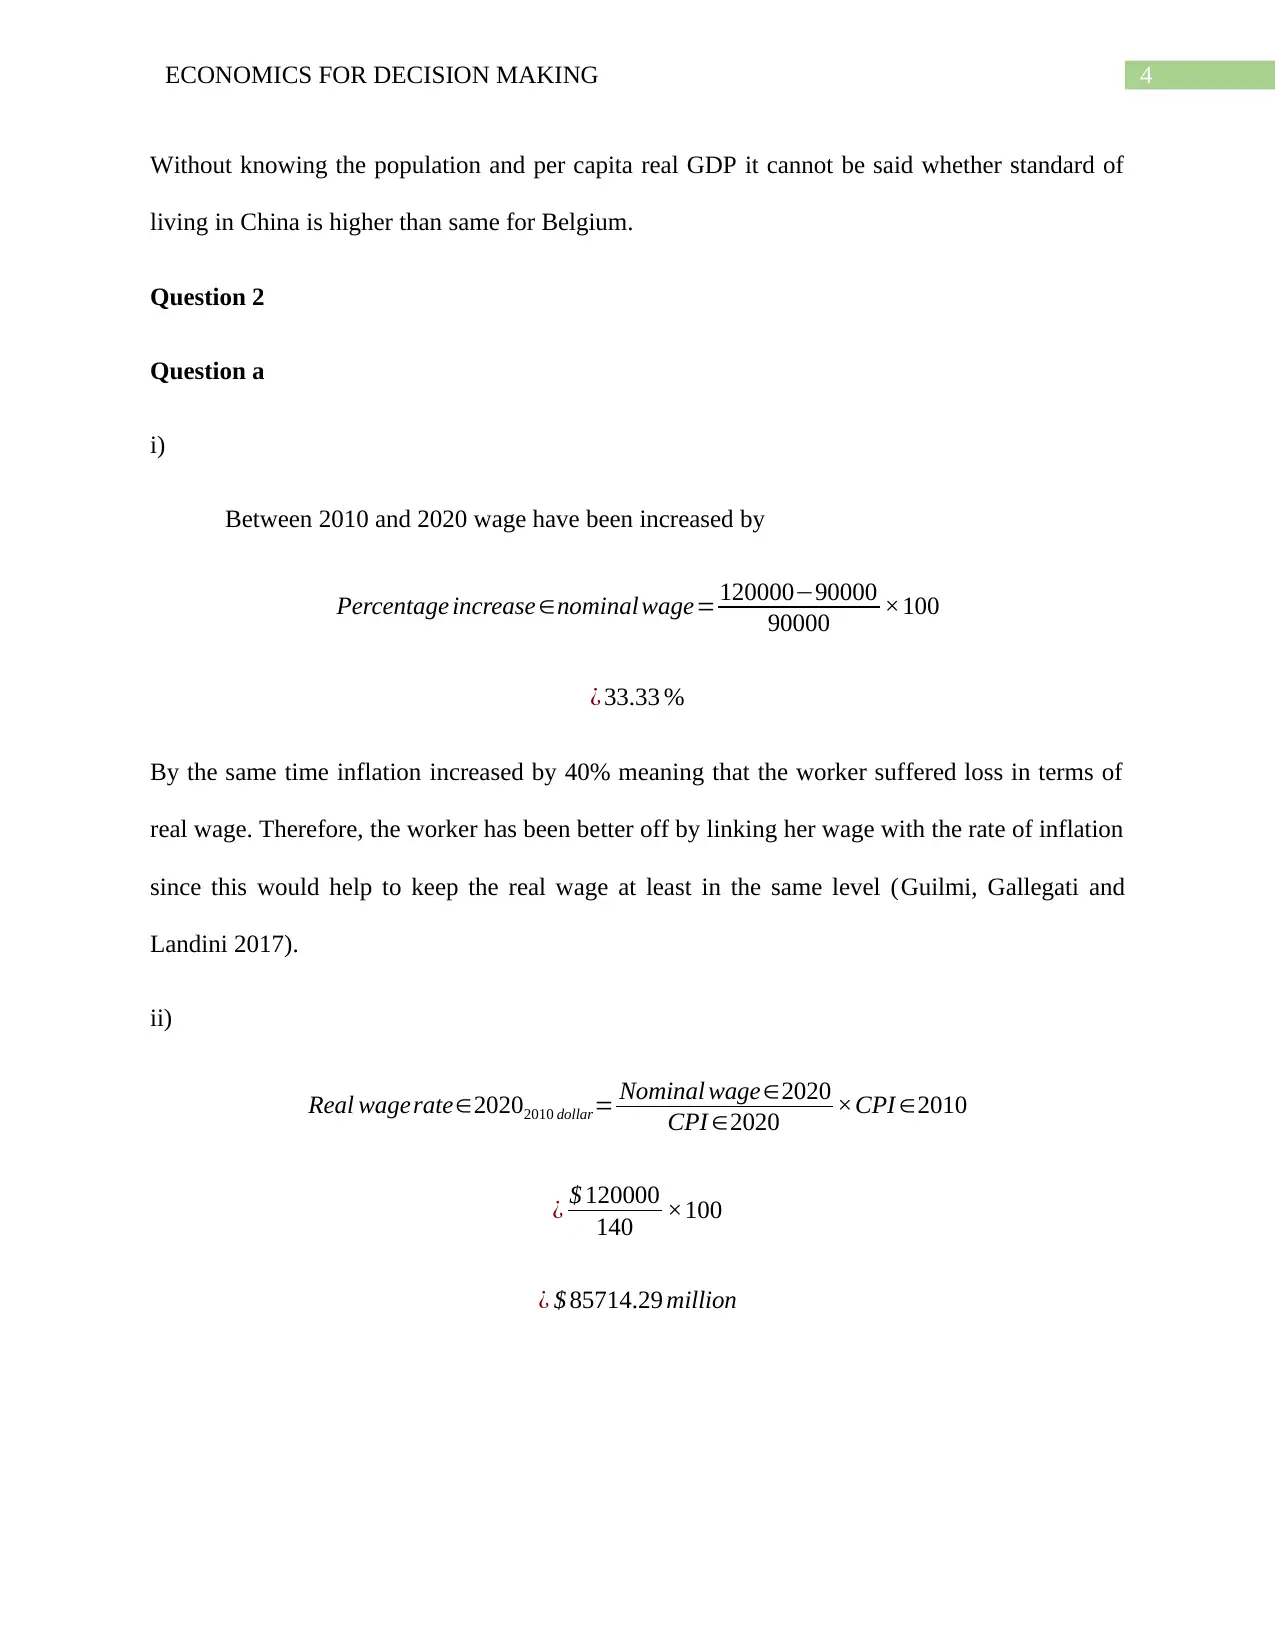
Without knowing the population and per capita real GDP it cannot be said whether standard of
living in China is higher than same for Belgium.
Question 2
Question a
i)
Between 2010 and 2020 wage have been increased by
Percentage increase∈nominal wage= 120000−90000
90000 ×100
¿ 33.33 %
By the same time inflation increased by 40% meaning that the worker suffered loss in terms of
real wage. Therefore, the worker has been better off by linking her wage with the rate of inflation
since this would help to keep the real wage at least in the same level (Guilmi, Gallegati and
Landini 2017).
ii)
Real wagerate∈20202010 dollar= Nominal wage∈2020
CPI ∈2020 ×CPI ∈2010
¿ $ 120000
140 ×100
¿ $ 85714.29 million
5ECONOMICS FOR DECISION MAKING
iii)
One possible reason for choosing not to link her wage to the inflation is that the worker
may expect inflation to be increased by a smaller percentage than nominal wage.
Question b
Bank being a common lender for public concerns more about real interest rate since this
determines the actual return that banks receive from lending money. Real interest rate is the
difference between nominal interest rate and inflation rate. Now, if inflation rate increases then
real interest rate falls meaning banks get a money that is valued less in real terms than that was
originally lent. Reverse is the case for a decrease in inflation rate (Ehnts 2016). If inflation rate
falls, then banks get money which is valued more in real terms compared to that was originally
lent. If inflation is likely to increase, then banks are more likely to react by increasing nominal
interest rate. This is because if inflation rate is likely to increase, then central bank is expected to
increase the overnight rate which then increases borrowing cost of the banks. In order to recover
the borrowing costs banks then increase the nominal interest rate (Gandolfo 2016). Also since
the expected increase in inflation rate is likely to decrease actual return of banks they have a
tendency to increase the nominal interest rate to keep actual return same.
Question 3
Question a
6ECONOMICS FOR DECISION MAKING
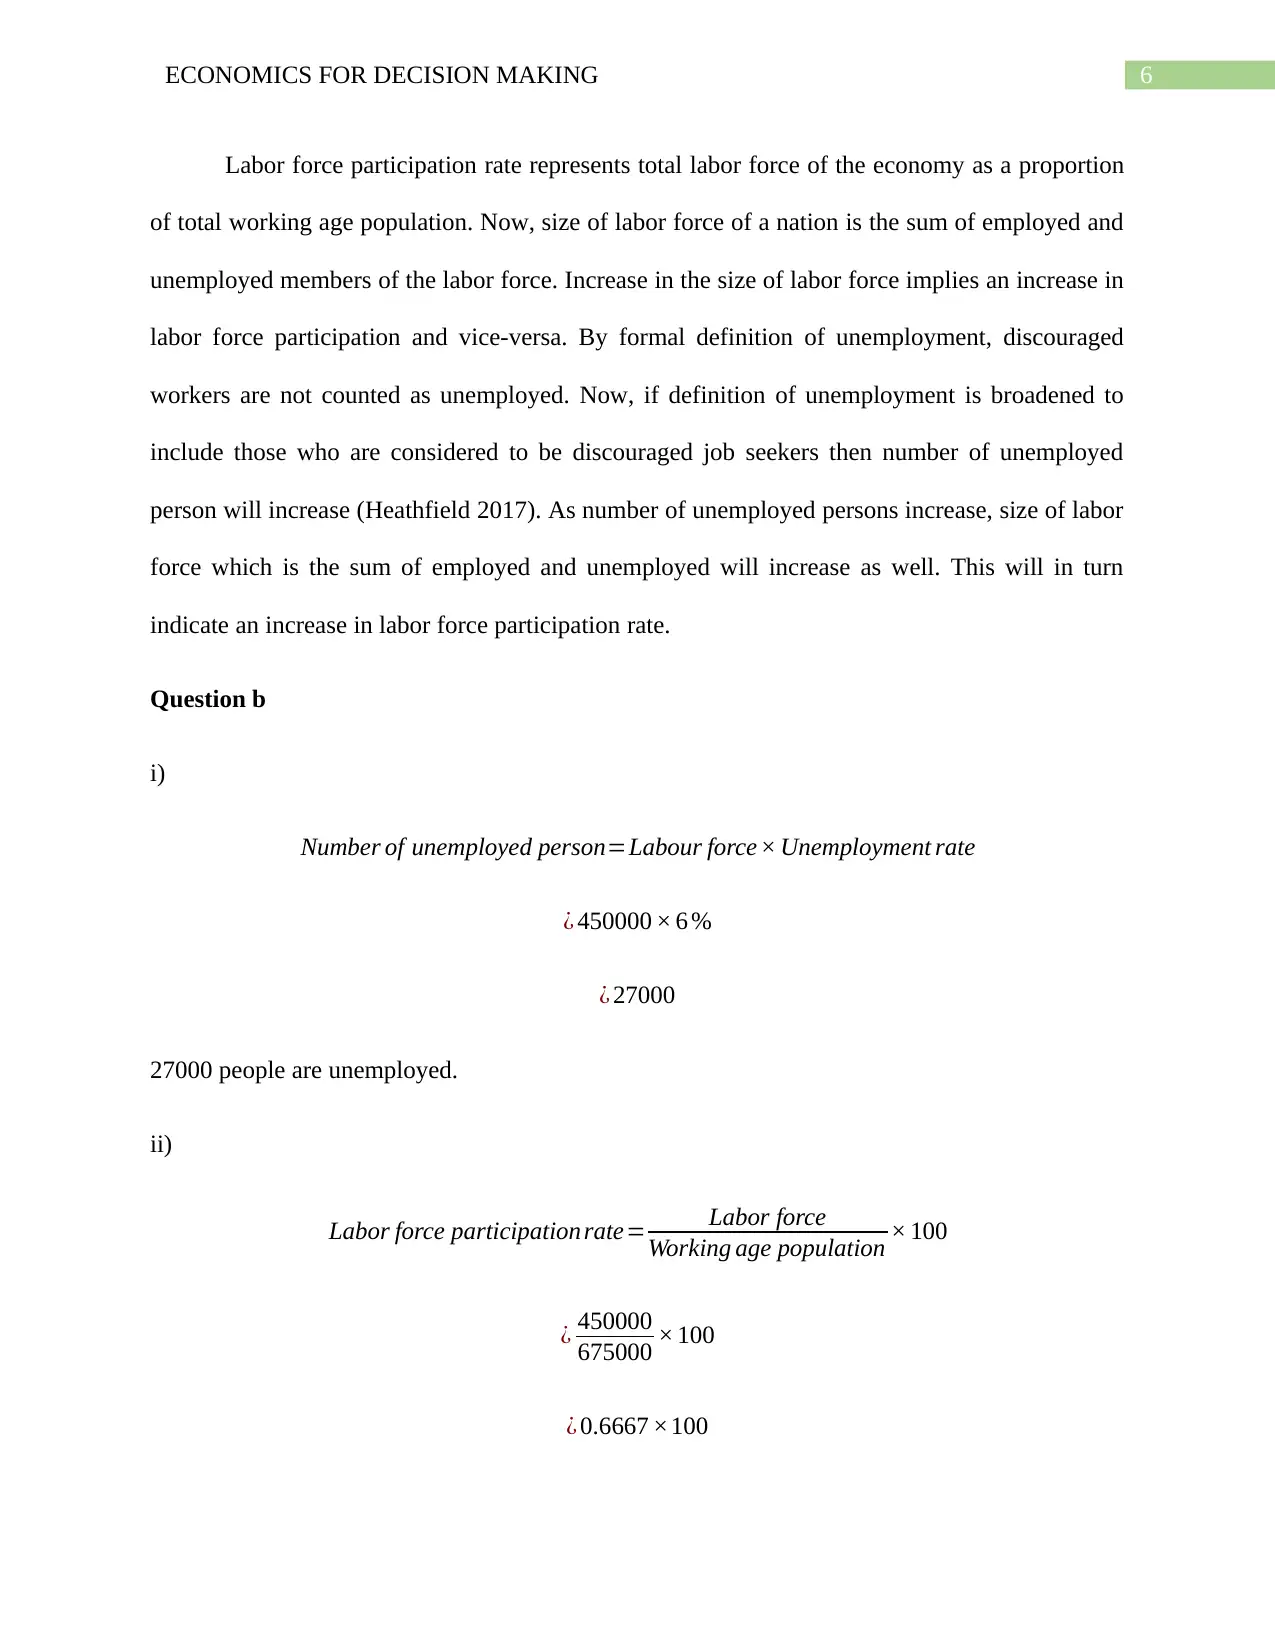
Labor force participation rate represents total labor force of the economy as a proportion
of total working age population. Now, size of labor force of a nation is the sum of employed and
unemployed members of the labor force. Increase in the size of labor force implies an increase in
labor force participation and vice-versa. By formal definition of unemployment, discouraged
workers are not counted as unemployed. Now, if definition of unemployment is broadened to
include those who are considered to be discouraged job seekers then number of unemployed
person will increase (Heathfield 2017). As number of unemployed persons increase, size of labor
force which is the sum of employed and unemployed will increase as well. This will in turn
indicate an increase in labor force participation rate.
Question b
i)
Number of unemployed person=Labour force × Unemployment rate
¿ 450000 × 6 %
¿ 27000
27000 people are unemployed.
ii)
Labor force participation rate= Labor force
Working age population × 100
¿ 450000
675000 × 100
¿ 0.6667 ×100
Paraphrase This Document
Need a fresh take? Get an instant paraphrase of this document with our AI Paraphraser
7ECONOMICS FOR DECISION MAKING
¿ 66. 67 %
iii)
It is given that in the past 8 months, Jamilah was first downgraded from full time to part
time hours and lately found herself unemployed. Jamilah despite being an efficient employee
become unemployed. This indicates the employment condition in the economy is deviating from
the full employment condition. This happens when actual output is less than potential output.
Since this is continuing for more than six months, this can be termed as a recessionary gap (De
Vroe 2016). That is Australia now is experiencing a recessionary gap. Full employment refers to
a situation where the nation fully utilizes all the available labor resources. This is associated with
potential level of output and known as natural rate of unemployment. Actual unemployment in
contrast is the rate of unemployment that the economy actually experiences. The current scenario
indicates actual unemployment to be greater than full employment.
8ECONOMICS FOR DECISION MAKING
References
De Vroey, M., 2016. A history of macroeconomics from Keynes to Lucas and beyond.
Cambridge University Press.
Ehnts, D.H., 2016. Modern monetary theory and European macroeconomics. Taylor & Francis.
Gandolfo, G., 2016. International Finance and International Macroeconomics: An Overview.
In International Finance and Open-Economy Macroeconomics (pp. 3-9). Springer, Berlin,
Heidelberg.
Guilmi, C.D., Gallegati, M. and Landini, S., 2017. Interactive Macroeconomics. Cambridge
Books.
Hdr.undp.org. 2020. Human Development Index (HDI) | Human Development Reports. [online]
Available at: http://hdr.undp.org/en/content/human-development-index-hdi [Accessed 9 Apr.
2020].
Heathfield, D.F. ed., 2015. Topics in applied macroeconomics. Macmillan International Higher
Education.
Heijdra, B.J., 2017. Foundations of modern macroeconomics. Oxford university press.
Uribe, M., and Schmitt-Grohe, S., 2017. Open economy macroeconomics. Princeton University
Press.
1 out of 9
Related Documents


Your All-in-One AI-Powered Toolkit for Academic Success.
+13062052269
info@desklib.com
Available 24*7 on WhatsApp / Email
![[object Object]](/_next/static/media/star-bottom.7253800d.svg)
Unlock your academic potential
© 2024 | Zucol Services PVT LTD | All rights reserved.