Economics for Managers (ECO 511) - Homework 2: Demand and Elasticity
VerifiedAdded on 2023/05/29
|7
|1036
|98
Homework Assignment
AI Summary
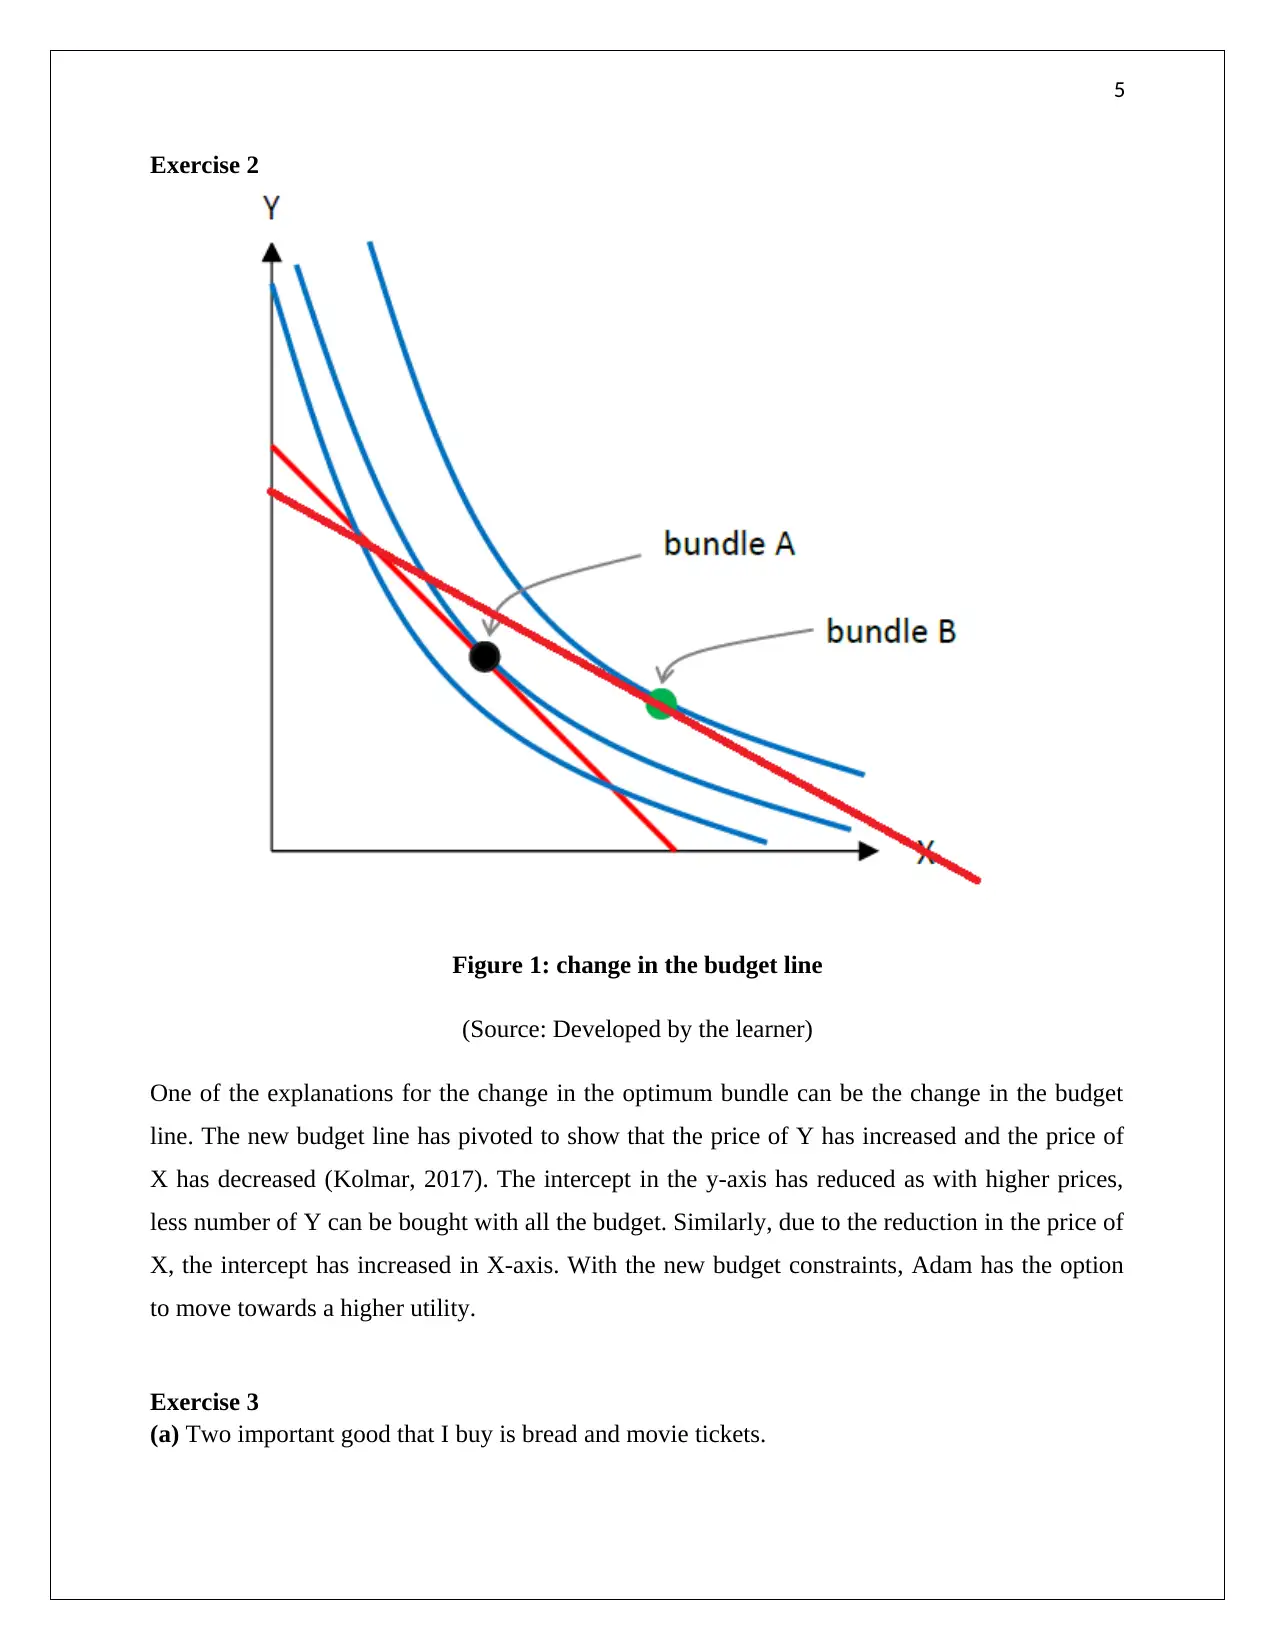
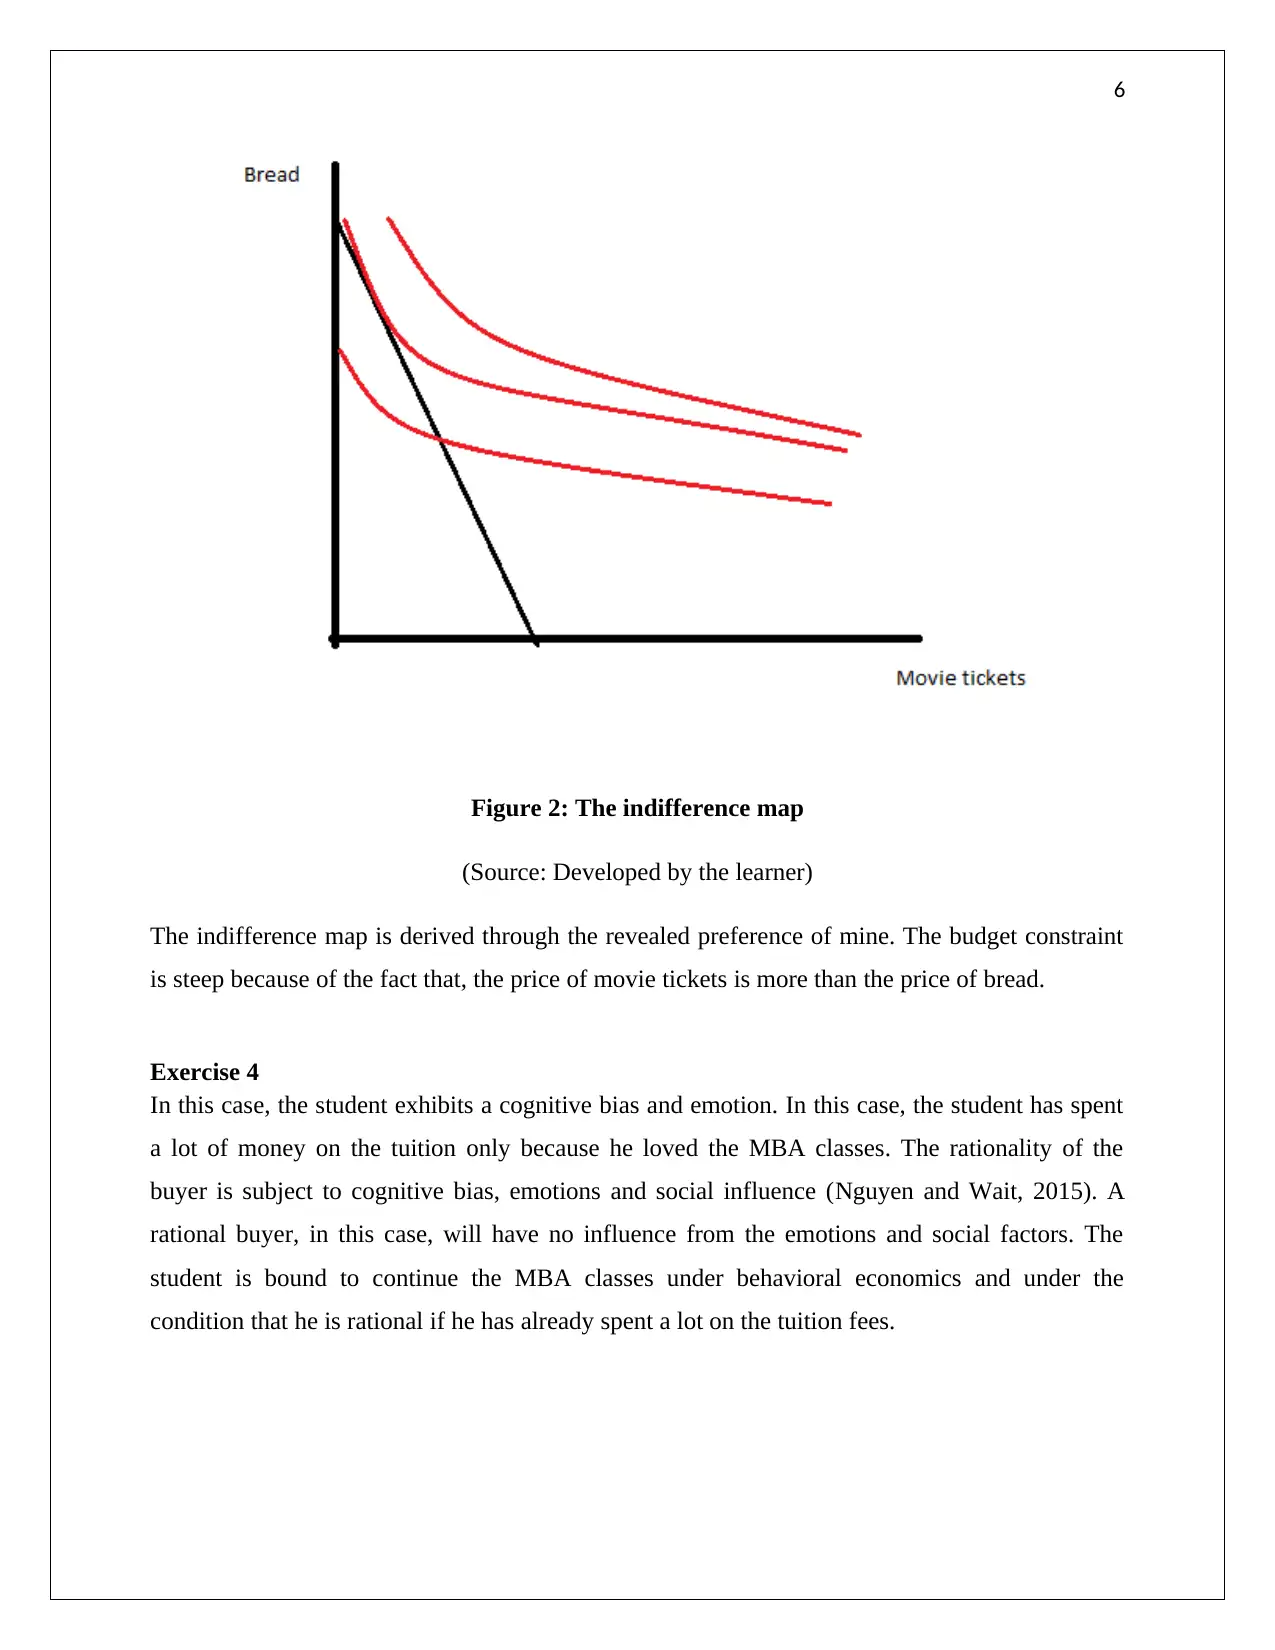
This economics assignment, designed for a "Economics for Managers" course, analyzes the concept of demand elasticity using gasoline as a case study. It explores the differences between short-run and long-run demand, explaining how elasticity impacts seller revenue. The assignment also delves into consumer behavior, examining budget lines, indifference curves, and cognitive biases. The student provides graphical representations of the budget line and indifference map, illustrating consumer preferences and constraints. Finally, the assignment discusses a scenario involving cognitive bias in decision-making. The solution demonstrates a comprehensive understanding of microeconomic principles, including supply and demand, consumer choice, and behavioral economics.
1 out of 7
Related Documents


Your All-in-One AI-Powered Toolkit for Academic Success.
+13062052269
info@desklib.com
Available 24*7 on WhatsApp / Email
![[object Object]](/_next/static/media/star-bottom.7253800d.svg)
Copyright © 2020–2026 A2Z Services. All Rights Reserved. Developed and managed by ZUCOL.