Variations in Temperature over Time

Verified

Added on  2023/04/21

|7
|827
|73
AI Summary
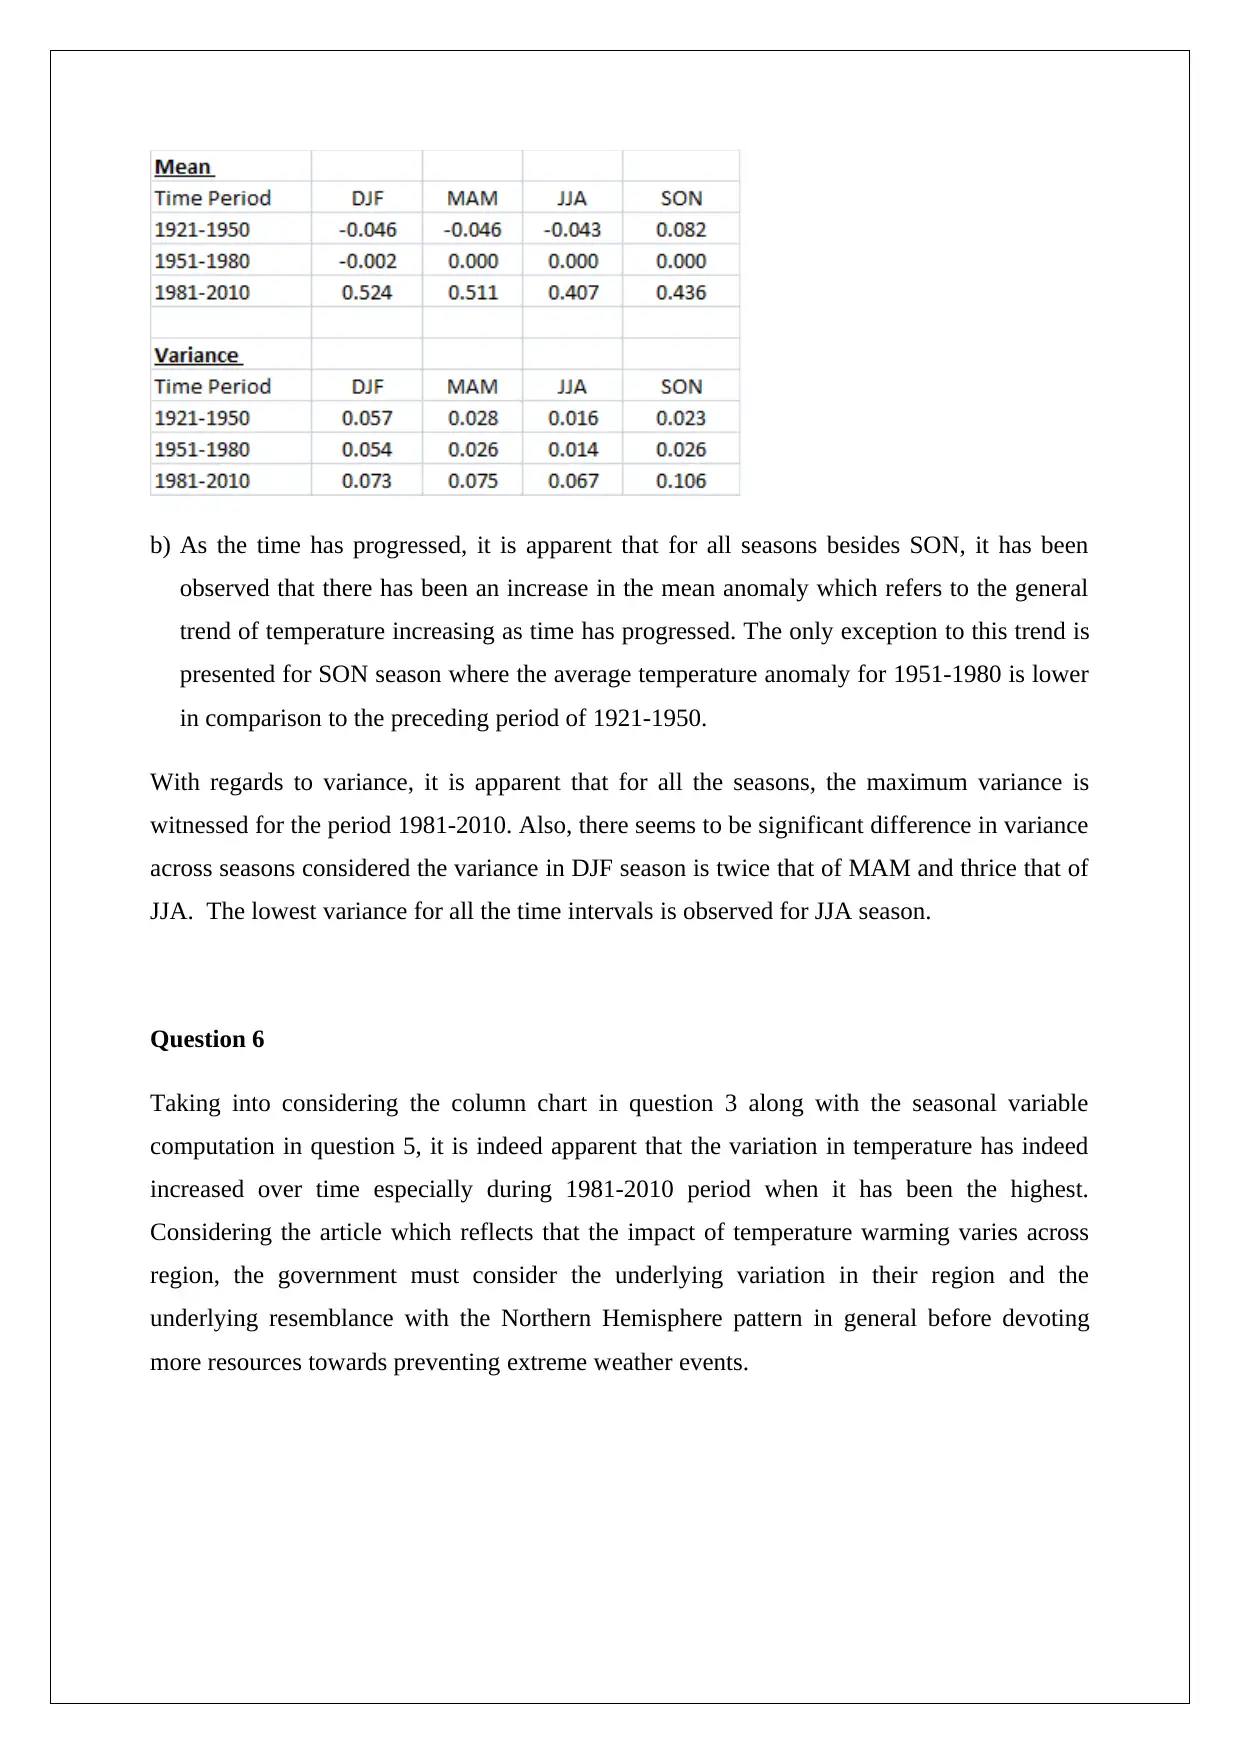
This document discusses the variations in temperature over time and their implications. It includes the analysis of frequency tables, column charts, deciles, mean, and variance. The document also highlights the impact of temperature warming and the importance of considering regional variations.
tabler-icon-diamond-filled.svg

Contribute Materials

Your contribution can guide someone’s learning journey. Share your documents today.
Document Page
ECONOMICS
STUDENT ID:
[Pick the date]
tabler-icon-diamond-filled.svg

Secure Best Marks with AI Grader

Need help grading? Try our AI Grader for instant feedback on your assignments.
Document Page
Part 1.2 Variations in Temperature over Time
Question 1
The requisite frequency table with regards to temperature over time is captured below.
Document Page
Question 2
a) The requisite column charts corresponding to the frequency tables represented above are
highlighted as follows.
Document Page
b) Considering the column charts for the two time periods as highlighted above, it is apparent
that over time there has been a right shift with regards to summer temperature anomalies.
This refers to the presence of more months which have been hotter during the 1981-2010
distribution in comparison to the 1951-1980 distribution. Also, it can be observed that the
temperature distribution during 1981-2000 is found to be flatter in comparison with the
period from 1951-1980. However, this might not be representative of increased variation
tabler-icon-diamond-filled.svg

Secure Best Marks with AI Grader

Need help grading? Try our AI Grader for instant feedback on your assignments.
Document Page
in temperature and instead may reflect that the temperature is not getting warmer to the
same degree across different parts. This is resulting in difference in temperature shift.
Question 3
The requisite deciles have been predicted using the PERCENTILE.INC function in excel for
the temperature data corresponding to the period from 1951 to 1980. The 3rd decile value has
been computed as -0.07 while the 7th decile value has been computed as 0.07. Based on the
information provided, it can be concluded that if the temperature anomalies is lower than -
0.07, then it would be considered as “cold”. On the other hand, any temperature anomalies
those are greater than 0.07 would be considered as “hot”.
Question 4
The objective is to use the reference ranges identified during 1951-1980 to quantify the
percentage of hot and cold temperature anomalies during the period 1981-2010. For the
temperature data corresponding to 1981-2010, there are only 2 instances which are lower than
-0.07 and hence would be considered cold. This implies that only 2.22% of the temperatures
are categorised as cold during 1981-2010 which is in sharp contrast with 1951-1980 when
there are 30% such temperatures. Also, for the temperature data corresponding to 1981-2010,
there are 77 instances which are greater than 0.07 and hence would be considered hot. This
implies that 85.56% of the temperatures are categorised as hot during 1981-2010 which is in
sharp contrast with 1951-1980 when there are 30% such temperatures. The above evidence is
clearly indicative of higher frequency of hot weather being experienced more frequently
during 1981-2010 as compared to the 1951-1980 period.
Question 5
a) The mean and variance for different seasons for the specified years has been captured
through the tables highlighted below.
Document Page
b) As the time has progressed, it is apparent that for all seasons besides SON, it has been
observed that there has been an increase in the mean anomaly which refers to the general
trend of temperature increasing as time has progressed. The only exception to this trend is
presented for SON season where the average temperature anomaly for 1951-1980 is lower
in comparison to the preceding period of 1921-1950.
With regards to variance, it is apparent that for all the seasons, the maximum variance is
witnessed for the period 1981-2010. Also, there seems to be significant difference in variance
across seasons considered the variance in DJF season is twice that of MAM and thrice that of
JJA. The lowest variance for all the time intervals is observed for JJA season.
Question 6
Taking into considering the column chart in question 3 along with the seasonal variable
computation in question 5, it is indeed apparent that the variation in temperature has indeed
increased over time especially during 1981-2010 period when it has been the highest.
Considering the article which reflects that the impact of temperature warming varies across
region, the government must consider the underlying variation in their region and the
underlying resemblance with the Northern Hemisphere pattern in general before devoting
more resources towards preventing extreme weather events.
Document Page
Reflection
The use of various quantitative skills proved to be immensely useful for the given project.
This can be indicated through various examples. For instance, the use of frequency table for
the two time periods facilitated a convenient comparison of the temperature anomalies in two
different time periods. This was further assisted through the use of deciles which again
allowed comparison between the time periods owing to the standard definition of decile as
10%. Additionally, the use of variance and mean also enabled comparison of the anomaly
movements not only across time periods but also across seasons. It was only because of these
quantitative data analysis skills that logical conclusion could be derived with regards to
temperature variations based on the data provided.
chevron_up_icon
1 out of 7
circle_padding
hide_on_mobile
zoom_out_icon
[object Object]

Your All-in-One AI-Powered Toolkit for Academic Success.

Available 24*7 on WhatsApp / Email

[object Object]