Economics Report: The Influence of Technology on Market Equilibrium
VerifiedAdded on 2020/07/23
|24
|4778
|43
Report
AI Summary
This economics report investigates the impact of technology on supply and demand dynamics within the automobile sector, employing both microeconomic and macroeconomic perspectives. It analyzes how technological advancements influence supply curves, leading to changes in production costs and equilibrium positions. The report further explores the effects of technology on demand, considering factors like price elasticity and consumer behavior. Macroeconomic considerations, such as the production possibility frontier and aggregate supply-demand models, are also examined to assess the broader implications of technological change, including its effects on employment and economic growth. The report uses examples from Ford and considers concepts like diminishing marginal returns, scarcity, choice and opportunity cost, and discusses inflation and Keynesian economic theories.
ECONOMICS
Paraphrase This Document
Need a fresh take? Get an instant paraphrase of this document with our AI Paraphraser
TABLE OF CONTENTS
1. INTRODUCTION.......................................................................................................................1
2. TECHNOLOGY IMPACTING SUPPLY CURVE ...................................................................1
2.1 Microeconomics ..............................................................................................................1
2.2 Macroeconomics...............................................................................................................4
3. TECHNOLOGY IMPACTING DEMAND CURVE .................................................................7
3.1 Microeconomics...............................................................................................................7
3.2 Macroeconomics...............................................................................................................8
4. MICROECONOMICS EQUILIBRIUM.....................................................................................9
5. CONCLUSION..........................................................................................................................10
REFERENCES .............................................................................................................................11
6. APPENDIX................................................................................................................................12
6.1 Micro-economics equilibrium........................................................................................12
6.2 Elasticity.........................................................................................................................12
6.2.1 Elasticity and revenue..................................................................................................13
6.2.2 Price elasticity of demand...........................................................................................13
6.2.3 Elasticity of Demand for vehicles...............................................................................15
6.3 Profit maximization firm................................................................................................15
6.4 AS-AD model macroeconomics equilibrium.................................................................18
6.5 Diminishing marginal returns, opportunity cost as scarcity and choice .......................19
1. INTRODUCTION
Field of economics can be distinguished into two parts such as micro and macro. In this,
microeconomics is highly concerned with the study of individual, group and company. On the
other side, macroeconomics lay emphasis on the study of national economy as a whole. In this,
the present report will shed light on the manner in which new technology affects the equilibrium
position, demand and supply of product market. By using both micro and macro-economic
approach influence of technological aspects on automobile sector will be assessed. For this
project, automobile sector has been selected which comes under the category of matured one.
Along with this, such sector is characterized with high economies of scale, capital insensitivity
and oligopoly competition. However, such sector also has some characteristics of perfect
competition which is filled up with more buyers and sellers. Thus, it will describe the way in
which technological aspects have an impact on both demand and supply curve. Besides this, it
also highlights how technological aspects ensure improvement in the efficiency and flexibility of
product lines in the context of medium sized and consumer segment vehicles such as Ford.
2. TECHNOLOGY IMPACTING SUPPLY CURVE
2.1 Microeconomics
Marketplace implies for the sum of all consumers and firm pertaining to specific vehicles.
As per the economic terms, consumer segment goods indicate for the normal, inferior and luxury
one. Supply in context of market is the available amount of product at a particular point of time
which is made available to public by company (Ehrenberg and Smith, 2016). So the supply curve
will be depicting relationship between price and quantity of goods for given period.
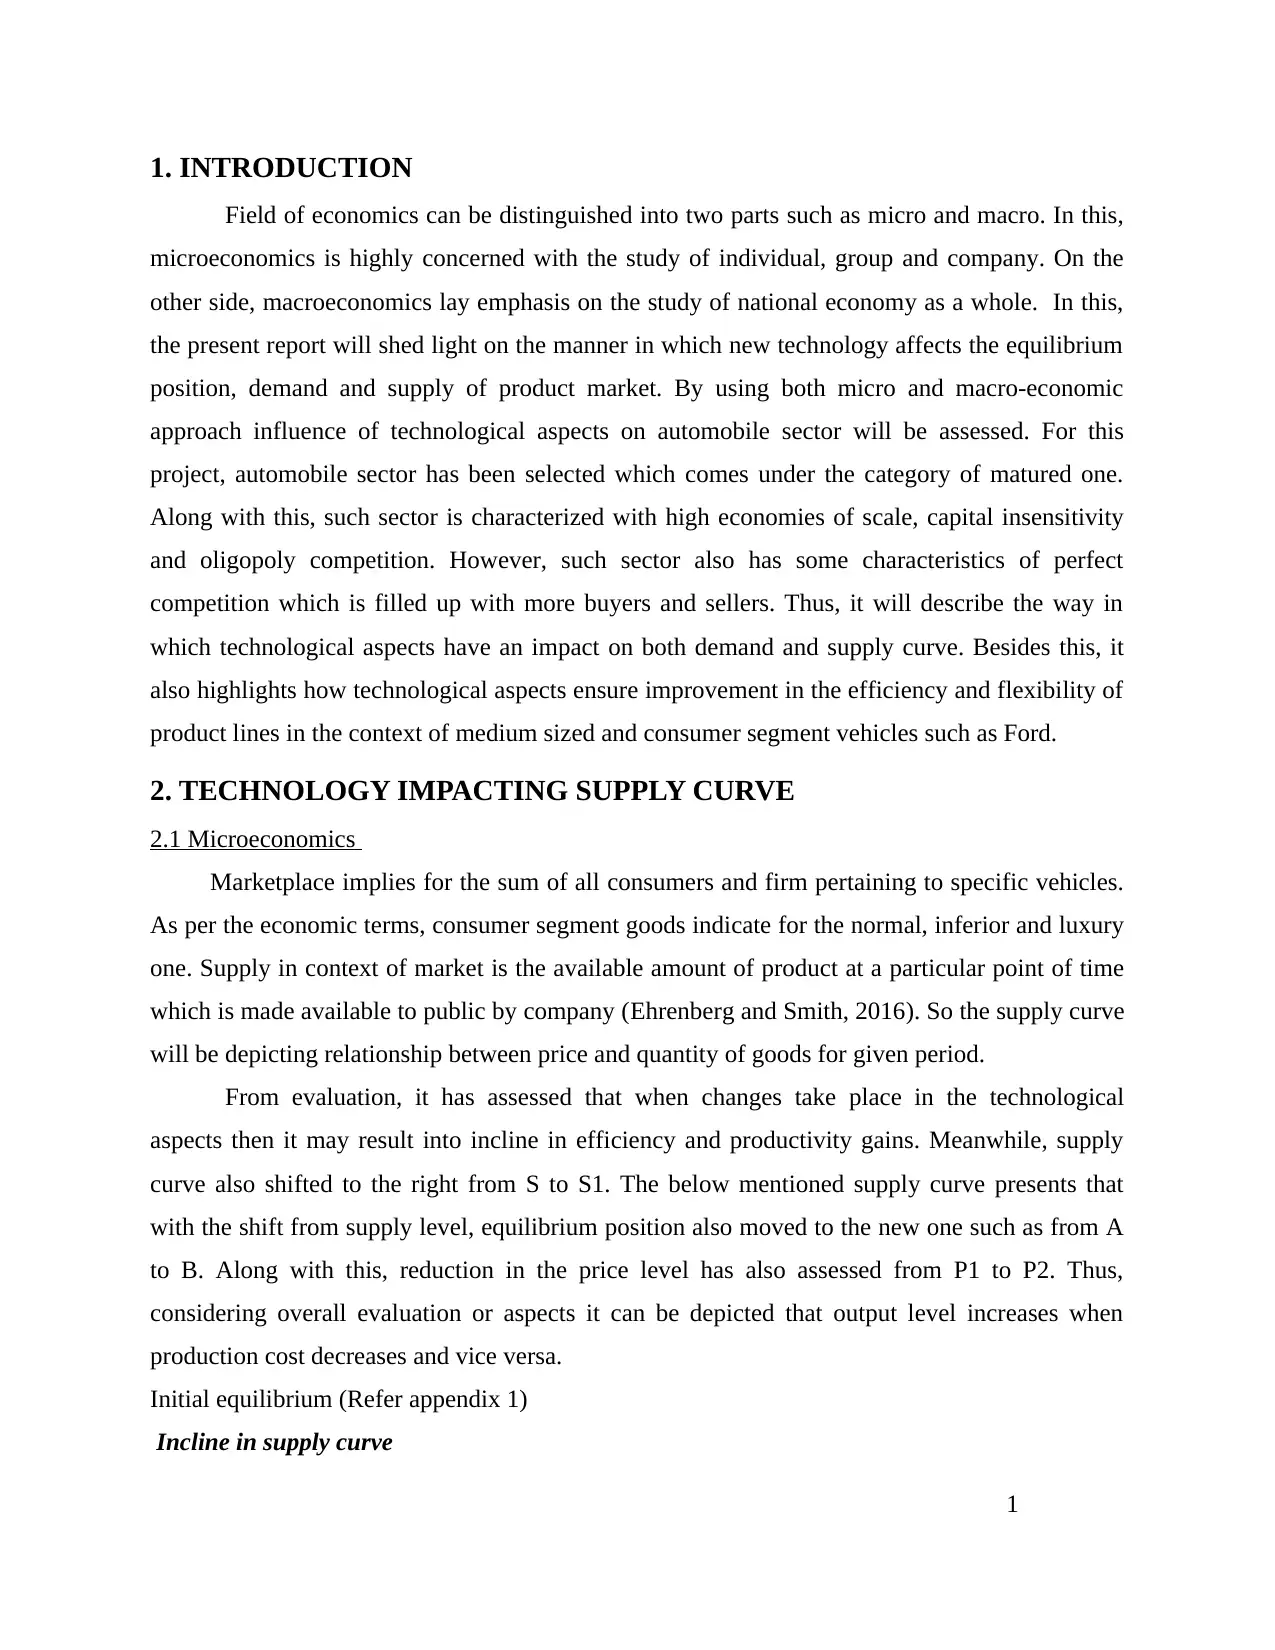
From evaluation, it has assessed that when changes take place in the technological
aspects then it may result into incline in efficiency and productivity gains. Meanwhile, supply
curve also shifted to the right from S to S1. The below mentioned supply curve presents that
with the shift from supply level, equilibrium position also moved to the new one such as from A
to B. Along with this, reduction in the price level has also assessed from P1 to P2. Thus,
considering overall evaluation or aspects it can be depicted that output level increases when
production cost decreases and vice versa.
Initial equilibrium (Refer appendix 1)
Incline in supply curve
1
Field of economics can be distinguished into two parts such as micro and macro. In this,
microeconomics is highly concerned with the study of individual, group and company. On the
other side, macroeconomics lay emphasis on the study of national economy as a whole. In this,
the present report will shed light on the manner in which new technology affects the equilibrium
position, demand and supply of product market. By using both micro and macro-economic
approach influence of technological aspects on automobile sector will be assessed. For this
project, automobile sector has been selected which comes under the category of matured one.
Along with this, such sector is characterized with high economies of scale, capital insensitivity
and oligopoly competition. However, such sector also has some characteristics of perfect
competition which is filled up with more buyers and sellers. Thus, it will describe the way in
which technological aspects have an impact on both demand and supply curve. Besides this, it
also highlights how technological aspects ensure improvement in the efficiency and flexibility of
product lines in the context of medium sized and consumer segment vehicles such as Ford.
2. TECHNOLOGY IMPACTING SUPPLY CURVE
2.1 Microeconomics
Marketplace implies for the sum of all consumers and firm pertaining to specific vehicles.
As per the economic terms, consumer segment goods indicate for the normal, inferior and luxury
one. Supply in context of market is the available amount of product at a particular point of time
which is made available to public by company (Ehrenberg and Smith, 2016). So the supply curve
will be depicting relationship between price and quantity of goods for given period.
From evaluation, it has assessed that when changes take place in the technological
aspects then it may result into incline in efficiency and productivity gains. Meanwhile, supply
curve also shifted to the right from S to S1. The below mentioned supply curve presents that
with the shift from supply level, equilibrium position also moved to the new one such as from A
to B. Along with this, reduction in the price level has also assessed from P1 to P2. Thus,
considering overall evaluation or aspects it can be depicted that output level increases when
production cost decreases and vice versa.
Initial equilibrium (Refer appendix 1)
Incline in supply curve
1
⊘ This is a preview!⊘
Do you want full access?
Subscribe today to unlock all pages.
Trusted by 1+ million students worldwide
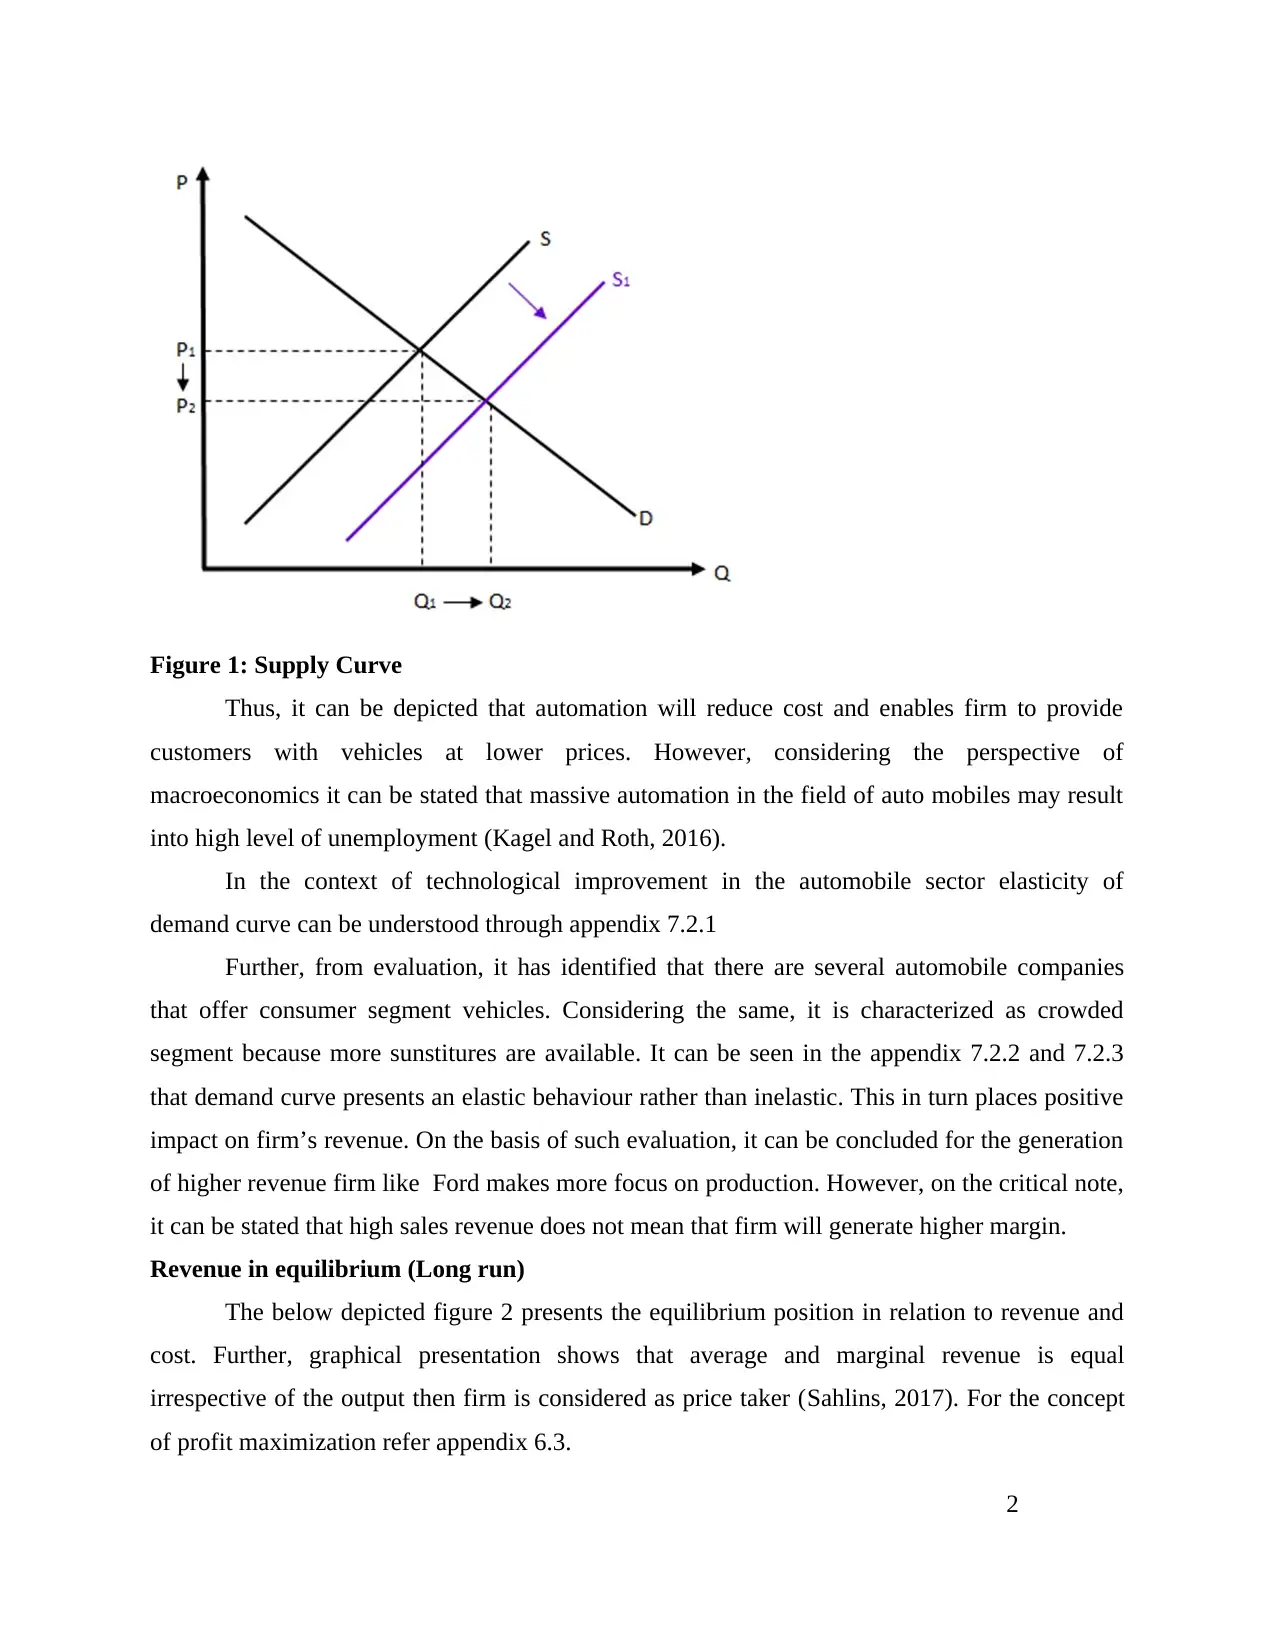
Figure 1: Supply Curve
Thus, it can be depicted that automation will reduce cost and enables firm to provide
customers with vehicles at lower prices. However, considering the perspective of
macroeconomics it can be stated that massive automation in the field of auto mobiles may result
into high level of unemployment (Kagel and Roth, 2016).
In the context of technological improvement in the automobile sector elasticity of
demand curve can be understood through appendix 7.2.1
Further, from evaluation, it has identified that there are several automobile companies
that offer consumer segment vehicles. Considering the same, it is characterized as crowded
segment because more sunstitures are available. It can be seen in the appendix 7.2.2 and 7.2.3
that demand curve presents an elastic behaviour rather than inelastic. This in turn places positive
impact on firm’s revenue. On the basis of such evaluation, it can be concluded for the generation
of higher revenue firm like Ford makes more focus on production. However, on the critical note,
it can be stated that high sales revenue does not mean that firm will generate higher margin.
Revenue in equilibrium (Long run)
The below depicted figure 2 presents the equilibrium position in relation to revenue and
cost. Further, graphical presentation shows that average and marginal revenue is equal
irrespective of the output then firm is considered as price taker (Sahlins, 2017). For the concept
of profit maximization refer appendix 6.3.
2
Paraphrase This Document
Need a fresh take? Get an instant paraphrase of this document with our AI Paraphraser
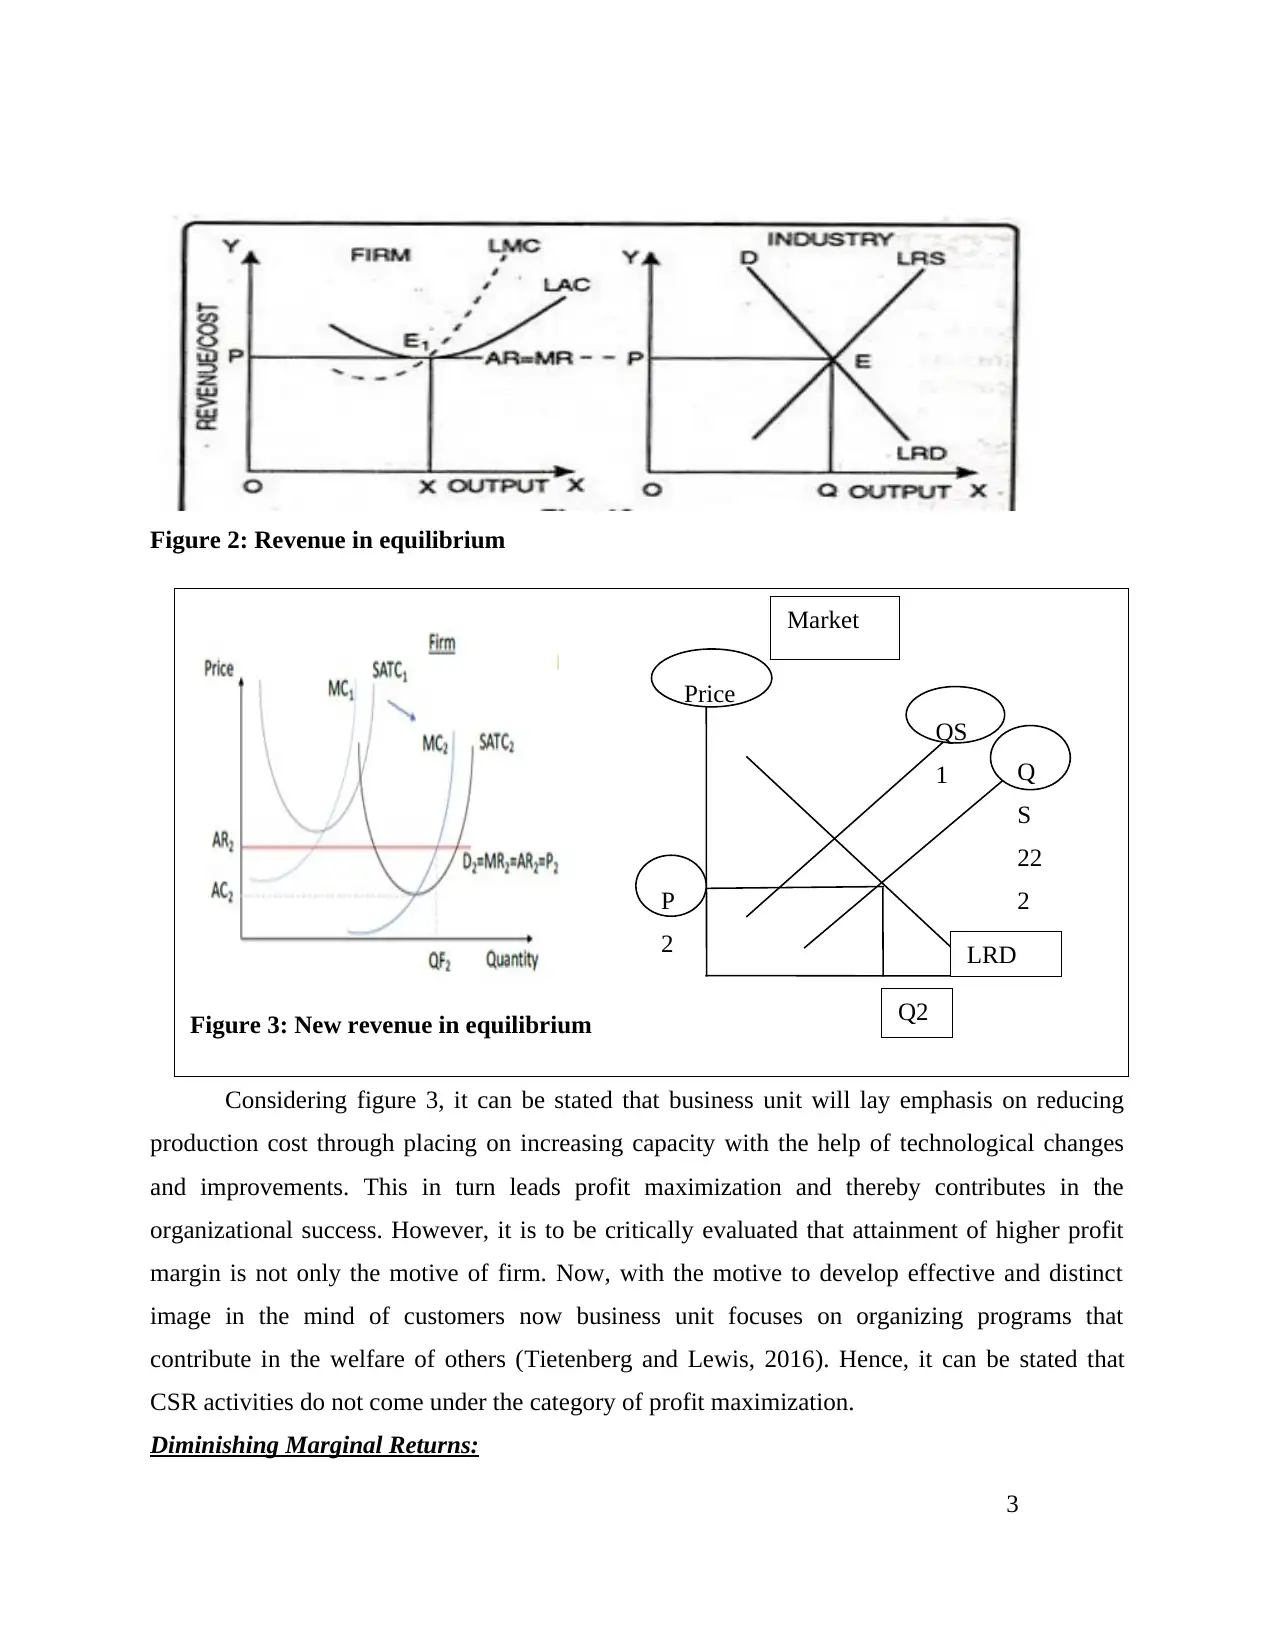
Figure 2: Revenue in equilibrium
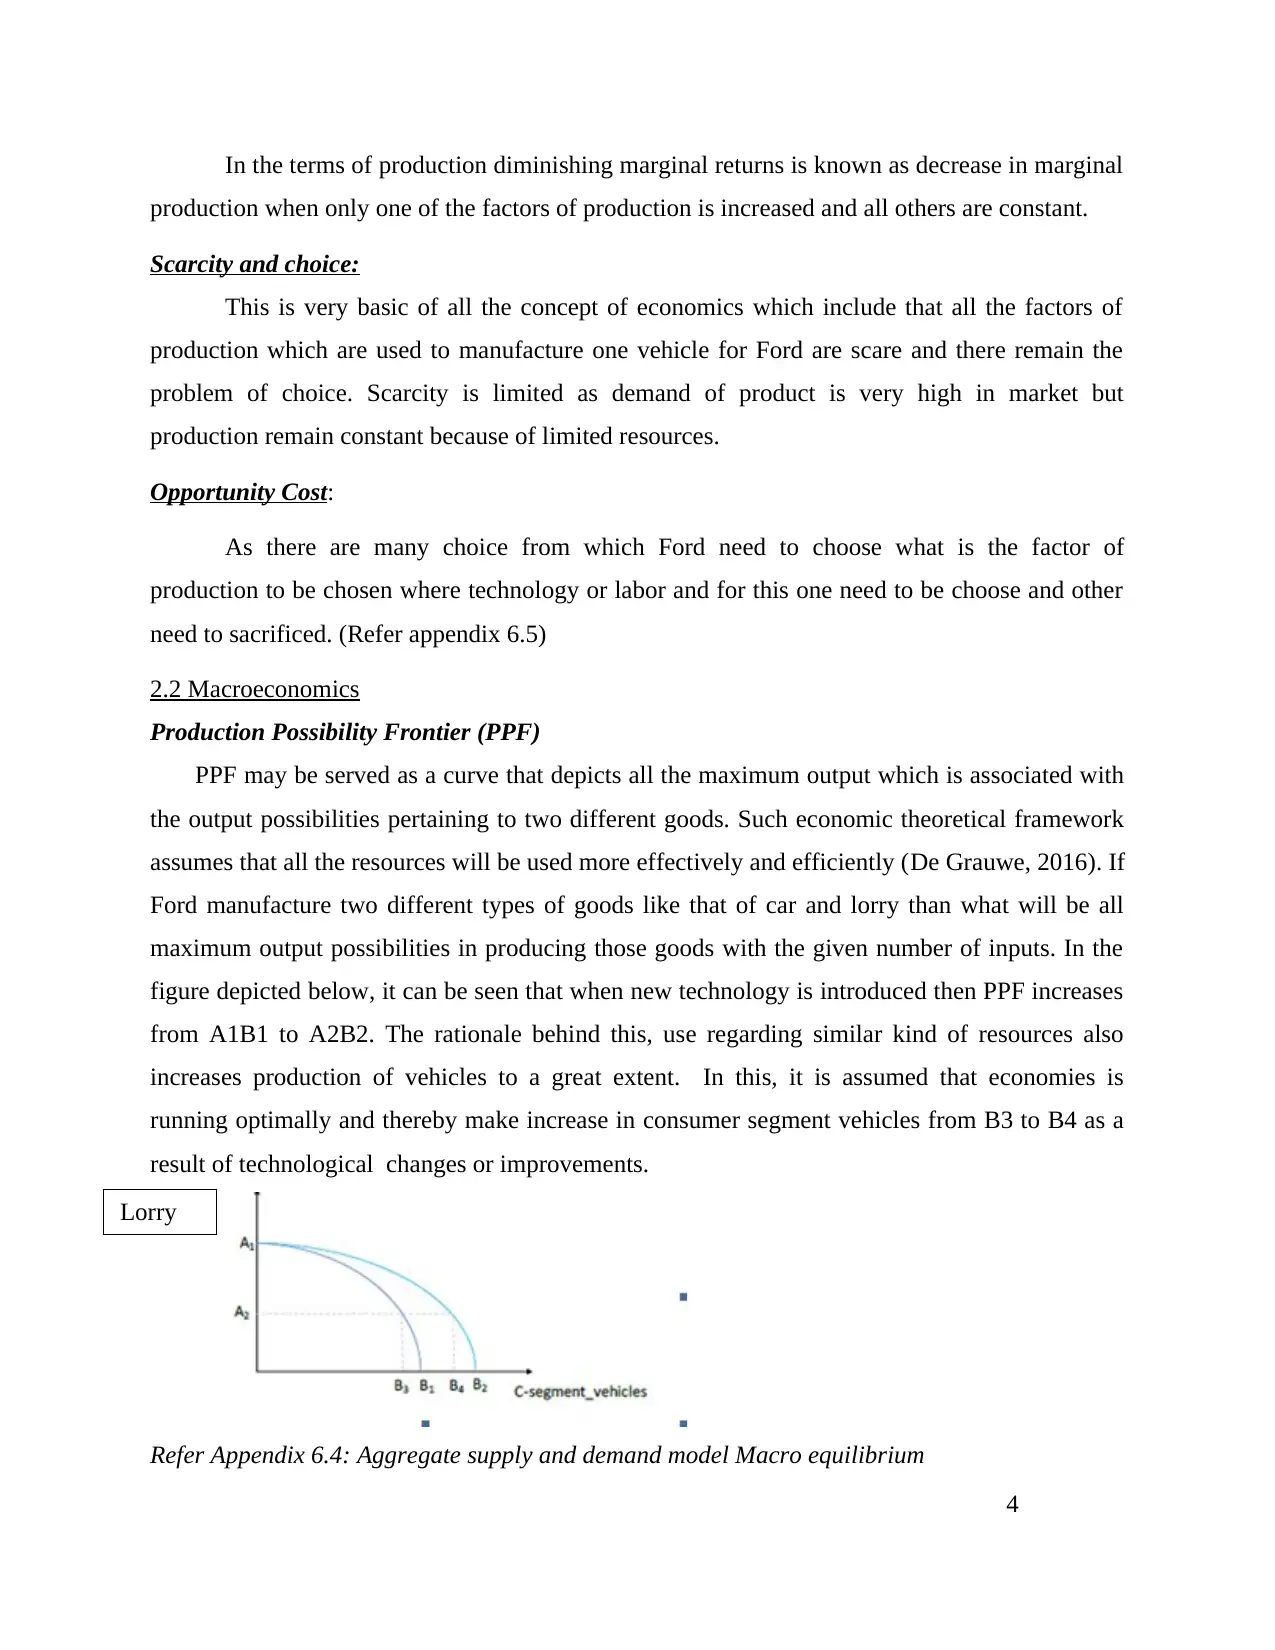
Considering figure 3, it can be stated that business unit will lay emphasis on reducing
production cost through placing on increasing capacity with the help of technological changes
and improvements. This in turn leads profit maximization and thereby contributes in the
organizational success. However, it is to be critically evaluated that attainment of higher profit
margin is not only the motive of firm. Now, with the motive to develop effective and distinct
image in the mind of customers now business unit focuses on organizing programs that
contribute in the welfare of others (Tietenberg and Lewis, 2016). Hence, it can be stated that
CSR activities do not come under the category of profit maximization.
Diminishing Marginal Returns:
3
Figure 3: New revenue in equilibrium
Market
LRD
QS
1 Q
S
22
2
Q2
Price
P
2
In the terms of production diminishing marginal returns is known as decrease in marginal
production when only one of the factors of production is increased and all others are constant.
Scarcity and choice:
This is very basic of all the concept of economics which include that all the factors of
production which are used to manufacture one vehicle for Ford are scare and there remain the
problem of choice. Scarcity is limited as demand of product is very high in market but
production remain constant because of limited resources.
Opportunity Cost:
As there are many choice from which Ford need to choose what is the factor of
production to be chosen where technology or labor and for this one need to be choose and other
need to sacrificed. (Refer appendix 6.5)
2.2 Macroeconomics
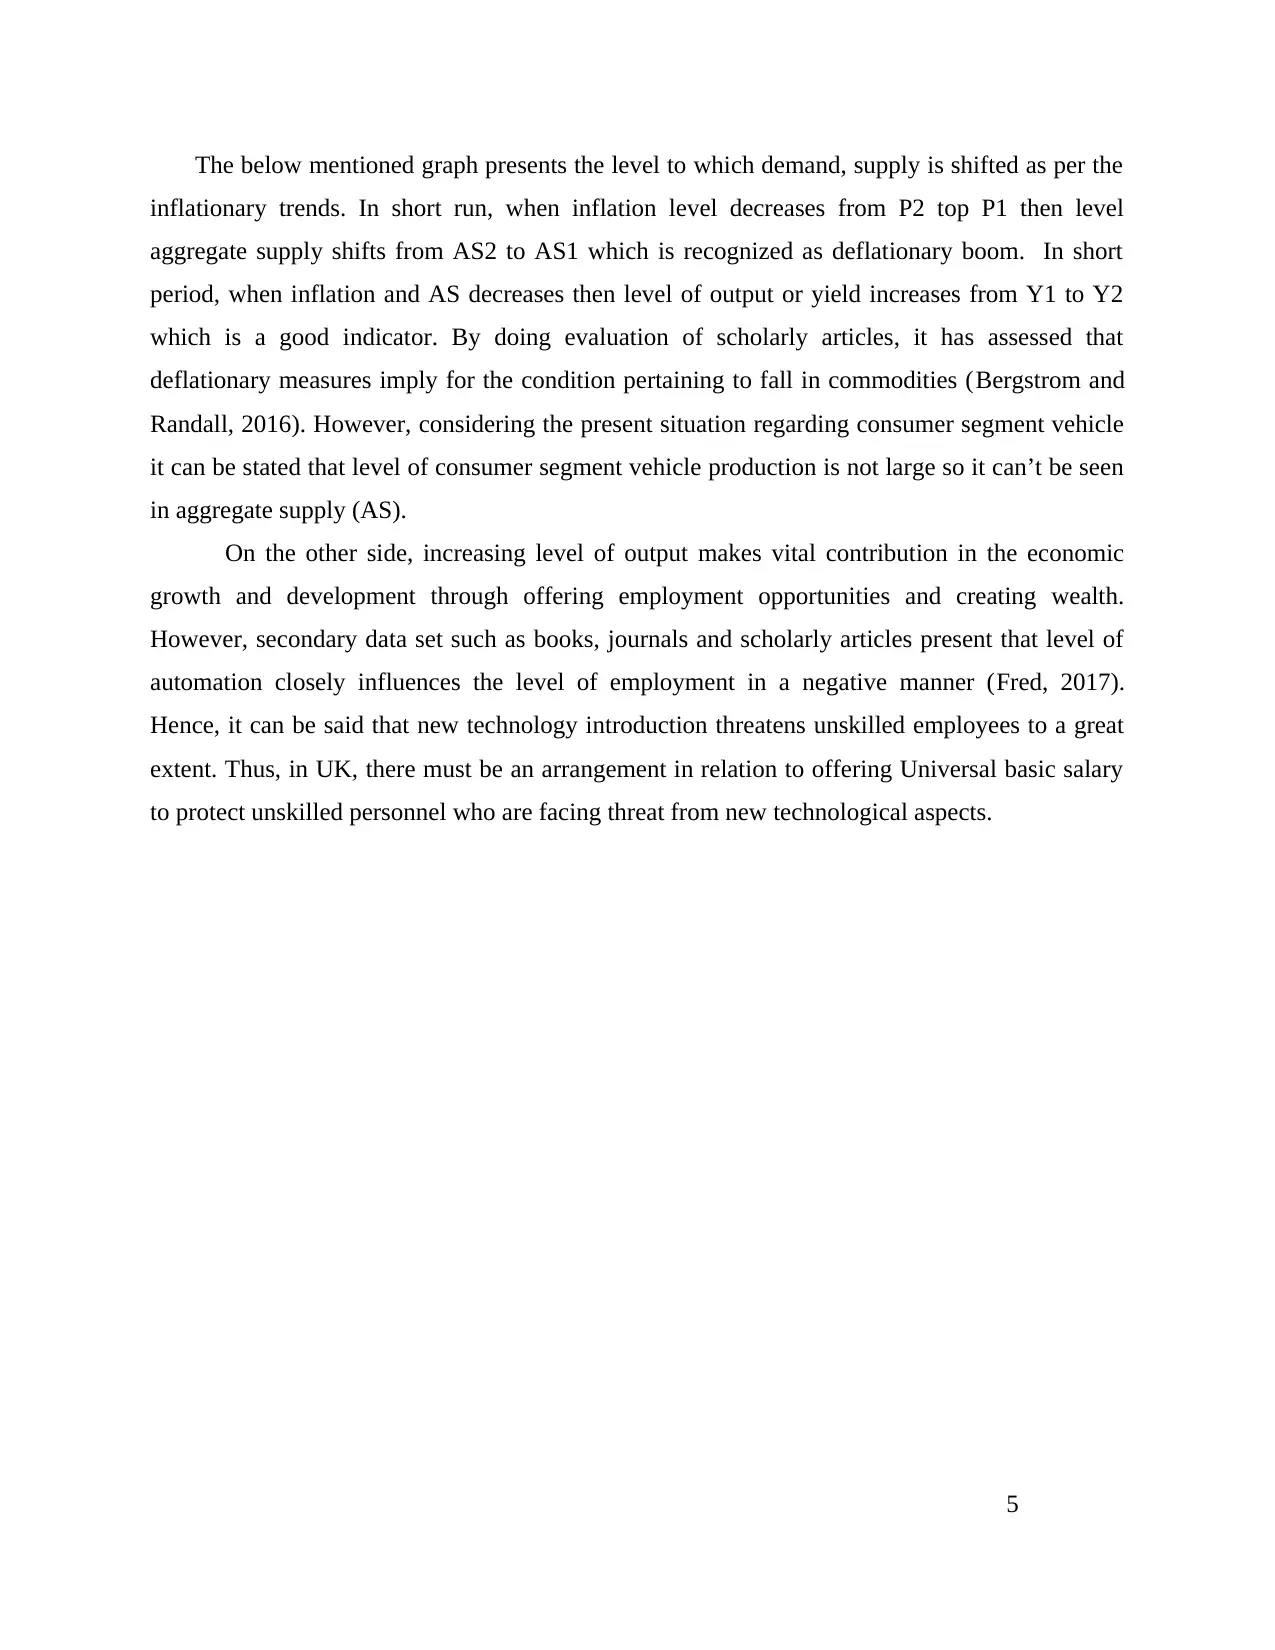
Production Possibility Frontier (PPF)
PPF may be served as a curve that depicts all the maximum output which is associated with
the output possibilities pertaining to two different goods. Such economic theoretical framework
assumes that all the resources will be used more effectively and efficiently (De Grauwe, 2016). If
Ford manufacture two different types of goods like that of car and lorry than what will be all
maximum output possibilities in producing those goods with the given number of inputs. In the
figure depicted below, it can be seen that when new technology is introduced then PPF increases
from A1B1 to A2B2. The rationale behind this, use regarding similar kind of resources also
increases production of vehicles to a great extent. In this, it is assumed that economies is
running optimally and thereby make increase in consumer segment vehicles from B3 to B4 as a
result of technological changes or improvements.
Refer Appendix 6.4: Aggregate supply and demand model Macro equilibrium
4
Lorry
production when only one of the factors of production is increased and all others are constant.
Scarcity and choice:
This is very basic of all the concept of economics which include that all the factors of
production which are used to manufacture one vehicle for Ford are scare and there remain the
problem of choice. Scarcity is limited as demand of product is very high in market but
production remain constant because of limited resources.
Opportunity Cost:
As there are many choice from which Ford need to choose what is the factor of
production to be chosen where technology or labor and for this one need to be choose and other
need to sacrificed. (Refer appendix 6.5)
2.2 Macroeconomics
Production Possibility Frontier (PPF)
PPF may be served as a curve that depicts all the maximum output which is associated with
the output possibilities pertaining to two different goods. Such economic theoretical framework
assumes that all the resources will be used more effectively and efficiently (De Grauwe, 2016). If
Ford manufacture two different types of goods like that of car and lorry than what will be all
maximum output possibilities in producing those goods with the given number of inputs. In the
figure depicted below, it can be seen that when new technology is introduced then PPF increases
from A1B1 to A2B2. The rationale behind this, use regarding similar kind of resources also
increases production of vehicles to a great extent. In this, it is assumed that economies is
running optimally and thereby make increase in consumer segment vehicles from B3 to B4 as a
result of technological changes or improvements.
Refer Appendix 6.4: Aggregate supply and demand model Macro equilibrium
4
Lorry
⊘ This is a preview!⊘
Do you want full access?
Subscribe today to unlock all pages.
Trusted by 1+ million students worldwide
The below mentioned graph presents the level to which demand, supply is shifted as per the
inflationary trends. In short run, when inflation level decreases from P2 top P1 then level
aggregate supply shifts from AS2 to AS1 which is recognized as deflationary boom. In short
period, when inflation and AS decreases then level of output or yield increases from Y1 to Y2
which is a good indicator. By doing evaluation of scholarly articles, it has assessed that
deflationary measures imply for the condition pertaining to fall in commodities (Bergstrom and
Randall, 2016). However, considering the present situation regarding consumer segment vehicle
it can be stated that level of consumer segment vehicle production is not large so it can’t be seen
in aggregate supply (AS).
On the other side, increasing level of output makes vital contribution in the economic
growth and development through offering employment opportunities and creating wealth.
However, secondary data set such as books, journals and scholarly articles present that level of
automation closely influences the level of employment in a negative manner (Fred, 2017).
Hence, it can be said that new technology introduction threatens unskilled employees to a great
extent. Thus, in UK, there must be an arrangement in relation to offering Universal basic salary
to protect unskilled personnel who are facing threat from new technological aspects.
5
Paraphrase This Document
Need a fresh take? Get an instant paraphrase of this document with our AI Paraphraser
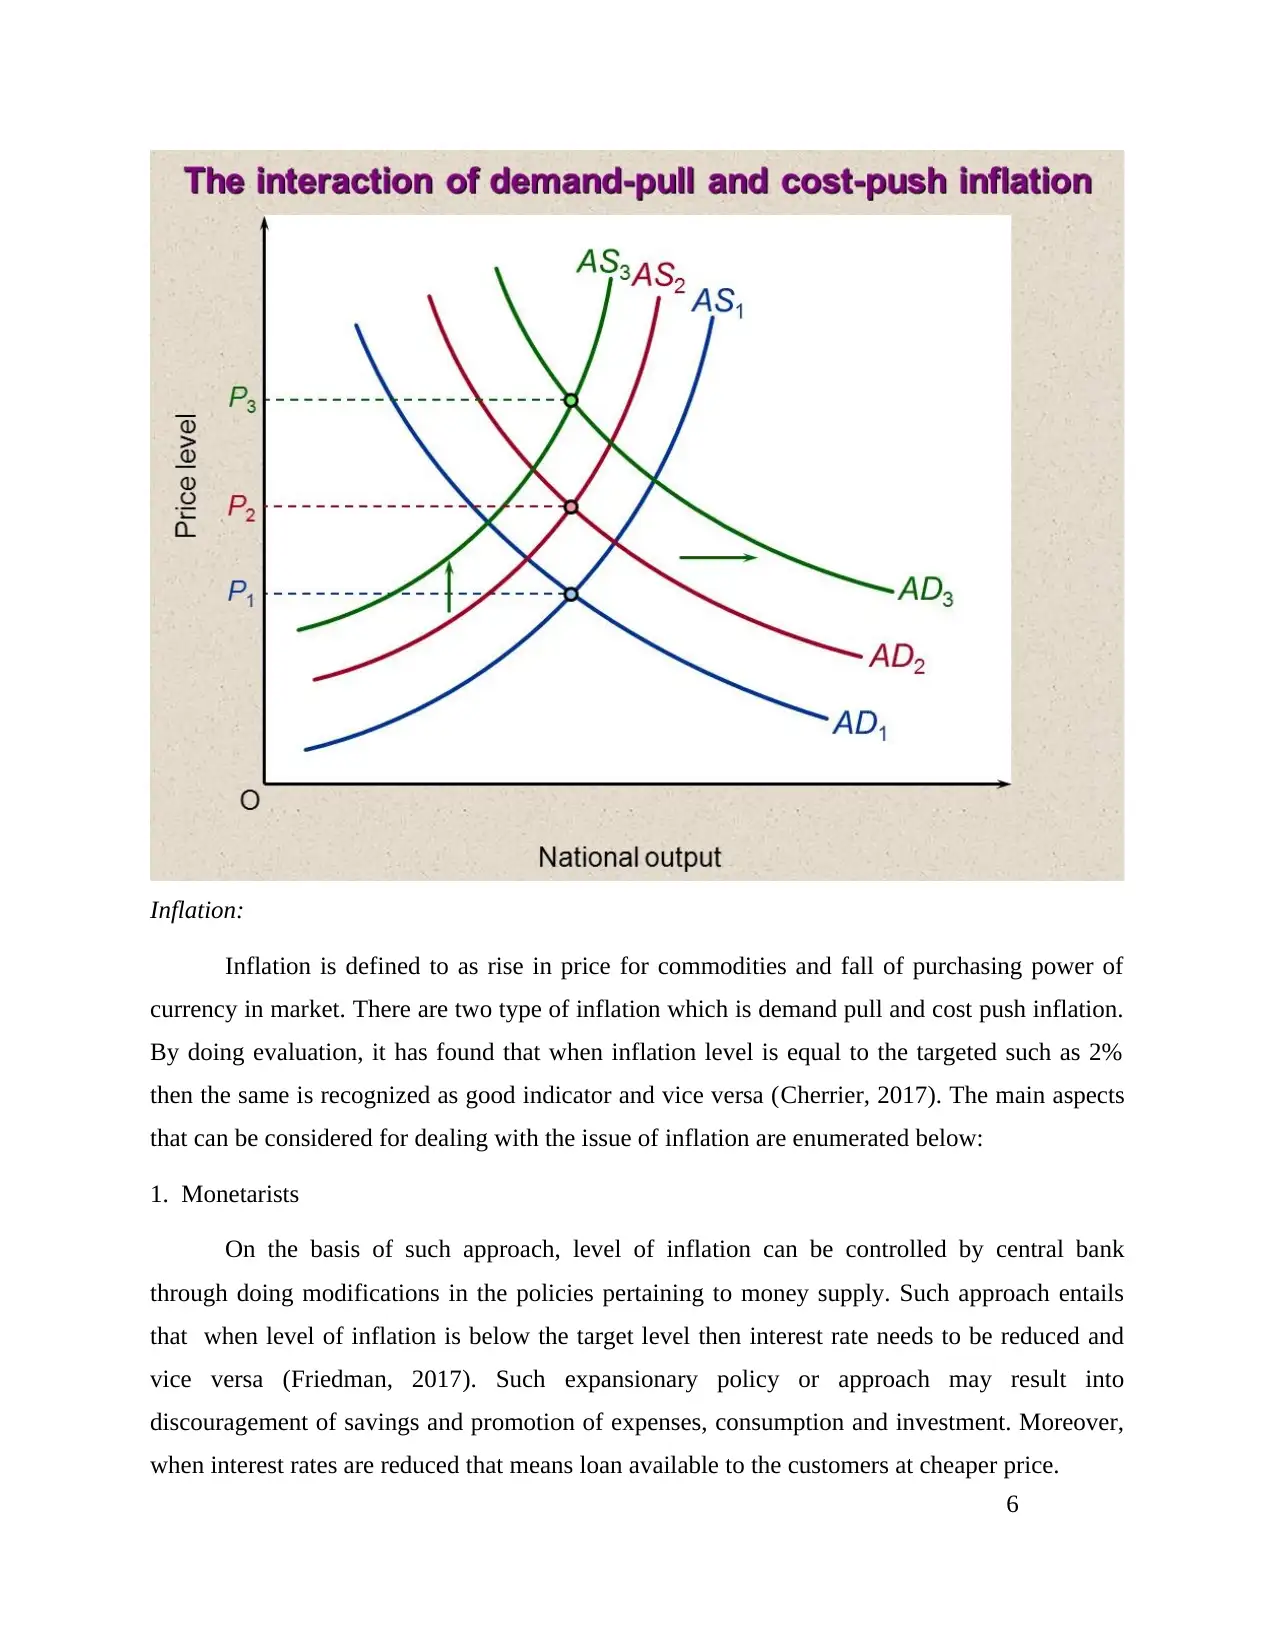
Inflation:
Inflation is defined to as rise in price for commodities and fall of purchasing power of
currency in market. There are two type of inflation which is demand pull and cost push inflation.
By doing evaluation, it has found that when inflation level is equal to the targeted such as 2%
then the same is recognized as good indicator and vice versa (Cherrier, 2017). The main aspects
that can be considered for dealing with the issue of inflation are enumerated below:
1. Monetarists
On the basis of such approach, level of inflation can be controlled by central bank
through doing modifications in the policies pertaining to money supply. Such approach entails
that when level of inflation is below the target level then interest rate needs to be reduced and
vice versa (Friedman, 2017). Such expansionary policy or approach may result into
discouragement of savings and promotion of expenses, consumption and investment. Moreover,
when interest rates are reduced that means loan available to the customers at cheaper price.
6
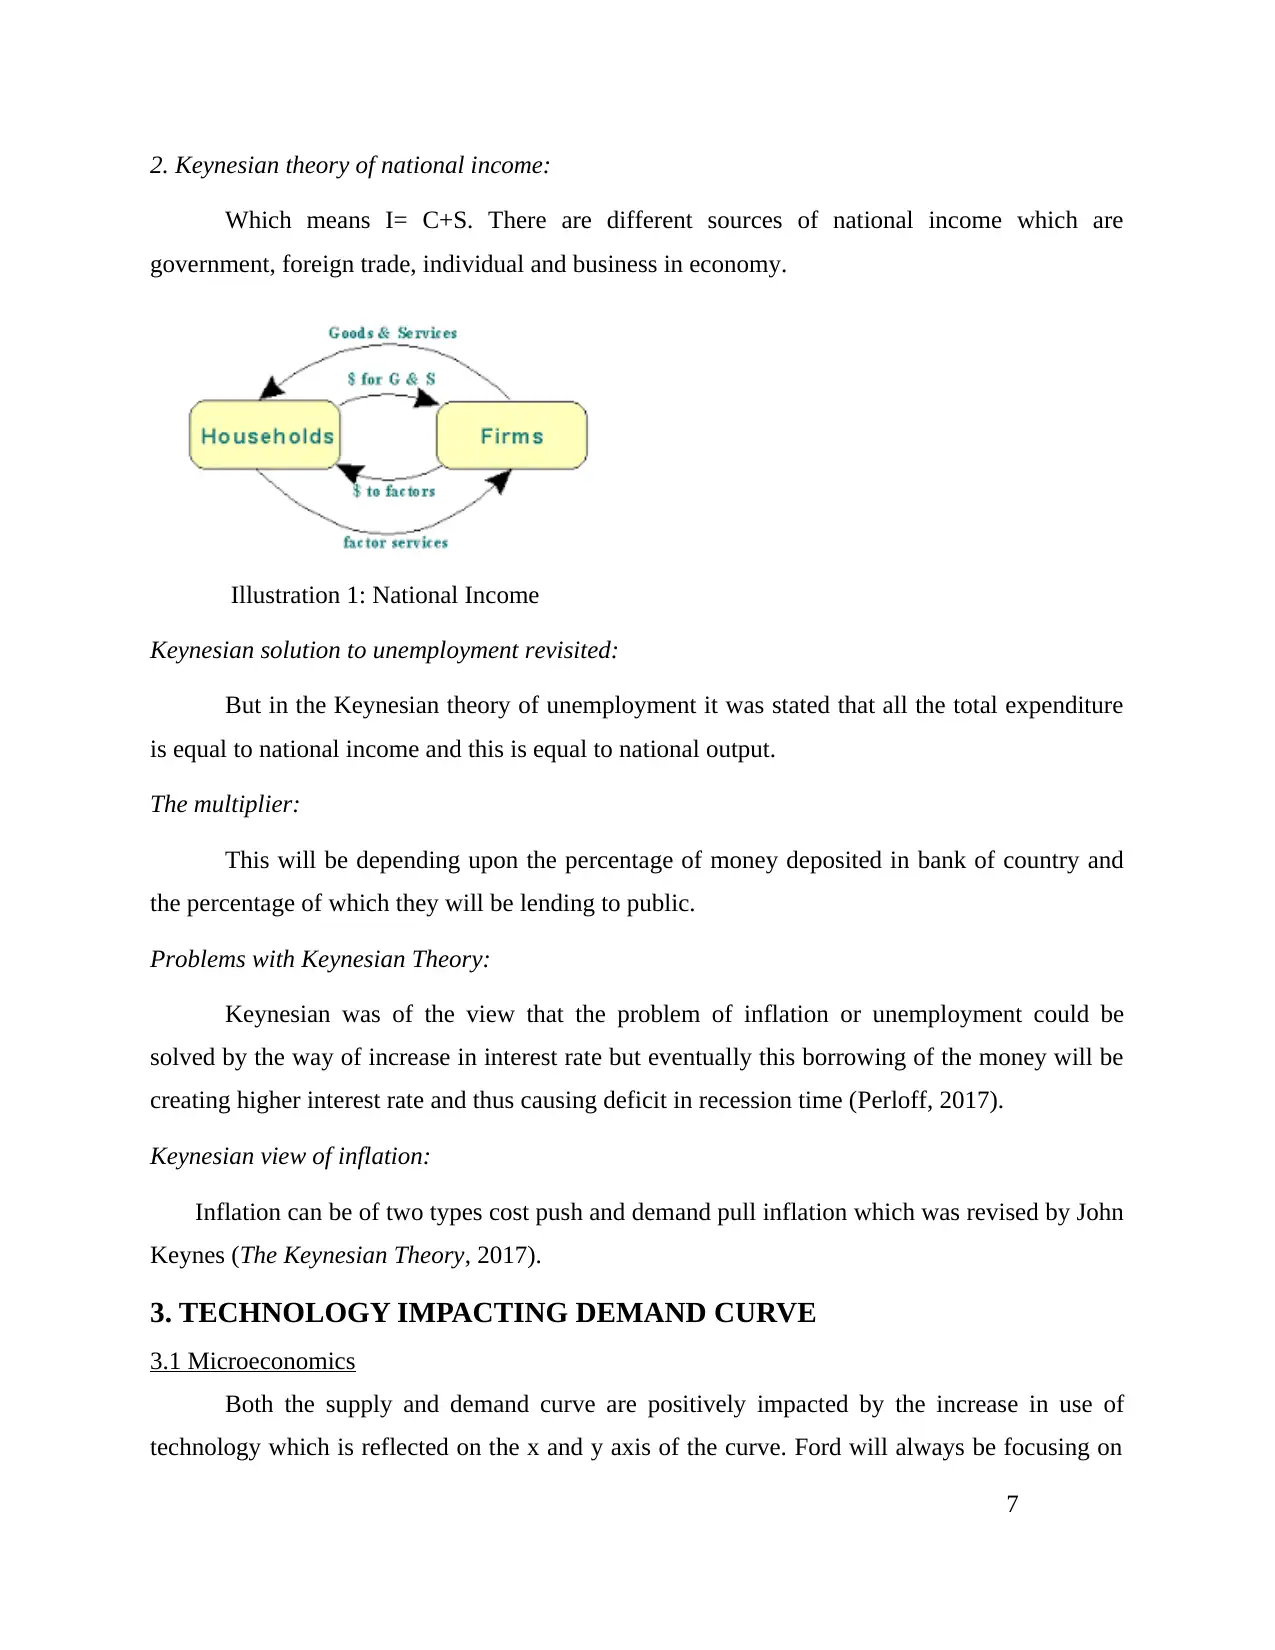
2. Keynesian theory of national income:
Which means I= C+S. There are different sources of national income which are
government, foreign trade, individual and business in economy.
Illustration 1: National Income
Keynesian solution to unemployment revisited:
But in the Keynesian theory of unemployment it was stated that all the total expenditure
is equal to national income and this is equal to national output.
The multiplier:
This will be depending upon the percentage of money deposited in bank of country and
the percentage of which they will be lending to public.
Problems with Keynesian Theory:
Keynesian was of the view that the problem of inflation or unemployment could be
solved by the way of increase in interest rate but eventually this borrowing of the money will be
creating higher interest rate and thus causing deficit in recession time (Perloff, 2017).
Keynesian view of inflation:
Inflation can be of two types cost push and demand pull inflation which was revised by John
Keynes (The Keynesian Theory, 2017).
3. TECHNOLOGY IMPACTING DEMAND CURVE
3.1 Microeconomics
Both the supply and demand curve are positively impacted by the increase in use of
technology which is reflected on the x and y axis of the curve. Ford will always be focusing on
7
⊘ This is a preview!⊘
Do you want full access?
Subscribe today to unlock all pages.
Trusted by 1+ million students worldwide
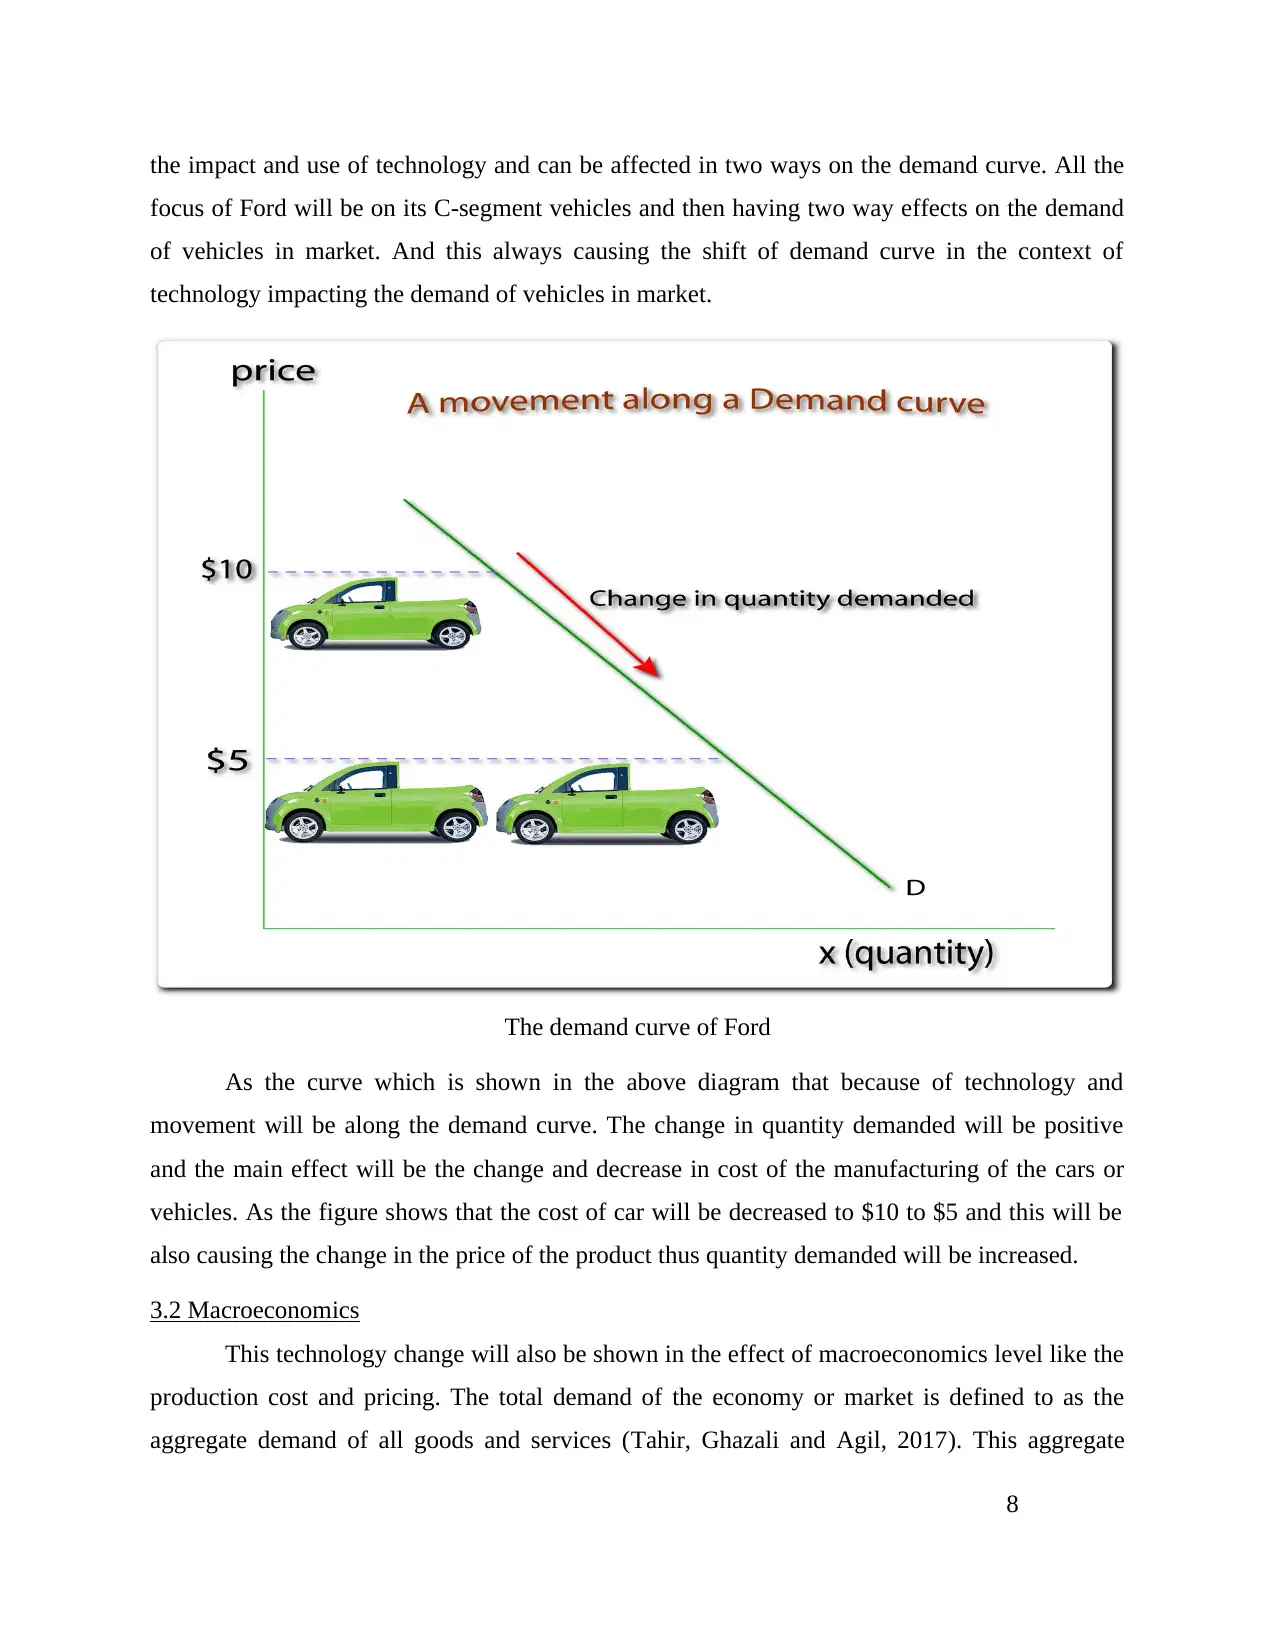
the impact and use of technology and can be affected in two ways on the demand curve. All the
focus of Ford will be on its C-segment vehicles and then having two way effects on the demand
of vehicles in market. And this always causing the shift of demand curve in the context of
technology impacting the demand of vehicles in market.
The demand curve of Ford
As the curve which is shown in the above diagram that because of technology and
movement will be along the demand curve. The change in quantity demanded will be positive
and the main effect will be the change and decrease in cost of the manufacturing of the cars or
vehicles. As the figure shows that the cost of car will be decreased to $10 to $5 and this will be
also causing the change in the price of the product thus quantity demanded will be increased.
3.2 Macroeconomics
This technology change will also be shown in the effect of macroeconomics level like the
production cost and pricing. The total demand of the economy or market is defined to as the
aggregate demand of all goods and services (Tahir, Ghazali and Agil, 2017). This aggregate
8
Paraphrase This Document
Need a fresh take? Get an instant paraphrase of this document with our AI Paraphraser
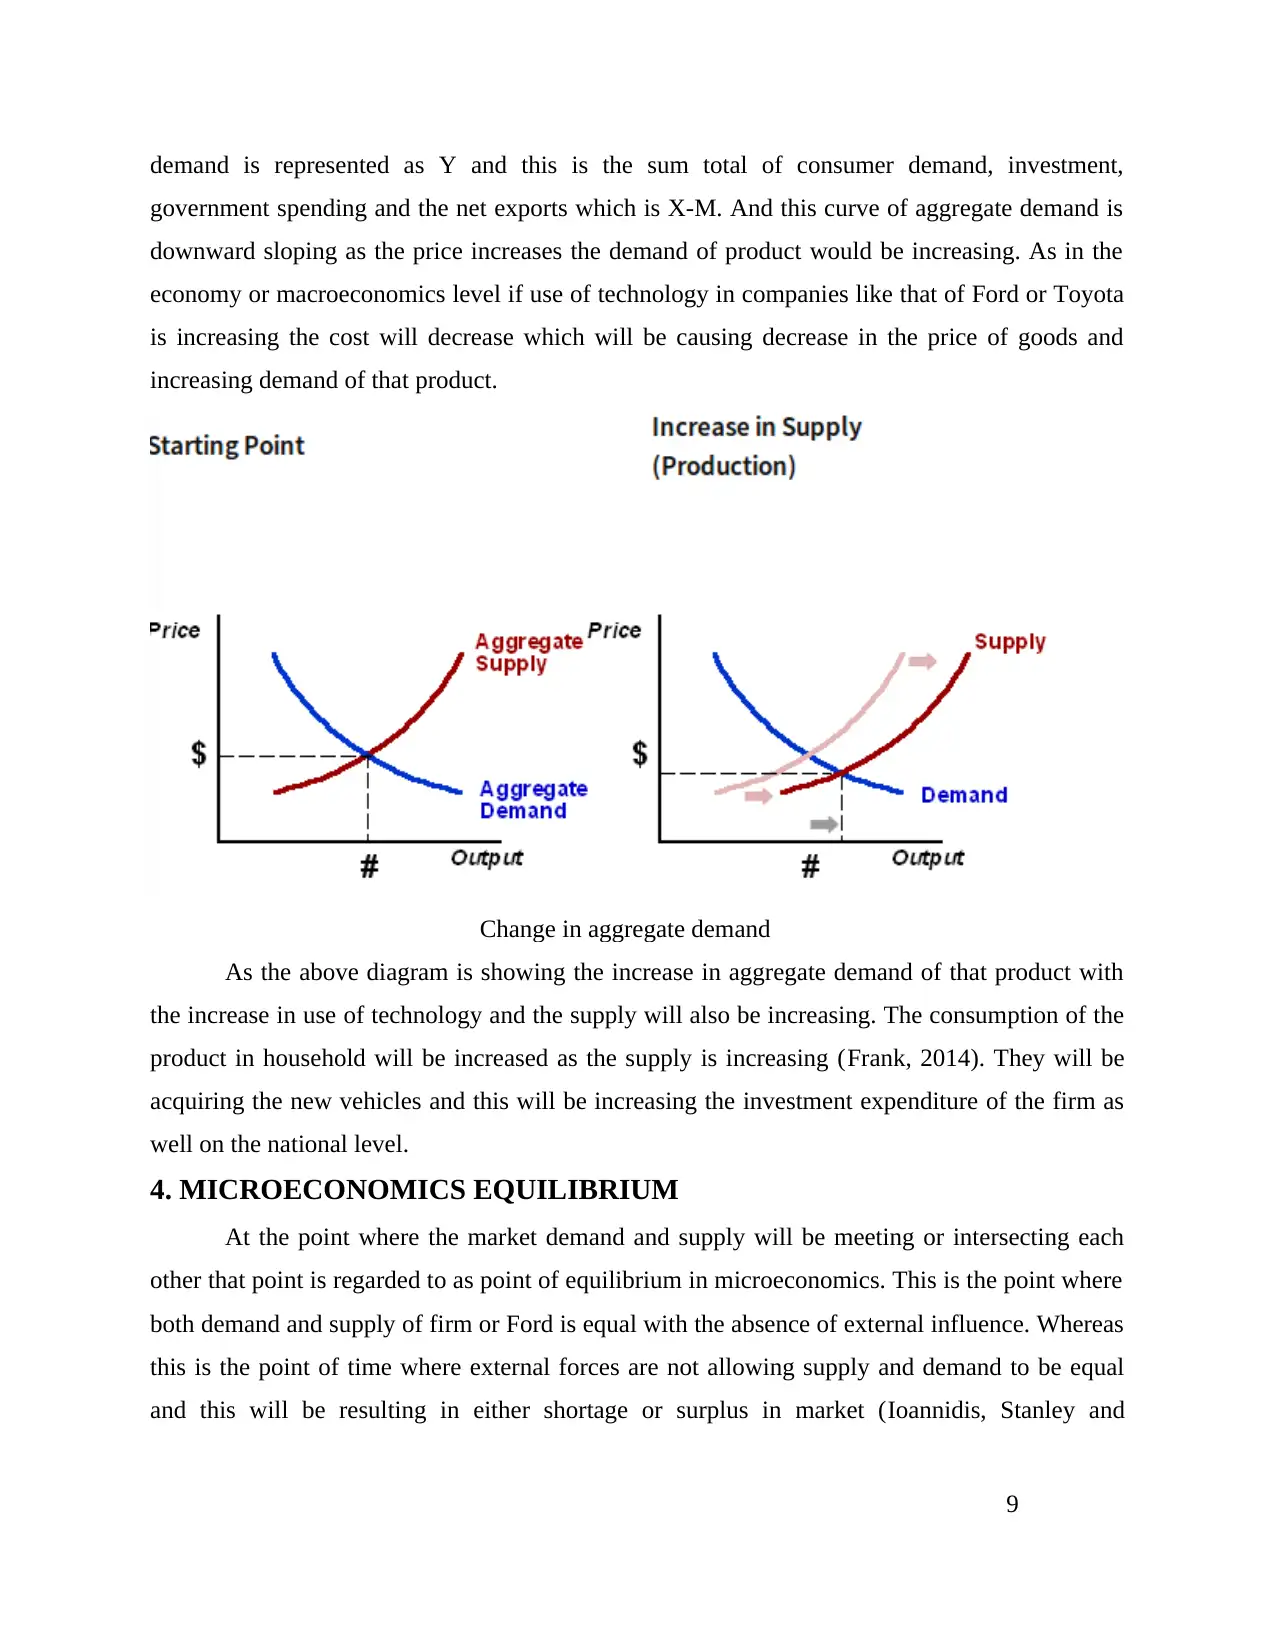
demand is represented as Y and this is the sum total of consumer demand, investment,
government spending and the net exports which is X-M. And this curve of aggregate demand is
downward sloping as the price increases the demand of product would be increasing. As in the
economy or macroeconomics level if use of technology in companies like that of Ford or Toyota
is increasing the cost will decrease which will be causing decrease in the price of goods and
increasing demand of that product.
Change in aggregate demand
As the above diagram is showing the increase in aggregate demand of that product with
the increase in use of technology and the supply will also be increasing. The consumption of the
product in household will be increased as the supply is increasing (Frank, 2014). They will be
acquiring the new vehicles and this will be increasing the investment expenditure of the firm as
well on the national level.
4. MICROECONOMICS EQUILIBRIUM
At the point where the market demand and supply will be meeting or intersecting each
other that point is regarded to as point of equilibrium in microeconomics. This is the point where
both demand and supply of firm or Ford is equal with the absence of external influence. Whereas
this is the point of time where external forces are not allowing supply and demand to be equal
and this will be resulting in either shortage or surplus in market (Ioannidis, Stanley and
9
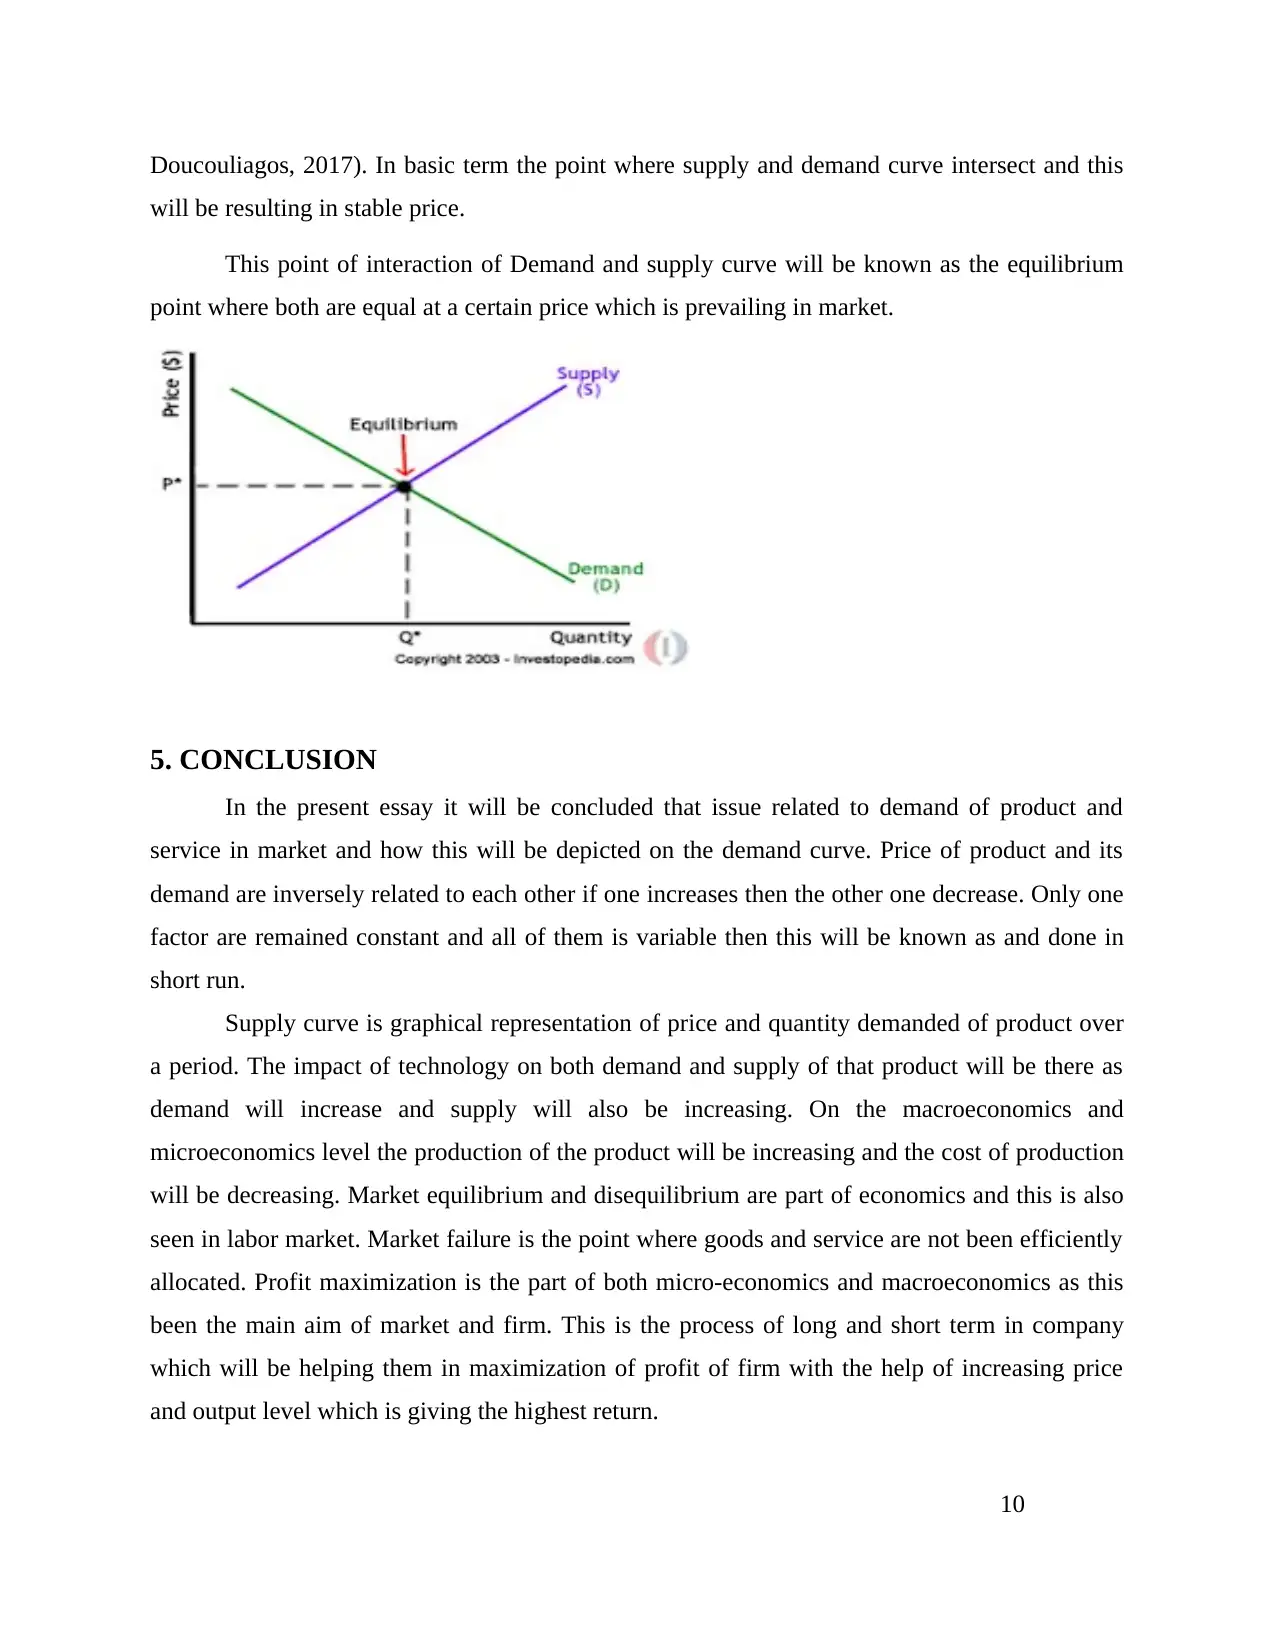
Doucouliagos, 2017). In basic term the point where supply and demand curve intersect and this
will be resulting in stable price.
This point of interaction of Demand and supply curve will be known as the equilibrium
point where both are equal at a certain price which is prevailing in market.
5. CONCLUSION
In the present essay it will be concluded that issue related to demand of product and
service in market and how this will be depicted on the demand curve. Price of product and its
demand are inversely related to each other if one increases then the other one decrease. Only one
factor are remained constant and all of them is variable then this will be known as and done in
short run.
Supply curve is graphical representation of price and quantity demanded of product over
a period. The impact of technology on both demand and supply of that product will be there as
demand will increase and supply will also be increasing. On the macroeconomics and
microeconomics level the production of the product will be increasing and the cost of production
will be decreasing. Market equilibrium and disequilibrium are part of economics and this is also
seen in labor market. Market failure is the point where goods and service are not been efficiently
allocated. Profit maximization is the part of both micro-economics and macroeconomics as this
been the main aim of market and firm. This is the process of long and short term in company
which will be helping them in maximization of profit of firm with the help of increasing price
and output level which is giving the highest return.
10
⊘ This is a preview!⊘
Do you want full access?
Subscribe today to unlock all pages.
Trusted by 1+ million students worldwide
1 out of 24
Related Documents


Your All-in-One AI-Powered Toolkit for Academic Success.
+13062052269
info@desklib.com
Available 24*7 on WhatsApp / Email
![[object Object]](/_next/static/media/star-bottom.7253800d.svg)
Unlock your academic potential
Copyright © 2020–2026 A2Z Services. All Rights Reserved. Developed and managed by ZUCOL.