Economies of Scale and Long Run Total Cost Curve
13 Pages2195 Words254 Views
Added on 2020-05-16
Economies of Scale and Long Run Total Cost Curve
Added on 2020-05-16
ShareRelated Documents
qwertyuiopasdfghjklzxcvbnmqwertyuiopasdfghjklzxcvbnmqwertyuiopasdfghjklzxcvbnmqwertyuiopasdfghjklzxcvbnmqwertyuiopasdfghjklzxcvbnmqwertyuiopasdfghjklzxcvbnmqwertyuiopasdfghjklzxcvbnmqwertyuiopasdfghjklzxcvbnmqwertyuiopasdfghjklzxcvbnmqwertyuiopasdfghjklzxcvbnmqwertyuiopasdfghjklzxcvbnmqwertyuiopasdfghjklzxcvbnmqwertyuiopasdfghjklzxcvbnmqwertyuiopasdfghjklzxcvbnmqwertyuiopasdfghjklzxcvbnmqwertyuiopasdfghjklzxcvbnmqwertyuiopasdfghjklzxcvbnmqwertyuiopasdfghjklzxcvbnmrtyuiopasdfghjklzxcvbnmqwertyuiopasdfghjklzxcvbnmqwertyuiopasdfghjklzxcvbnmqwertyuiopasdfghjklzxcvbnmqwEconomics[Type the document subtitle][Pick the date]Com
ContentsPart A: Micro Economics............................................................................................................................2Part B Macro Economics.............................................................................................................................5Figure 1 Economies of Scale and Long Run Total Cost Curve....................................................................3Figure 2 Determination of Revenue in Oligopoly........................................................................................5Figure 3 Business Cycle: Informal Representation......................................................................................6Figure 4 Short Run and Long Run Aggregate Supply Curves.....................................................................7Figure 5 Components of Aggregate Demand...............................................................................................8Figure 6 Aggregate demand and supply......................................................................................................9
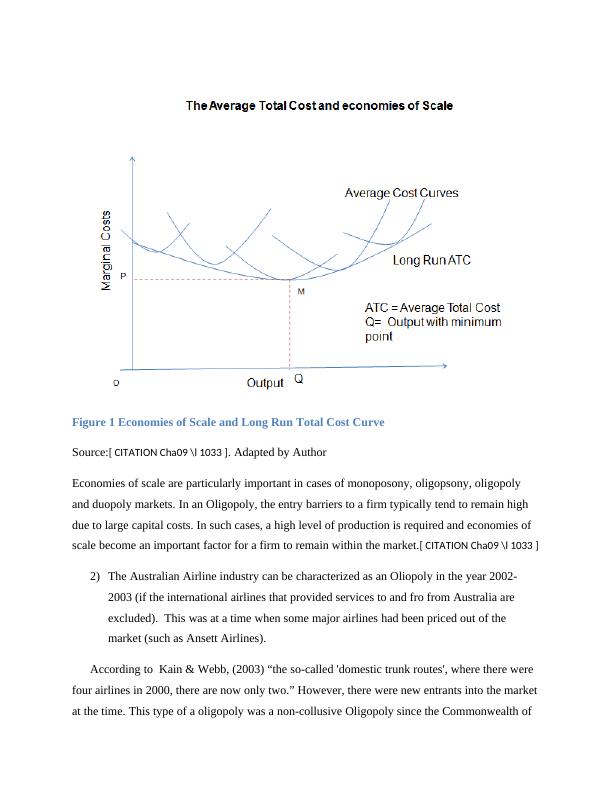
Part A: Micro Economics1)Economies of Scale refers to the advantages accrued by firms as the firms increase the level of production.[ CITATION Cha09 \l 1033 ]For example, in the beginning, the per capitacost for every seat of every airline is high. However, as the number of seats sold increases, the cost per unit or the marginal costs decreases. This is simply due to the fact that the fixed costs of running an air line are high. As the number of seats sold increases, the per fixed costs get divided among a greater number of seats. The variable costs also, vary according to the number of seats.Economies of scale are also achieved due to the costs advantages gained from bulk buying. As a greater number of units are sold, the firm is in position to take advantage of the bulk buyingcosts. As a result, the costs of production can be minimized further. For example, the airline can buy more number of planes and seek discounts. The flight can order more supplies and seek discounted rates. [ CITATION Cha09 \l 1033 ]Economies of scale , in some cases, are also achieved due to specialization. As there is a greater degree of specialization, production become more efficient and losses are minimized. There also, a greater utilization of the capital and labour capacity. For example, if an airline employs a flight stewardess, the flight can employ here on three flights on three different routes in one week instead of just one route twice in a week. This increases the efficiency of the allocation of resources.[ CITATION Cha09 \l 1033 ]In the diagram below, variable cost curves of different output sizes or production level are given. However, in the long run, as the firm keeps increasing the output level, the marginal cost reduces. The Long term Average Total Costs Curve (Fixed Costs + Variable Costs) keep reducing until a minimum floor price is reached. (Marginal Cost cannot be zero). However, thereis a minimum marginal cost of production as the cost of production cannot be reduced completely. This is depicted as point “M” in the diagram below, This is the point where the Marginal cost is minimized. Increasing the output (in this example, the total number of seats) will still lead to higher Marginal costs. This is the point where economies of scale cease to exist.
Figure 1 Economies of Scale and Long Run Total Cost CurveSource:[ CITATION Cha09 \l 1033 ]. Adapted by AuthorEconomies of scale are particularly important in cases of monoposony, oligopsony, oligopoly and duopoly markets. In an Oligopoly, the entry barriers to a firm typically tend to remain high due to large capital costs. In such cases, a high level of production is required and economies of scale become an important factor for a firm to remain within the market.[ CITATION Cha09 \l 1033 ]2)The Australian Airline industry can be characterized as an Oliopoly in the year 2002- 2003 (if the international airlines that provided services to and fro from Australia are excluded). This was at a time when some major airlines had been priced out of the market (such as Ansett Airlines).According to Kain & Webb, (2003) “the so-called 'domestic trunk routes', where there were four airlines in 2000, there are now only two.” However, there were new entrants into the marketat the time. This type of a oligopoly was a non-collusive Oligopoly since the Commonwealth of
End of preview
Want to access all the pages? Upload your documents or become a member.
Related Documents
Assignment Macroeconomic Analysislg...
|11
|2030
|86
Economics Assignment: Economics for Managerslg...
|11
|2038
|177
Micro Economic Analysis September 20 2017lg...
|27
|4727
|272
Economic Analysis of Excise Duty on Cigarettes, Production Costs and Market Structureslg...
|16
|2689
|496
Economies of Scale Assignment helplg...
|9
|2292
|43
Business Economics Assignment (Doc)lg...
|8
|2264
|27