Electrocardiography | Digital Signal Processing
VerifiedAdded on 2022/08/26
|12
|2795
|38
AI Summary
Contribute Materials
Your contribution can guide someone’s learning journey. Share your
documents today.
Running head: DIGITAL SIGNAL PROCESSING
DIGITAL SIGNAL PROCESSING
Name of the Student
Name of the University
Author Note
DIGITAL SIGNAL PROCESSING
Name of the Student
Name of the University
Author Note
Secure Best Marks with AI Grader
Need help grading? Try our AI Grader for instant feedback on your assignments.
Introduction:
Electrocardiography is basically the graphical representation of any electrical activity
in the human heart for a specific period of time. The electrical activity is recorded by the
electrodes which are connected to the human body by either three or twelve leads connected
to skin of the person. The ECG signal is mainly comprised of P wave, QRS complex and T
waves. The P wave is the depolarization effect in the signal and QRS section indicates the
ventricular depolarization, whereas, T wave is the proof of very fast repolarization of
ventricles [6]. Now, in this particular project these waves are generated artificially with
optimized parameters by mathematical functions in MATLAB and then combined to obtain a
similar to real ECG signal [1]. Furthermore, a random noise is added to the signal and the
noisy signal is filtered using an appropriate filter available as built-in function in MATLAB.
Finally, the original real time ECG signal, error added signal and filtered signal is plotted in a
same graph for comparison.
Scope:
The scope of this particular project includes noise removal from ECG signal which is often
the primary concern for many medical researchers. The noises in the ECG signal exists
mainly from five sources which are baseline wander, Power line interference, motion
artefacts, Muscle noise and other interferences. Baseline wander exists varying electrode-skin
impedance which is added to signal in form of low frequency component. The power line
interference occurs when the power supply to the ECG instrument has a power input of
unstable frequency [2]. The motion artefacts are generated by the motions of electrode those
are very much away from the contact region on skin. The frequency of this type of noise is
unpredictable. Muscle noises are common as during ECG recording EMG
(Electromyography) signal is also generated from contractions of skeletal muscles. Other
types of noise that can affect the ECG signal are noise produced by the instrument such as
cables, probes or D/A converters. Now, instead of affecting the generated ECG signal with all
types of noises only one noise namely muscle noise is used to corrupt the signal for simplicity
and ease of filtering. The occurrence of muscle noise is random and thus this can be modelled
using a stochastic process from Gaussian distribution with zero mean and unit standard
deviation [3]. Hence, additive white Gaussian noise is applied to the signal and then it is
filtered using suitable filter and its optimized parameters.
Project design:
Now, at first the ECG signal is generated in MATLAB part by part by generating each
wave of ECG with mathematical approximation. Then each waves are combined to generate
the real time ECG signal for a time period up to 5 seconds.
There are a total of six waves namely p-wave, q-wave, qrs-wave, s-wave and t-wave exist in
the ECG which are approximated by mathematical expressions. Each wave has four
parameters namely the time interval of the wave, coefficient a, coefficient d and coefficient t
and the frequency factor [7]. The parameters of the waves are sensitively chosen to obtain a
signal very similar to ECG signals which are obtained from heart rates in real time from
human body.
Now, after obtaining the real time ECG signal the signal is corrupted with a random white
Gaussian Noise with signal to power ratio of 20. The power of the signal is measured from
the input signal and then the white Gaussian noise is applied to the signal with 80% of the
signal power [10].
Now, after corrupting the original signal with noise a filter is applied to the signal cancel out
the noise in the signal. The filter is chosen in such a way that it’s smoothens the signal
without tampering the key trends in the signal characteristics. Thus the best filter matching
the criterion is chosen to be Savitzky-Golay filter which is also known as polynomial
smoothening filter or the least square smoothening filter [5]. This filter is available in
MATLAB by the function scgolayfilt and thus it is applied with best suited parameters (order
= 3, window size = 9). The filter is suited for the particular noisy ECG signal as the noise in
the signal is large and there are many high frequency components in the ECG signal. Thus for
this type of application scgolayfilt is known to perform better than any standard mean filter or
Gaussian filters as these filters often clears the high frequencies along with the noise which is
undesirable [4]. The Savitzky-Golay filter operates by minimizing the least square error of
the fitted polynomial to data and in this sense this filter an optimal filter and thus often
further optimization of filter parameters are not required [8].
The general filter equation of the Savitzky-Golay is given by,
Y i=(1/W )¿
Here, W = window size or frame length
ai=¿ Coefficients of the filter
n = Order of filter polynomial
xi=¿ ith observed value in the data or input signal
Y i=¿ Filter output of ith smoothened data point
Now, ECG signal is generated, noised and filtered in the MATLAB script ecgcorrection.m as
given in appendix section and the output is given below.
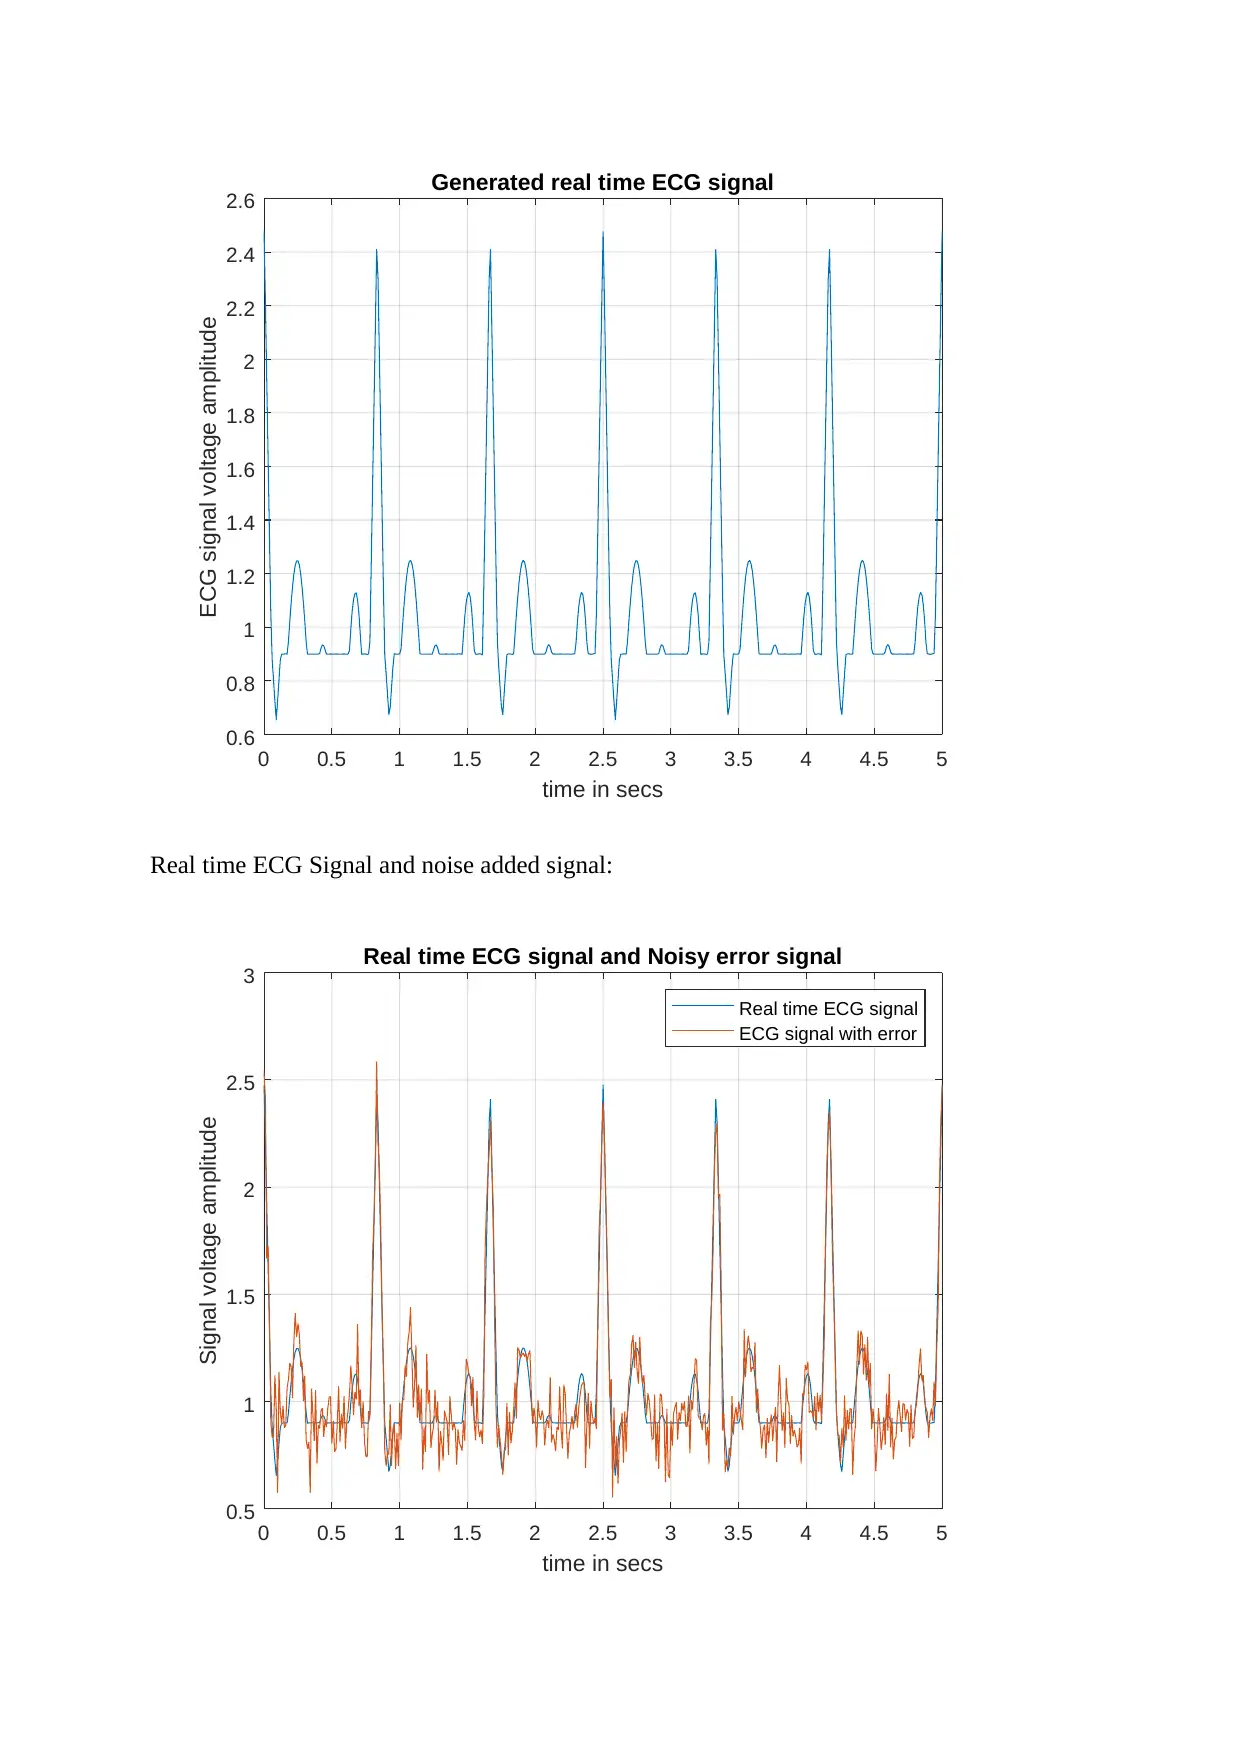
Plot of real time generated ECG signal:
smoothening filter or the least square smoothening filter [5]. This filter is available in
MATLAB by the function scgolayfilt and thus it is applied with best suited parameters (order
= 3, window size = 9). The filter is suited for the particular noisy ECG signal as the noise in
the signal is large and there are many high frequency components in the ECG signal. Thus for
this type of application scgolayfilt is known to perform better than any standard mean filter or
Gaussian filters as these filters often clears the high frequencies along with the noise which is
undesirable [4]. The Savitzky-Golay filter operates by minimizing the least square error of
the fitted polynomial to data and in this sense this filter an optimal filter and thus often
further optimization of filter parameters are not required [8].
The general filter equation of the Savitzky-Golay is given by,
Y i=(1/W )¿
Here, W = window size or frame length
ai=¿ Coefficients of the filter
n = Order of filter polynomial
xi=¿ ith observed value in the data or input signal
Y i=¿ Filter output of ith smoothened data point
Now, ECG signal is generated, noised and filtered in the MATLAB script ecgcorrection.m as
given in appendix section and the output is given below.
Plot of real time generated ECG signal:
Secure Best Marks with AI Grader
Need help grading? Try our AI Grader for instant feedback on your assignments.
0 0.5 1 1.5 2 2.5 3 3.5 4 4.5 5
time in secs
0.6
0.8
1
1.2
1.4
1.6
1.8
2
2.2
2.4
2.6
ECG signal voltage amplitude
Generated real time ECG signal
Real time ECG Signal and noise added signal:
0 0.5 1 1.5 2 2.5 3 3.5 4 4.5 5
time in secs
0.5
1
1.5
2
2.5
3
Signal voltage amplitude
Real time ECG signal and Noisy error signal
Real time ECG signal
ECG signal with error
time in secs
0.6
0.8
1
1.2
1.4
1.6
1.8
2
2.2
2.4
2.6
ECG signal voltage amplitude
Generated real time ECG signal
Real time ECG Signal and noise added signal:
0 0.5 1 1.5 2 2.5 3 3.5 4 4.5 5
time in secs
0.5
1
1.5
2
2.5
3
Signal voltage amplitude
Real time ECG signal and Noisy error signal
Real time ECG signal
ECG signal with error
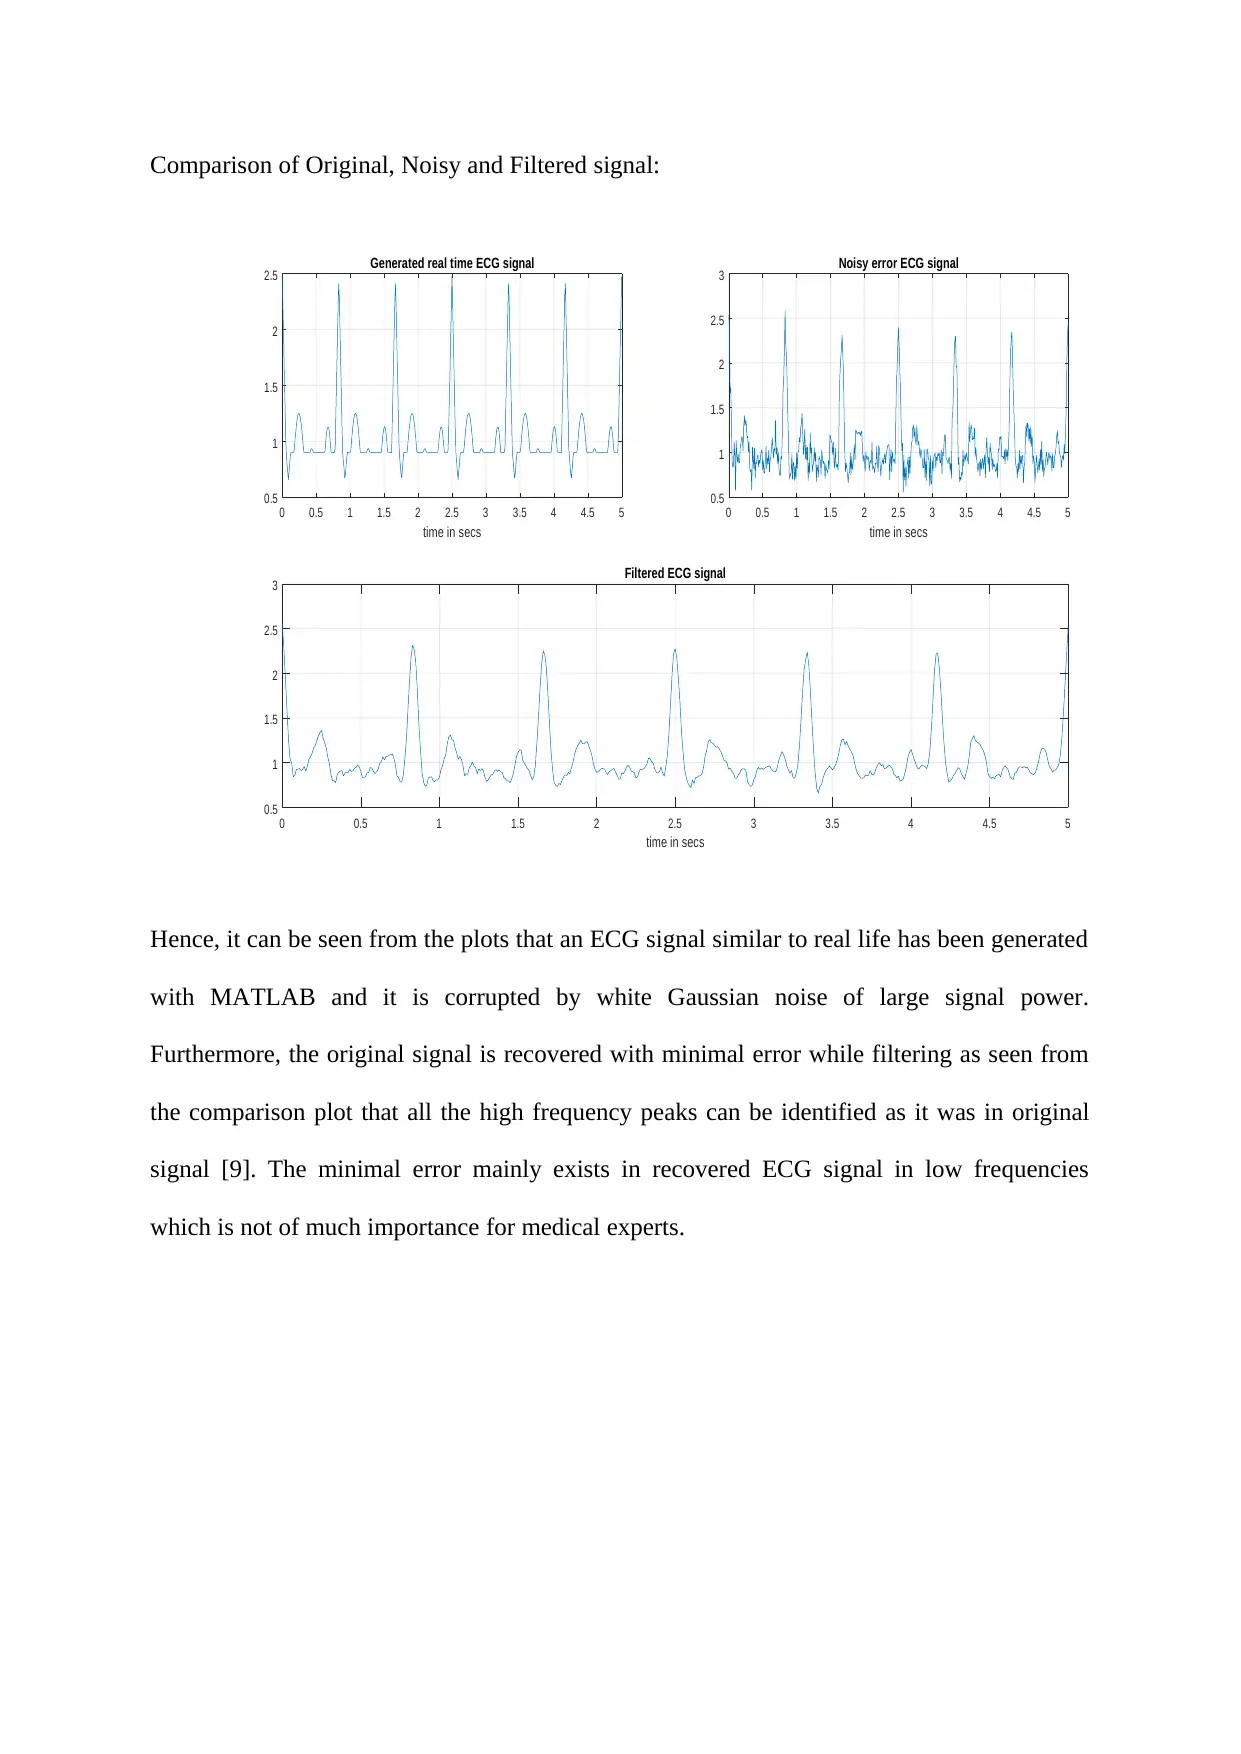
Comparison of Original, Noisy and Filtered signal:
0 0.5 1 1.5 2 2.5 3 3.5 4 4.5 5
time in secs
0.5
1
1.5
2
2.5 Generated real time ECG signal
0 0.5 1 1.5 2 2.5 3 3.5 4 4.5 5
time in secs
0.5
1
1.5
2
2.5
3 Noisy error ECG signal
0 0.5 1 1.5 2 2.5 3 3.5 4 4.5 5
time in secs
0.5
1
1.5
2
2.5
3 Filtered ECG signal
Hence, it can be seen from the plots that an ECG signal similar to real life has been generated
with MATLAB and it is corrupted by white Gaussian noise of large signal power.
Furthermore, the original signal is recovered with minimal error while filtering as seen from
the comparison plot that all the high frequency peaks can be identified as it was in original
signal [9]. The minimal error mainly exists in recovered ECG signal in low frequencies
which is not of much importance for medical experts.
0 0.5 1 1.5 2 2.5 3 3.5 4 4.5 5
time in secs
0.5
1
1.5
2
2.5 Generated real time ECG signal
0 0.5 1 1.5 2 2.5 3 3.5 4 4.5 5
time in secs
0.5
1
1.5
2
2.5
3 Noisy error ECG signal
0 0.5 1 1.5 2 2.5 3 3.5 4 4.5 5
time in secs
0.5
1
1.5
2
2.5
3 Filtered ECG signal
Hence, it can be seen from the plots that an ECG signal similar to real life has been generated
with MATLAB and it is corrupted by white Gaussian noise of large signal power.
Furthermore, the original signal is recovered with minimal error while filtering as seen from
the comparison plot that all the high frequency peaks can be identified as it was in original
signal [9]. The minimal error mainly exists in recovered ECG signal in low frequencies
which is not of much importance for medical experts.

Conclusion and future direction:
Thus in conclusion it can be stated that the objective of the project is successfully met
as a real time ECG signal is generated in MATLAB with similar peaks and lower frequency
characteristics matching with real life ECG signals. Furthermore, the signal is corrupted by a
muscle noise modelled by additive white Gaussian noise low signal to noise ratio. In spite of
that the original signal characteristics are approximately recovered using an optimized
Savitzky-Golay filter as evident by the comparison of plots. The research suggests that SC-
Golay filter is an appropriate filter to remove ECG signal with higher amount of muscle noise
and thus further improvement in the filtering algorithm can be done for improved results in
future. However, it must be noted that the ECG signal here is corrupted with only one type of
noise (muscle noise), but in the real cases the signal can be corrupted with multiple type of
noise with varying proportion and in that case number of filters for obtaining a good output
can increase with increase of time complexity of the filtering algorithm.
Paraphrase This Document
Need a fresh take? Get an instant paraphrase of this document with our AI Paraphraser
References:
[1]S. Apte, Random Signal Processing.
[2]G. Peng, A non-contact, low-noise electrocardiogram sensor ASIC employing motion
artifact reduction. Rochester, N.Y.: University of Rochester, 2014.
[3]L. Tan and J. Jiang, Digital signal processing. Amsterdam: Elsevier/Academic Press,
2013.
[4]F. Samann and T. Schanze, "An efficient ECG Denoising method using Discrete Wavelet
with Savitzky-Golay filter", Current Directions in Biomedical Engineering, vol. 5, no. 1, pp.
385-387, 2019. Available: 10.1515/cdbme-2019-0097.
[5]F. Sadıkoglu and C. Kavalcıoğlu, "Filtering Continuous Glucose Monitoring Signal Using
Savitzky-Golay Filter and Simple Multivariate Thresholding", Procedia Computer Science,
vol. 102, pp. 342-350, 2016. Available: 10.1016/j.procs.2016.09.410.
[6]J. Madeiro, Developments and applications for ECG signal processing.
[7]M. Gothwal, "ECG Signal Conditioning", Journal of Medical Science And clinical
Research, 2016. Available: 10.18535/jmscr/v4i1.10.
[8]U. Satija, B. Ramkumar and M. Sabarimalai Manikandan, "Noise-aware dictionary-
learning-based sparse representation framework for detection and removal of single and
combined noises from ECG signal", Healthcare Technology Letters, vol. 4, no. 1, pp. 2-12,
2017. Available: 10.1049/htl.2016.0077.
[9]M. Sheikh-Hosseini and G. Hodtani, "On the capacity of additive white mixture Gaussian
noise channels", Transactions on Emerging Telecommunications Technologies, vol. 30, no. 7,
p. e3585, 2019. Available: 10.1002/ett.3585.

[10]"NOISE REDUCTION TECHNIQUES IN ECG USING DIFFERENT
METHODS", International Journal of Modern Trends in Engineering & Research, vol. 4, no.
8, pp. 209-216, 2017. Available: 10.21884/ijmter.2017.4273.rjypn.
METHODS", International Journal of Modern Trends in Engineering & Research, vol. 4, no.
8, pp. 209-216, 2017. Available: 10.21884/ijmter.2017.4273.rjypn.
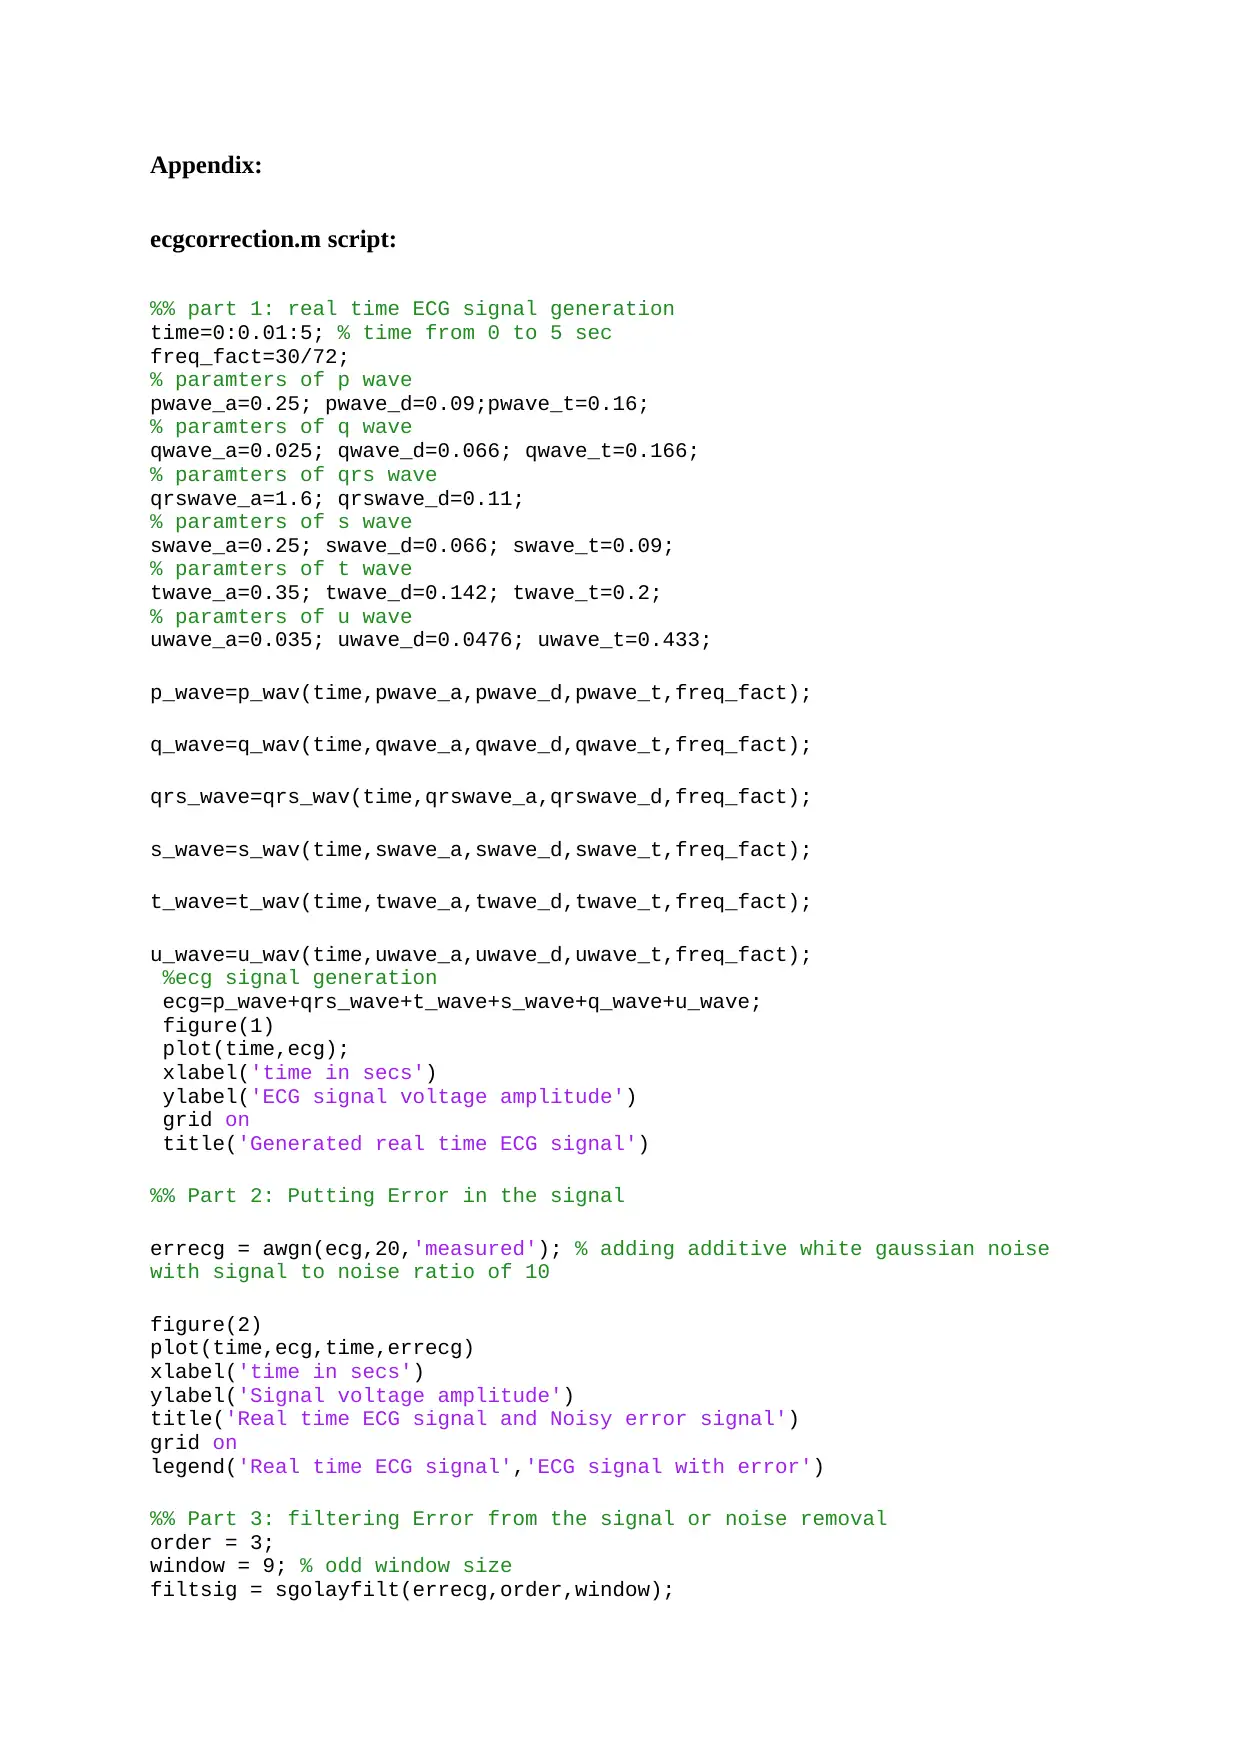
Appendix:
ecgcorrection.m script:
%% part 1: real time ECG signal generation
time=0:0.01:5; % time from 0 to 5 sec
freq_fact=30/72;
% paramters of p wave
pwave_a=0.25; pwave_d=0.09;pwave_t=0.16;
% paramters of q wave
qwave_a=0.025; qwave_d=0.066; qwave_t=0.166;
% paramters of qrs wave
qrswave_a=1.6; qrswave_d=0.11;
% paramters of s wave
swave_a=0.25; swave_d=0.066; swave_t=0.09;
% paramters of t wave
twave_a=0.35; twave_d=0.142; twave_t=0.2;
% paramters of u wave
uwave_a=0.035; uwave_d=0.0476; uwave_t=0.433;
p_wave=p_wav(time,pwave_a,pwave_d,pwave_t,freq_fact);
q_wave=q_wav(time,qwave_a,qwave_d,qwave_t,freq_fact);
qrs_wave=qrs_wav(time,qrswave_a,qrswave_d,freq_fact);
s_wave=s_wav(time,swave_a,swave_d,swave_t,freq_fact);
t_wave=t_wav(time,twave_a,twave_d,twave_t,freq_fact);
u_wave=u_wav(time,uwave_a,uwave_d,uwave_t,freq_fact);
%ecg signal generation
ecg=p_wave+qrs_wave+t_wave+s_wave+q_wave+u_wave;
figure(1)
plot(time,ecg);
xlabel('time in secs')
ylabel('ECG signal voltage amplitude')
grid on
title('Generated real time ECG signal')
%% Part 2: Putting Error in the signal
errecg = awgn(ecg,20,'measured'); % adding additive white gaussian noise
with signal to noise ratio of 10
figure(2)
plot(time,ecg,time,errecg)
xlabel('time in secs')
ylabel('Signal voltage amplitude')
title('Real time ECG signal and Noisy error signal')
grid on
legend('Real time ECG signal','ECG signal with error')
%% Part 3: filtering Error from the signal or noise removal
order = 3;
window = 9; % odd window size
filtsig = sgolayfilt(errecg,order,window);
Secure Best Marks with AI Grader
Need help grading? Try our AI Grader for instant feedback on your assignments.
figure(3)
subplot(2,2,1)
plot(time,ecg)
xlabel('time in secs')
title('Generated real time ECG signal')
grid on
subplot(2,2,2)
plot(time,errecg)
xlabel('time in secs')
title('Noisy error ECG signal')
grid on
subplot(2,2,[3,4])
plot(time,filtsig)
xlabel('time in secs')
title('Filtered ECG signal')
grid on
%% generating Different waves function of ECG signal
% generating p wave
function [pwave]=p_wav(x,a_pwav,d_pwav,t_pwav,li)
l=li;
a=a_pwav;
x=x+t_pwav;
b=(2*l)/d_pwav;
n=100;
p1=1/l;
p2=0;
for i = 1:n
harm1=(((sin((pi/(2*b))*(b-(2*i))))/(b-(2*i))+(sin((pi/(2*b))*(b+(2*i))))/
(b+(2*i)))*(2/pi))*cos((i*pi*x)/l);
p2=p2+harm1;
end
pwav1=p1+p2;
pwave=a*pwav1;
end
% generation of qrs wave
function [qrswave]=qrs_wav(x,a_qrswav,d_qrswav,li)
l=li;
a=a_qrswav;
b=(2*l)/d_qrswav;
n=100;
qrs1=(a/(2*b))*(2-b);
qrs2=0;
for i = 1:n
harm=(((2*b*a)/(i*i*pi*pi))*(1-cos((i*pi)/b)))*cos((i*pi*x)/l);
qrs2=qrs2+harm;
end
qrswave=qrs1+qrs2;
end
% generation of q wave
function [qwave]=q_wav(x,a_qwav,d_qwav,t_qwav,li)
l=li;
x=x+t_qwav;
a=a_qwav;
b=(2*l)/d_qwav;
n=100;
q1=(a/(2*b))*(2-b);
q2=0;
for i = 1:n
harm5=(((2*b*a)/(i*i*pi*pi))*(1-cos((i*pi)/b)))*cos((i*pi*x)/l);
q2=q2+harm5;
end
qwave=-1*(q1+q2);
end
% genearting s wave
function [swave]=s_wav(x,a_swav,d_swav,t_swav,li)
l=li;
x=x-t_swav;
a=a_swav;
b=(2*l)/d_swav;
n=100;
s1=(a/(2*b))*(2-b);
s2=0;
for i = 1:n
harm3=(((2*b*a)/(i*i*pi*pi))*(1-cos((i*pi)/b)))*cos((i*pi*x)/l);
s2=s2+harm3;
end
swave=-1*(s1+s2);
end
% t wave generation
function [twave]=t_wav(x,a_twav,d_twav,t_twav,li)
l=li;
a=a_twav;
x=x-t_twav-0.045;
b=(2*l)/d_twav;
n=100;
t1=1/l;
t2=0;
for i = 1:n
harm2=(((sin((pi/(2*b))*(b-(2*i))))/(b-(2*i))+(sin((pi/(2*b))*(b+(2*i))))/
(b+(2*i)))*(2/pi))*cos((i*pi*x)/l);
t2=t2+harm2;
end
twav1=t1+t2;
twave=a*twav1;
end
% u wave generation
function [uwave]=u_wav(x,a_uwav,d_uwav,t_uwav,li)
l=li;
a=a_uwav;
x=x-t_uwav;
b=(2*l)/d_uwav;
n=100;
u1=1/l;
u2=0;
for i = 1:n
harm4=(((sin((pi/(2*b))*(b-(2*i))))/(b-(2*i))+(sin((pi/(2*b))*(b+(2*i))))/
(b+(2*i)))*(2/pi))*cos((i*pi*x)/l);
u2=u2+harm4;
end
1 out of 12


Your All-in-One AI-Powered Toolkit for Academic Success.
+13062052269
info@desklib.com
Available 24*7 on WhatsApp / Email
![[object Object]](/_next/static/media/star-bottom.7253800d.svg)
Unlock your academic potential
© 2024 | Zucol Services PVT LTD | All rights reserved.