Elementary Statistics: Data Analysis, Probability, and Interpretation
VerifiedAdded on 2023/01/13
|16
|1958
|32
Homework Assignment
AI Summary
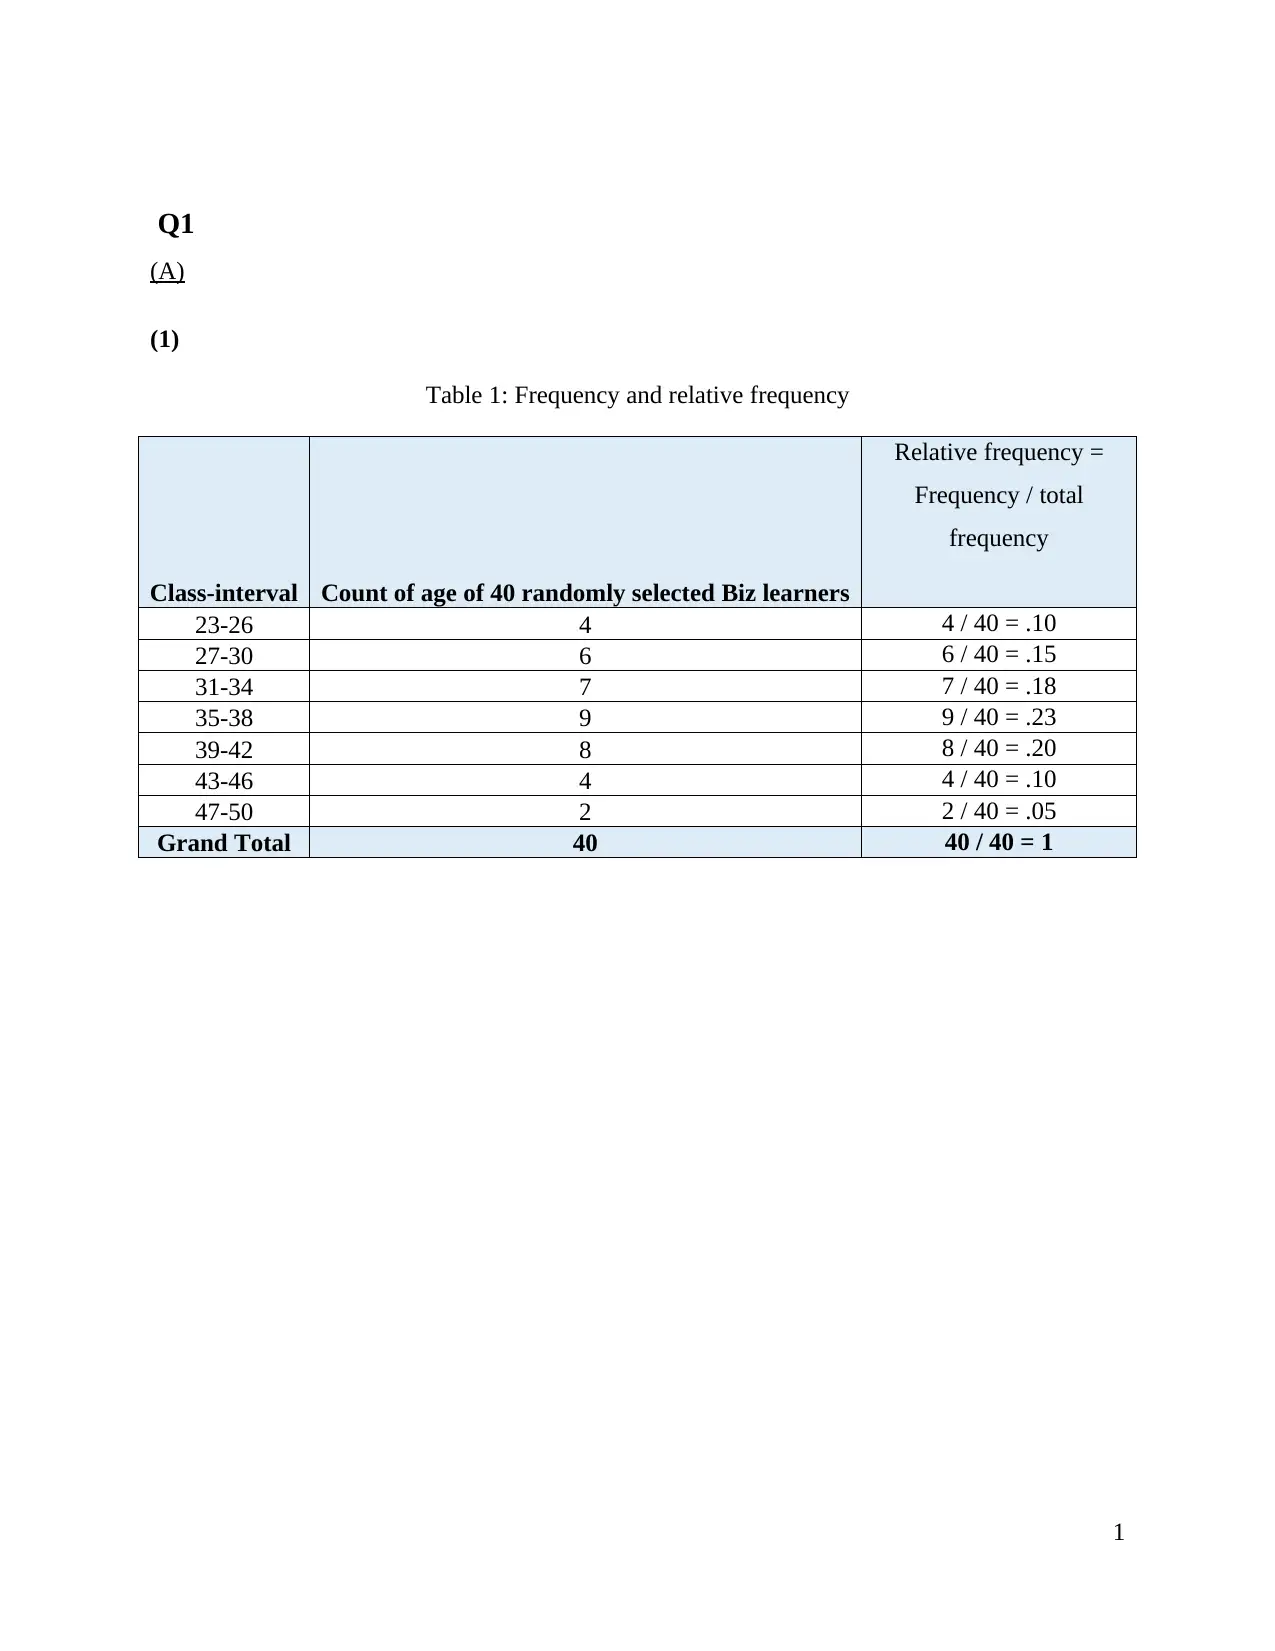
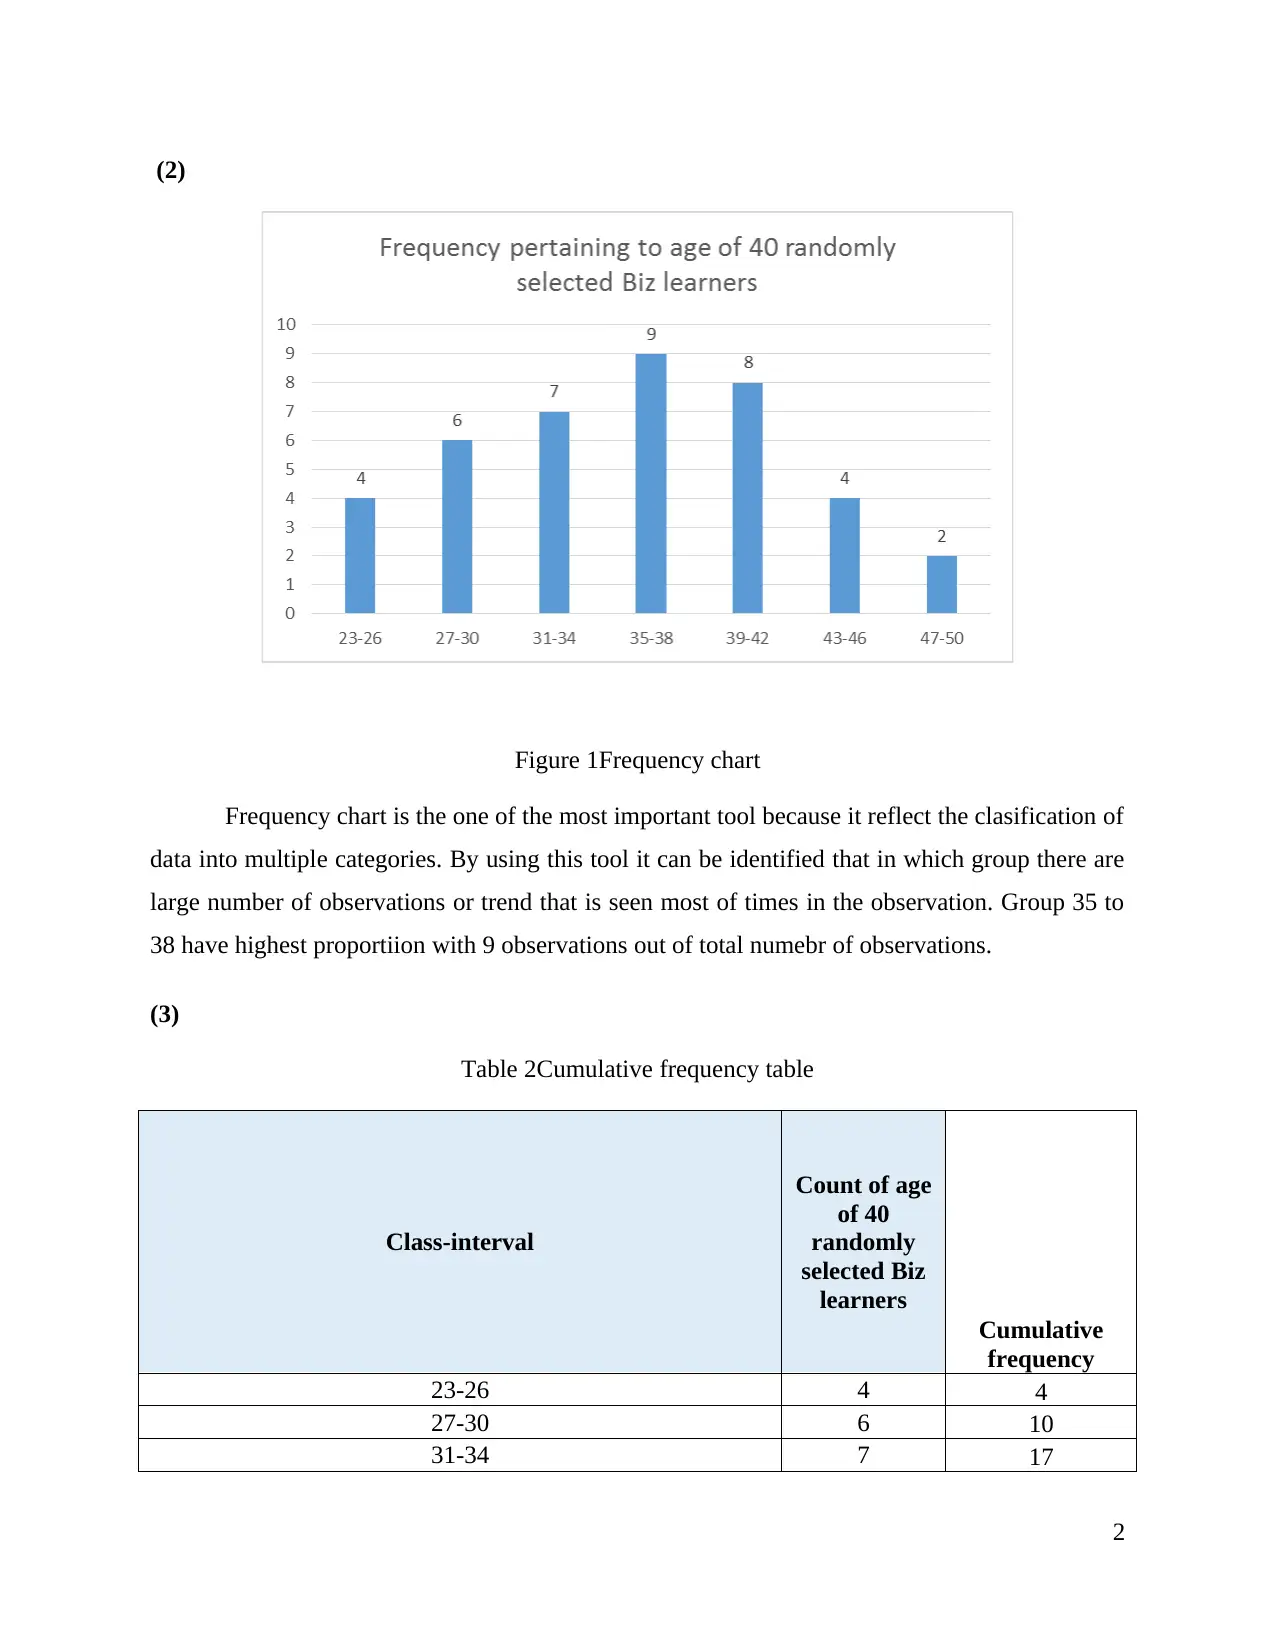
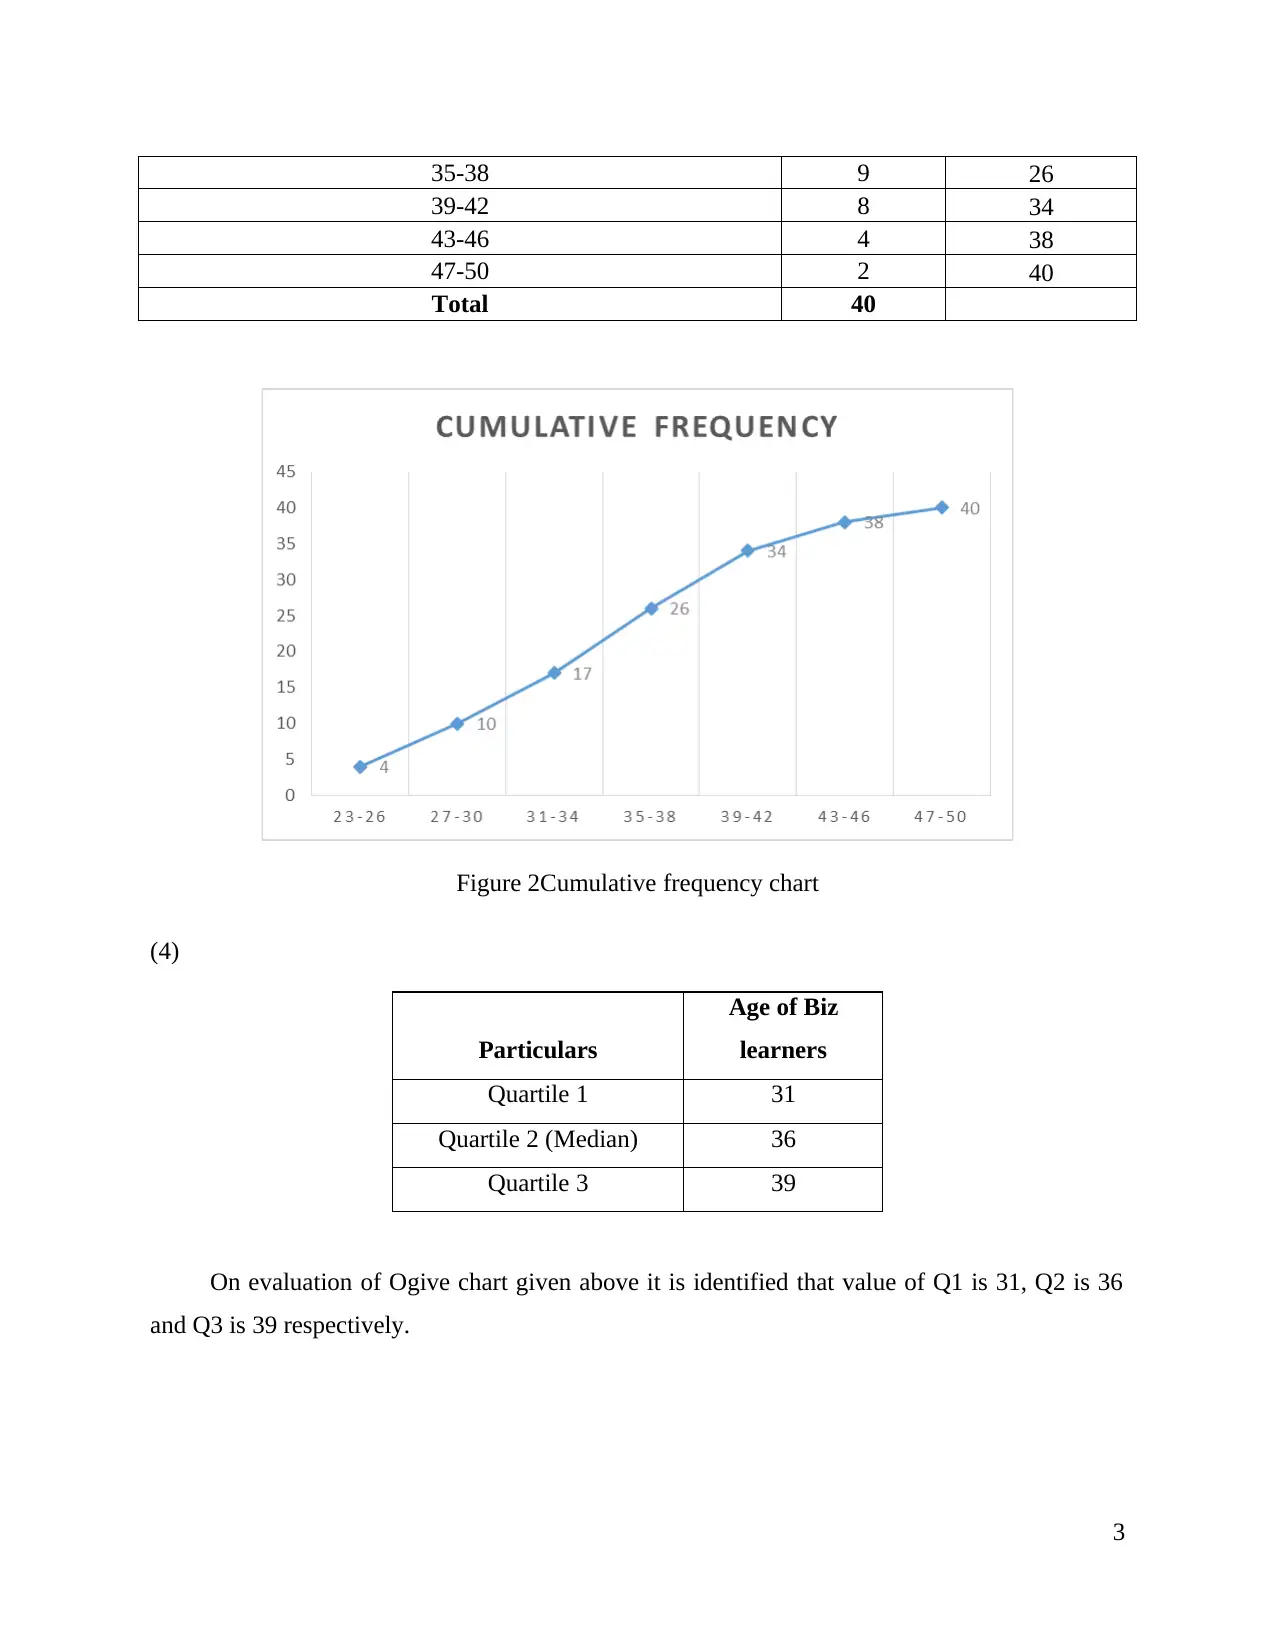
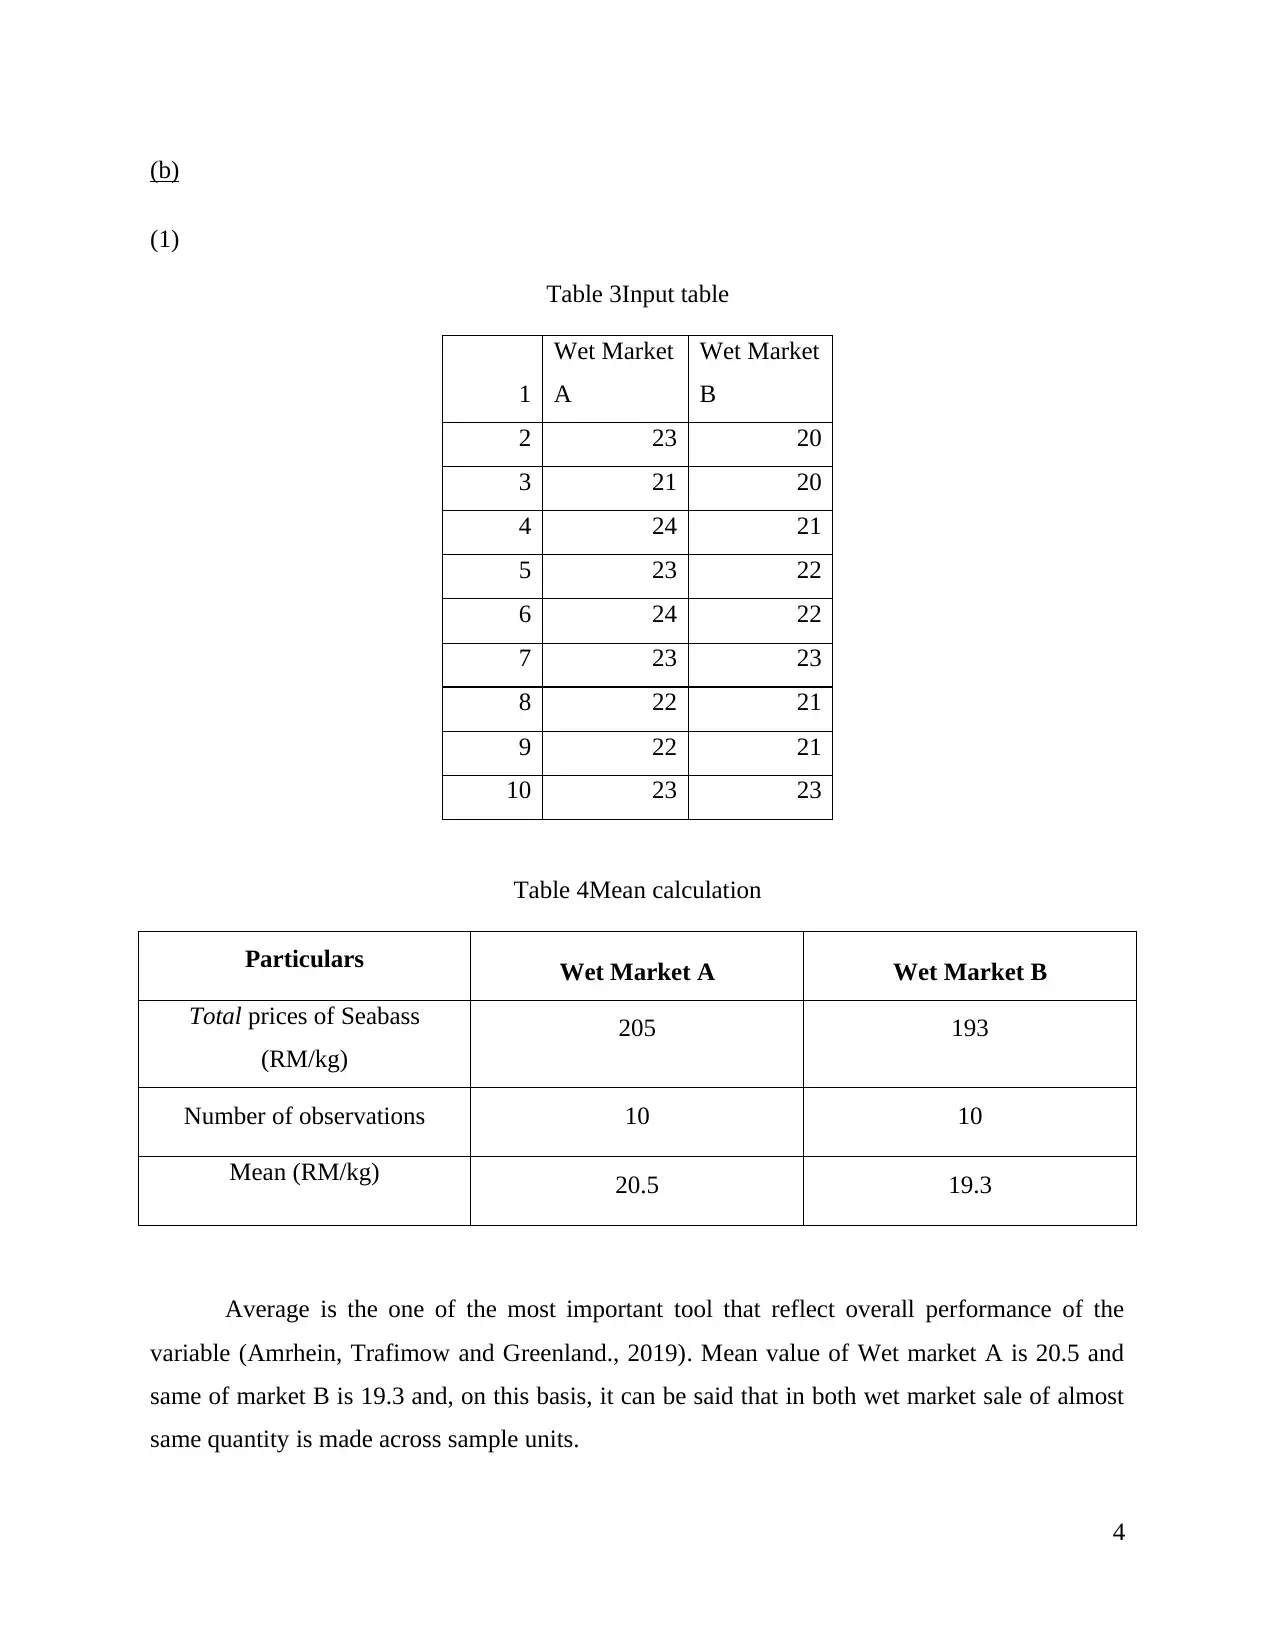
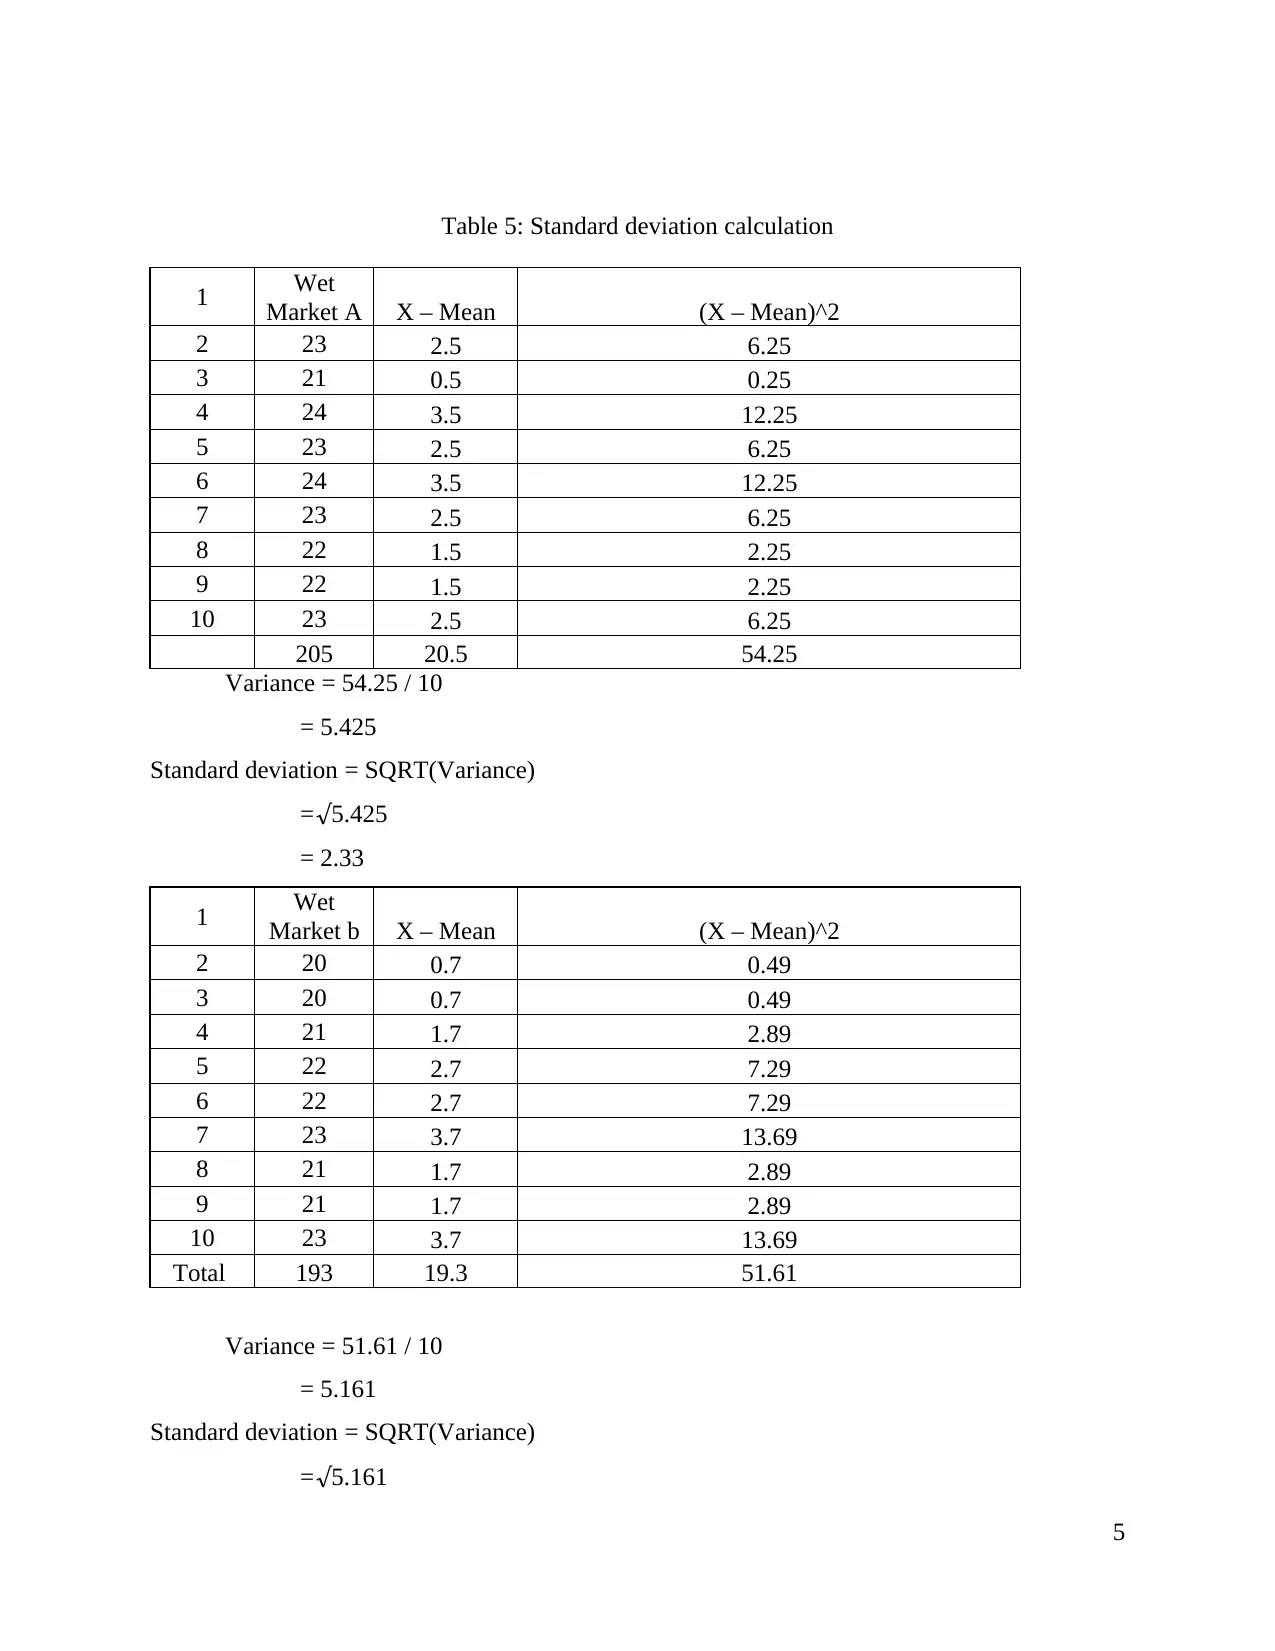
This document provides a detailed solution to an elementary statistics assignment. The assignment covers various statistical concepts, including frequency distribution, mean, mode, median, and standard deviation calculations. It explores data analysis through tables and charts, such as frequency charts and cumulative frequency charts. The solution also includes calculations of the coefficient of variation and analysis of probability through interpreting loyalty test results. The document is well-structured, providing step-by-step calculations and interpretations, making it a valuable resource for students studying statistics. It provides a good understanding of descriptive statistics, probability and data interpretation.
1 out of 16
Related Documents


Your All-in-One AI-Powered Toolkit for Academic Success.
+13062052269
info@desklib.com
Available 24*7 on WhatsApp / Email
![[object Object]](/_next/static/media/star-bottom.7253800d.svg)
Copyright © 2020–2026 A2Z Services. All Rights Reserved. Developed and managed by ZUCOL.