Elementary Statistics Assignment (SBST1303): Detailed Solutions
VerifiedAdded on 2023/06/09
|11
|1136
|206
Homework Assignment
AI Summary
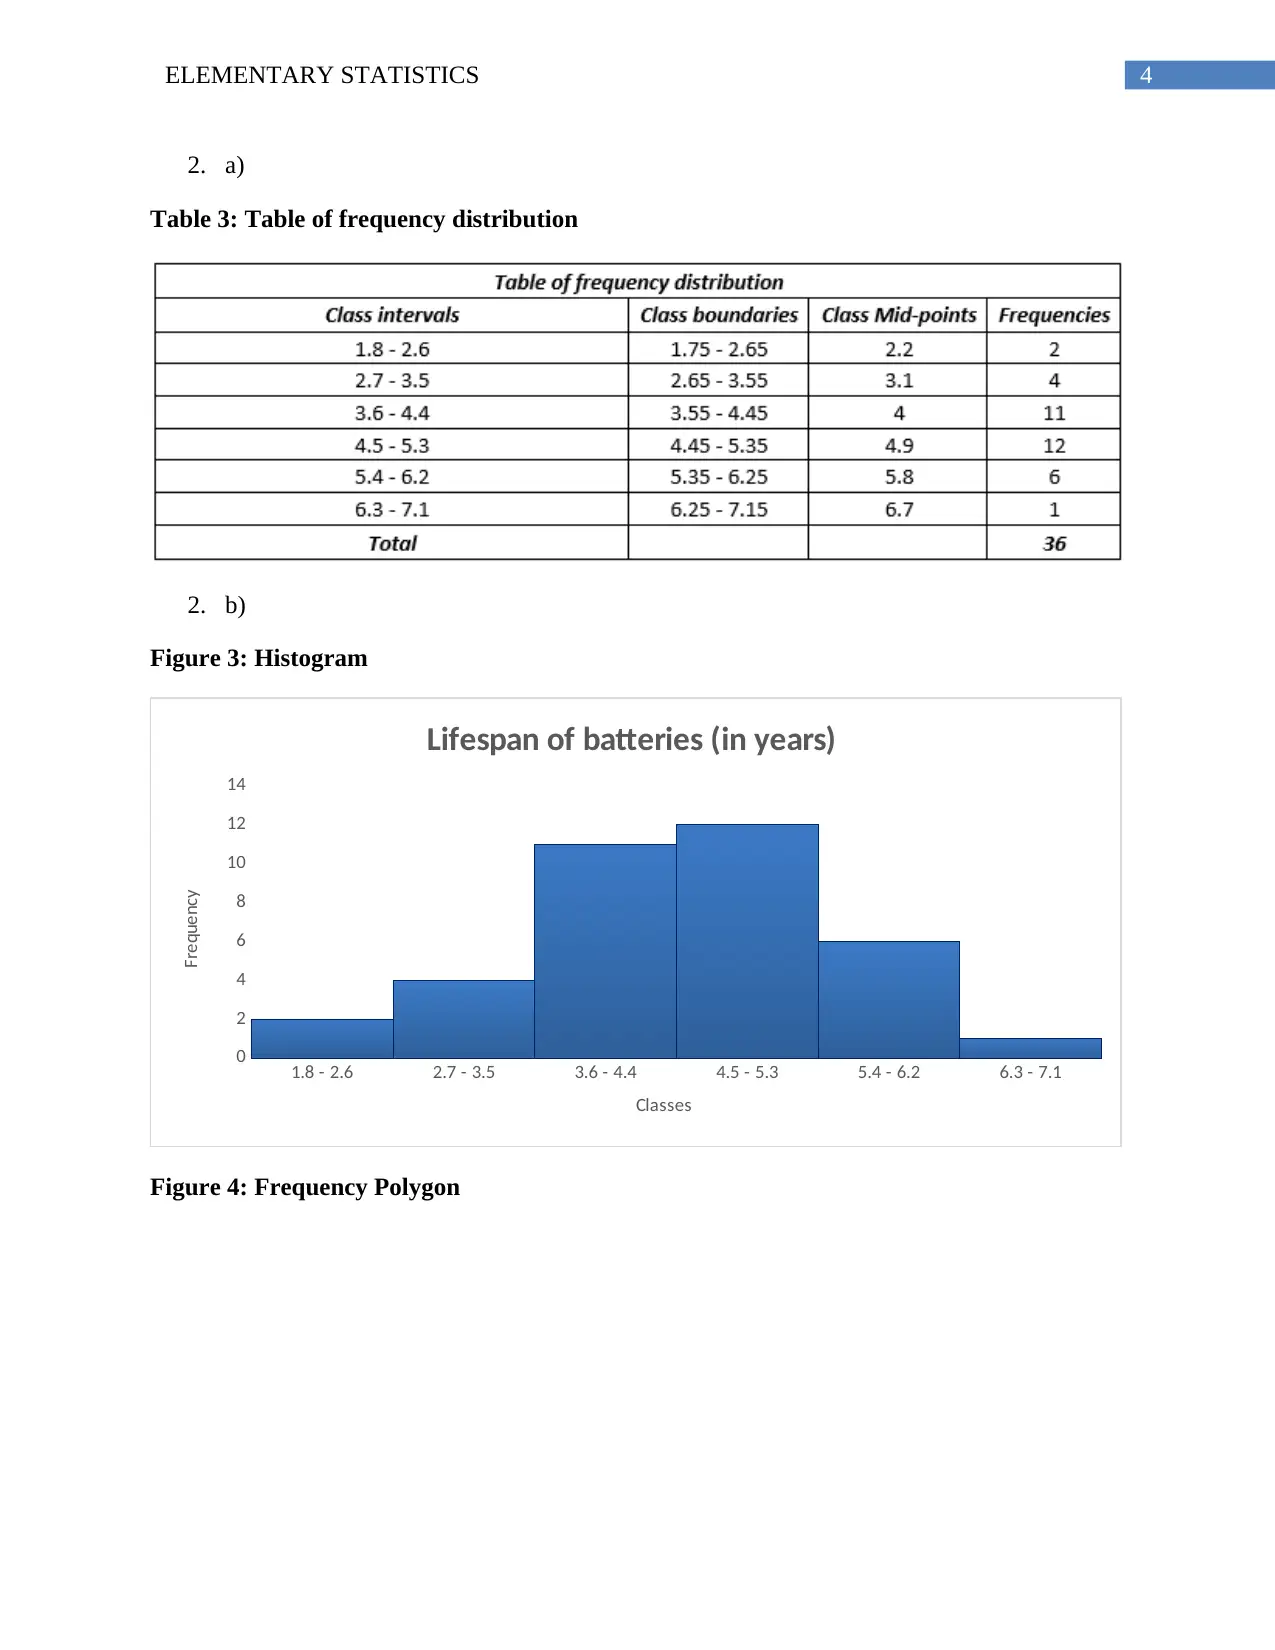
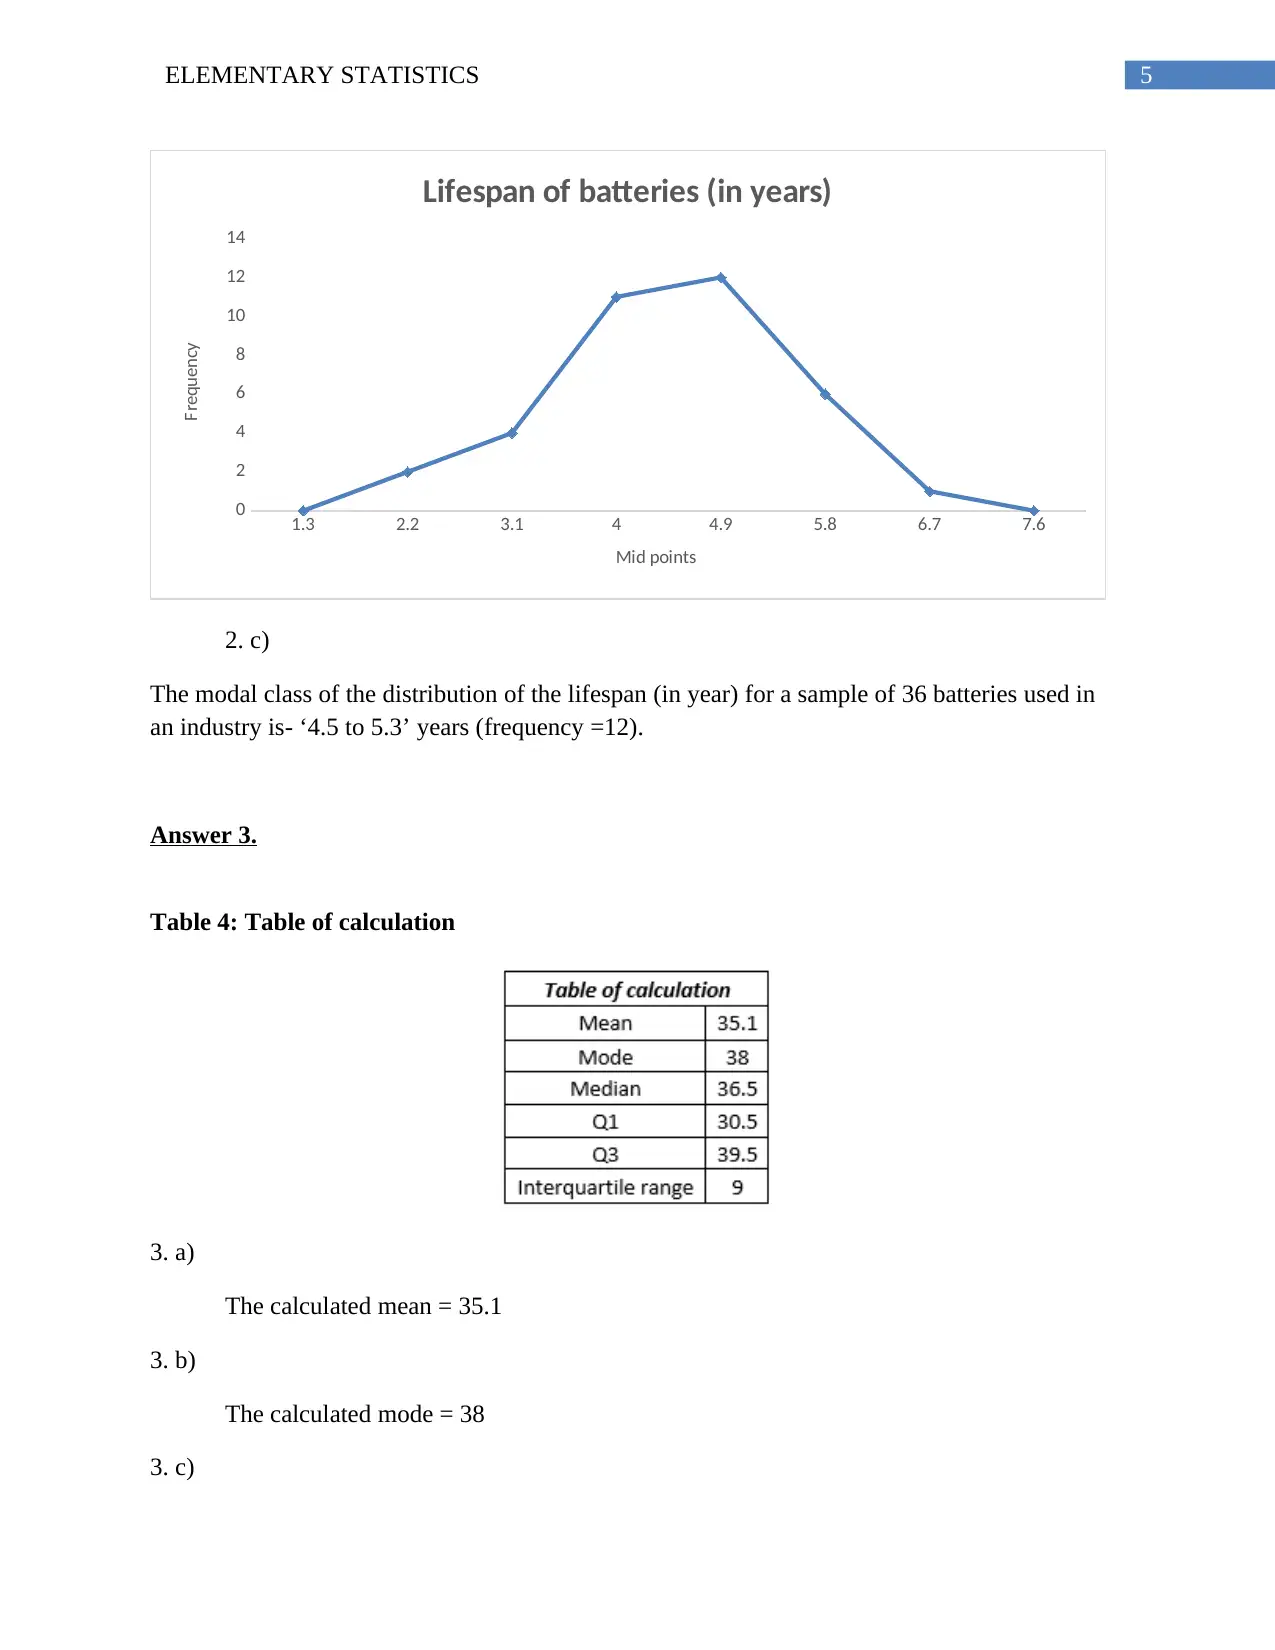
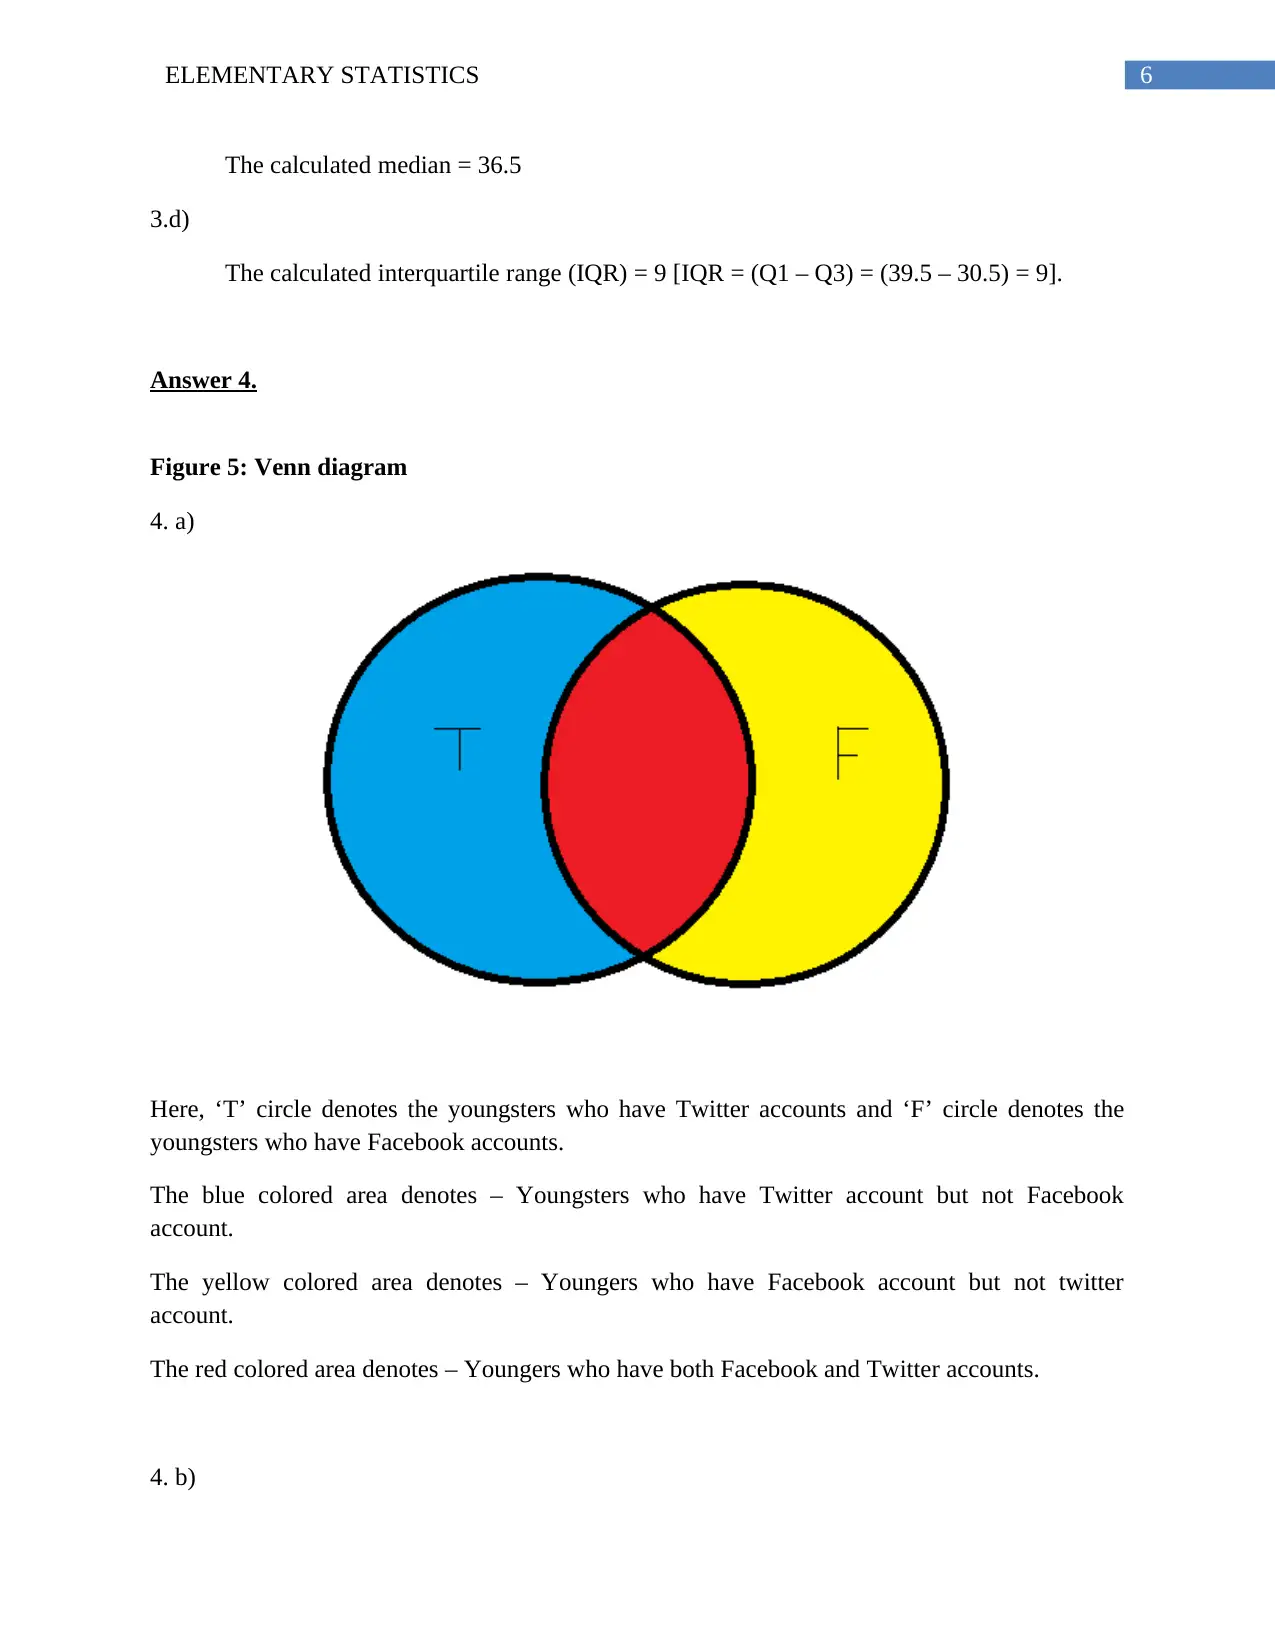
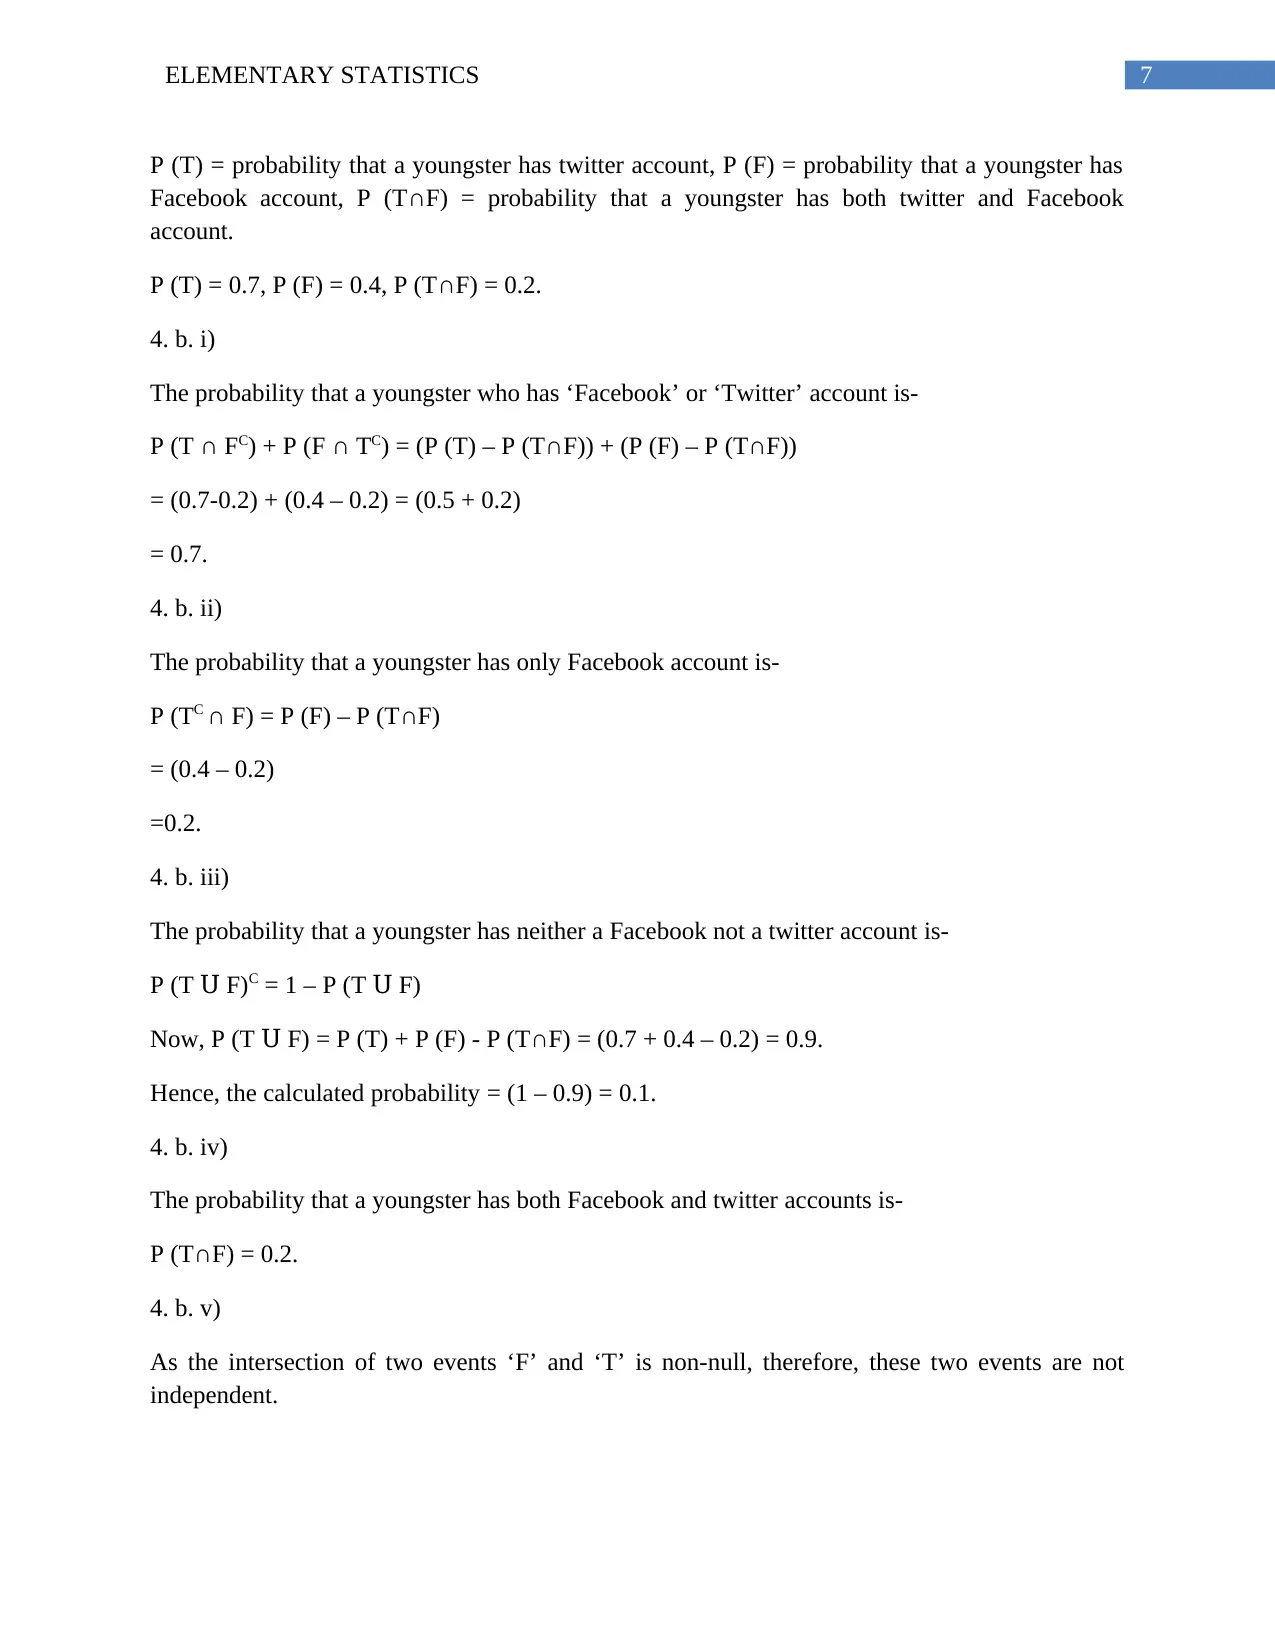
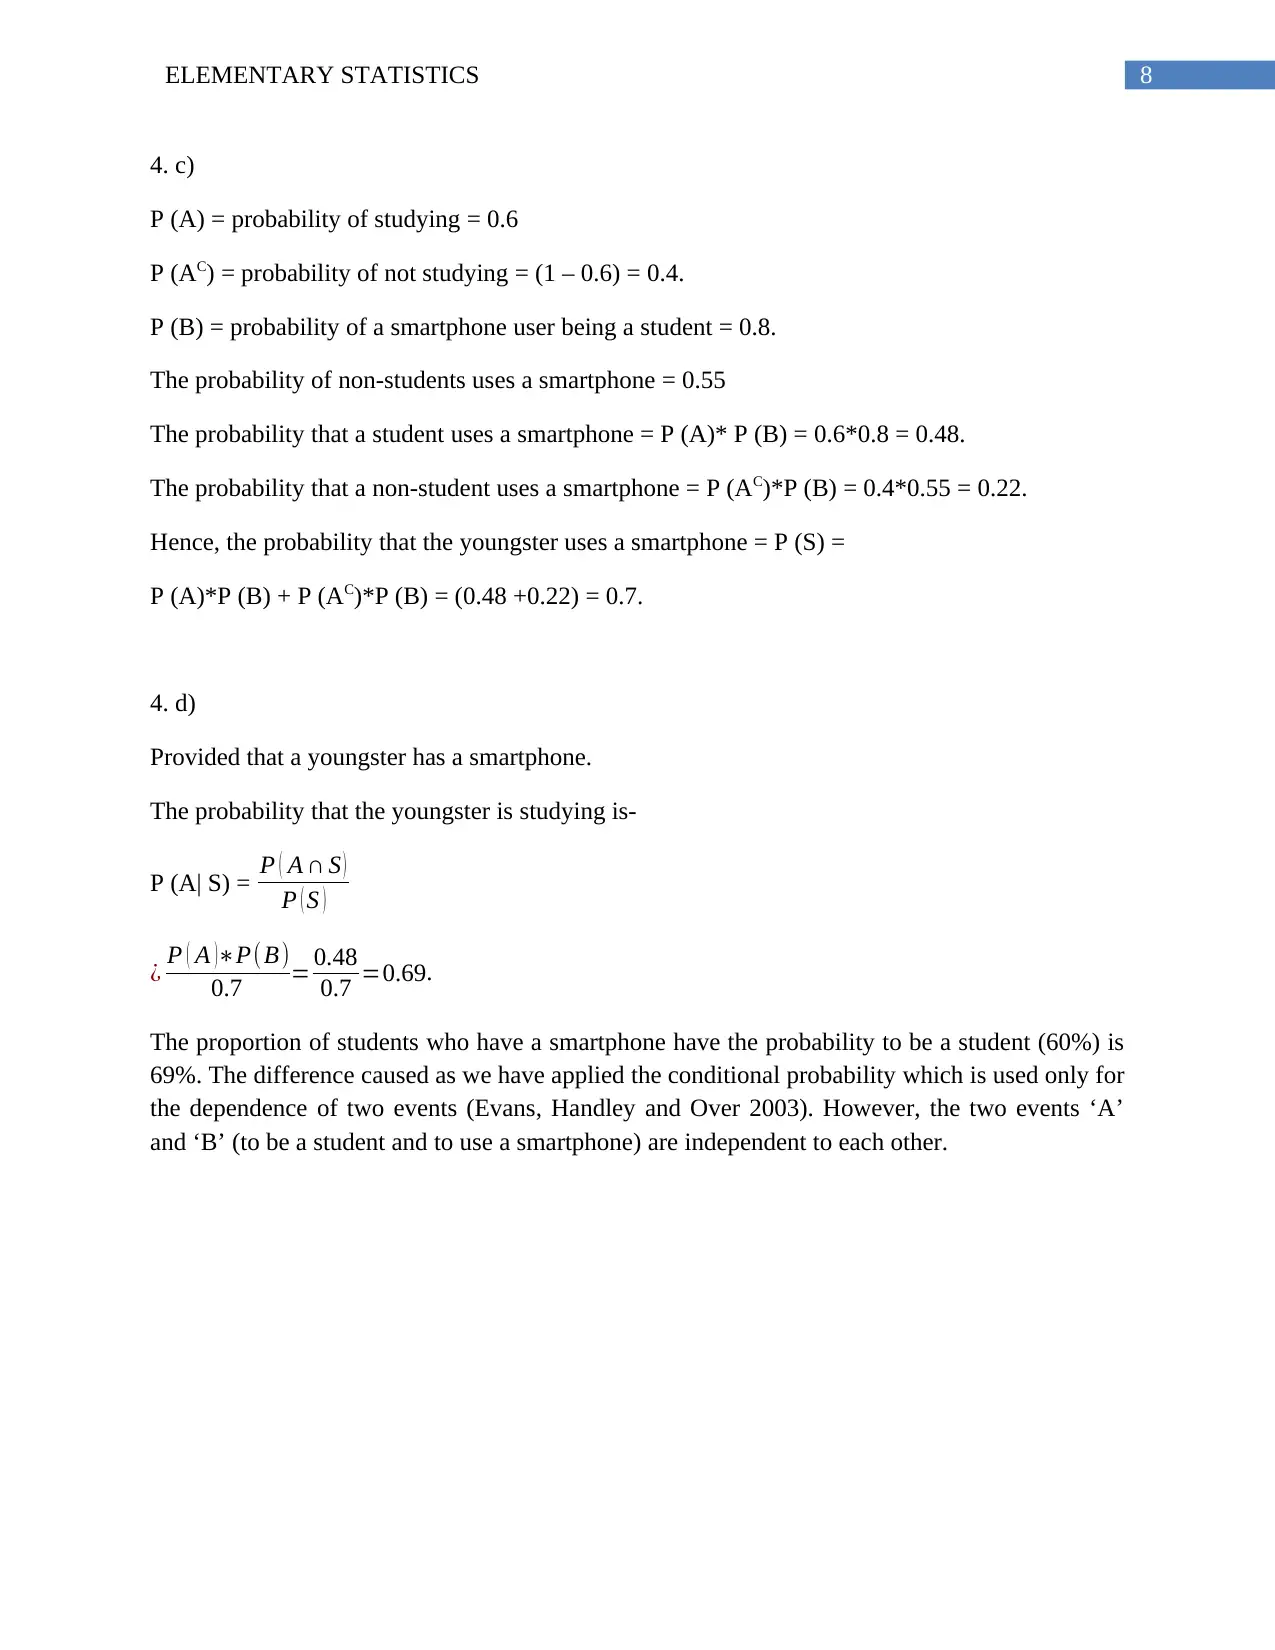
This document presents a comprehensive solution to an elementary statistics assignment. The assignment covers a range of topics, including data representation through tables and charts (pie charts, bar charts, histograms, and frequency polygons), and calculations of key statistical measures. The solutions include frequency distributions, calculations of mean, mode, median, and interquartile range. Furthermore, the assignment explores probability concepts using Venn diagrams and conditional probability, addressing scenarios related to Facebook and Twitter usage among youngsters, and smartphone usage among students. The document provides detailed explanations and calculations for each question, along with relevant references.

Running Head: ELEMENTARY STATISTICS
Elementary Statistics
Name of the student:
Name of the university:
Course ID:
Elementary Statistics
Name of the student:
Name of the university:
Course ID:
Paraphrase This Document
Need a fresh take? Get an instant paraphrase of this document with our AI Paraphraser

ELEMENTARY STATISTICS 1
Table of Contents
Answers:..........................................................................................................................................2
Answer 1......................................................................................................................................2
Answer 2......................................................................................................................................3
Answer 3......................................................................................................................................5
Answer 4......................................................................................................................................6
References:......................................................................................................................................9
References:....................................................................................................................................10

2ELEMENTARY STATISTICS
Answers:
Answer 1.
1. a)
Table 1: Summary table of fields chosen
1. b)
Table 2: Percentages and sectarian angles of fields chosen
1. c)
Figure 1: Pie chart of fields chosen
Answers:
Answer 1.
1. a)
Table 1: Summary table of fields chosen
1. b)
Table 2: Percentages and sectarian angles of fields chosen
1. c)
Figure 1: Pie chart of fields chosen
⊘ This is a preview!⊘
Do you want full access?
Subscribe today to unlock all pages.

Trusted by 1+ million students worldwide

3ELEMENTARY STATISTICS
Architecture (A)
8%
Business (B)
20%
Communication (C)
16%
Engineering (E)
22%
Foundation (F)
20%
IT (I)
14%
Sector wise School leavers
Architecture (A) Business (B) Communication (C)
Engineering (E) Foundation (F) IT (I)
1. d)
Figure 2: Bar chart of fields chosen
Architecture (A) Business (B) Communication
(C) Engineering (E) Foundation (F) IT (I)
0
5
10
15
20
25
8
20
16
22
20
14
Sector wise School leavers
Sectors
Percentages
Answer 2.
Paraphrase This Document
Need a fresh take? Get an instant paraphrase of this document with our AI Paraphraser

4ELEMENTARY STATISTICS
2. a)
Table 3: Table of frequency distribution
2. b)
Figure 3: Histogram
1.8 - 2.6 2.7 - 3.5 3.6 - 4.4 4.5 - 5.3 5.4 - 6.2 6.3 - 7.1
0
2
4
6
8
10
12
14
Lifespan of batteries (in years)
Classes
Frequency
Figure 4: Frequency Polygon
2. a)
Table 3: Table of frequency distribution
2. b)
Figure 3: Histogram
1.8 - 2.6 2.7 - 3.5 3.6 - 4.4 4.5 - 5.3 5.4 - 6.2 6.3 - 7.1
0
2
4
6
8
10
12
14
Lifespan of batteries (in years)
Classes
Frequency
Figure 4: Frequency Polygon

5ELEMENTARY STATISTICS
1.3 2.2 3.1 4 4.9 5.8 6.7 7.6
0
2
4
6
8
10
12
14
Lifespan of batteries (in years)
Mid points
Frequency
2. c)
The modal class of the distribution of the lifespan (in year) for a sample of 36 batteries used in
an industry is- ‘4.5 to 5.3’ years (frequency =12).
Answer 3.
Table 4: Table of calculation
3. a)
The calculated mean = 35.1
3. b)
The calculated mode = 38
3. c)
⊘ This is a preview!⊘
Do you want full access?
Subscribe today to unlock all pages.

Trusted by 1+ million students worldwide

6ELEMENTARY STATISTICS
The calculated median = 36.5
3.d)
The calculated interquartile range (IQR) = 9 [IQR = (Q1 – Q3) = (39.5 – 30.5) = 9].
Answer 4.
Figure 5: Venn diagram
4. a)
Here, ‘T’ circle denotes the youngsters who have Twitter accounts and ‘F’ circle denotes the
youngsters who have Facebook accounts.
The blue colored area denotes – Youngsters who have Twitter account but not Facebook
account.
The yellow colored area denotes – Youngers who have Facebook account but not twitter
account.
The red colored area denotes – Youngers who have both Facebook and Twitter accounts.
4. b)
Paraphrase This Document
Need a fresh take? Get an instant paraphrase of this document with our AI Paraphraser

7ELEMENTARY STATISTICS
P (T) = probability that a youngster has twitter account, P (F) = probability that a youngster has
Facebook account, P (T∩F) = probability that a youngster has both twitter and Facebook
account.
P (T) = 0.7, P (F) = 0.4, P (T∩F) = 0.2.
4. b. i)
The probability that a youngster who has ‘Facebook’ or ‘Twitter’ account is-
P (T ∩ FC) + P (F ∩ TC) = (P (T) – P (T∩F)) + (P (F) – P (T∩F))
= (0.7-0.2) + (0.4 – 0.2) = (0.5 + 0.2)
= 0.7.
4. b. ii)
The probability that a youngster has only Facebook account is-
P (TC ∩ F) = P (F) – P (T∩F)
= (0.4 – 0.2)
=0.2.
4. b. iii)
The probability that a youngster has neither a Facebook not a twitter account is-
P (T F)Ս C = 1 – P (T F)Ս
Now, P (T F) =Ս P (T) + P (F) - P (T∩F) = (0.7 + 0.4 – 0.2) = 0.9.
Hence, the calculated probability = (1 – 0.9) = 0.1.
4. b. iv)
The probability that a youngster has both Facebook and twitter accounts is-
P (T∩F) = 0.2.
4. b. v)
As the intersection of two events ‘F’ and ‘T’ is non-null, therefore, these two events are not
independent.

8ELEMENTARY STATISTICS
4. c)
P (A) = probability of studying = 0.6
P (AC) = probability of not studying = (1 – 0.6) = 0.4.
P (B) = probability of a smartphone user being a student = 0.8.
The probability of non-students uses a smartphone = 0.55
The probability that a student uses a smartphone = P (A)* P (B) = 0.6*0.8 = 0.48.
The probability that a non-student uses a smartphone = P (AC)*P (B) = 0.4*0.55 = 0.22.
Hence, the probability that the youngster uses a smartphone = P (S) =
P (A)*P (B) + P (AC)*P (B) = (0.48 +0.22) = 0.7.
4. d)
Provided that a youngster has a smartphone.
The probability that the youngster is studying is-
P (A| S) = P ( A ∩ S )
P ( S )
¿ P ( A )∗P(B)
0.7 = 0.48
0.7 =0.69.
The proportion of students who have a smartphone have the probability to be a student (60%) is
69%. The difference caused as we have applied the conditional probability which is used only for
the dependence of two events (Evans, Handley and Over 2003). However, the two events ‘A’
and ‘B’ (to be a student and to use a smartphone) are independent to each other.
⊘ This is a preview!⊘
Do you want full access?
Subscribe today to unlock all pages.

Trusted by 1+ million students worldwide

9ELEMENTARY STATISTICS
References:
Evans, J.S.B., Handley, S.J. and Over, D.E., 2003. Conditionals and conditional
probability. Journal of Experimental Psychology: Learning, Memory, and Cognition, 29(2),
p.321.
References:
Evans, J.S.B., Handley, S.J. and Over, D.E., 2003. Conditionals and conditional
probability. Journal of Experimental Psychology: Learning, Memory, and Cognition, 29(2),
p.321.
Paraphrase This Document
Need a fresh take? Get an instant paraphrase of this document with our AI Paraphraser

10ELEMENTARY STATISTICS
1 out of 11
Related Documents
Your All-in-One AI-Powered Toolkit for Academic Success.
+13062052269
info@desklib.com
Available 24*7 on WhatsApp / Email
Unlock your academic potential
Copyright © 2020–2025 A2Z Services. All Rights Reserved. Developed and managed by ZUCOL.


