ELISA Practical: Determining Gluten Content in Bread Extracts
VerifiedAdded on 2023/04/12
|8
|3000
|155
AI Summary
Learn how to determine the gluten content in bread extracts using ELISA in this practical guide. Understand the importance of gliadin and its impact on gluten intolerance. Find out the different types of ELISA and how to prepare a standard curve. Get step-by-step instructions on conducting the experiment and calculating the concentration of gliadin in unknown samples. Discover the percent depletion of gluten in different bread extracts and classify them as 'gluten-free', 'low gluten', or 'high gluten'.
Contribute Materials
Your contribution can guide someone’s learning journey. Share your
documents today.
ELISA practical
INTRODUCTION:-
Gluten, a protein found in wheat, is a compound consisting of mixture of two
main proteins glutelin and prolamin. The prolamin part, named as gliadin, is
comprised of glutamine and proline rich peptides. Gliadin has been documented
to have a major role in gluten intolerance (Sapone et al. 2012). These peptides
not only induce autoimmunity in gluten intolerant individuals, but may also have
an impact on individuals who are tolerant to gluten (Biesiekierski et al. 2011).
The gut micro biota interacts with immune system and host metabolism and
governs the parameters influencing metabolic diseases (Tremaroli and Backhed
2012) (Wang and Jia 2016). Studies have shown that several bacteria residing in
the human gut are able to digest gluten (Caminero et al. 2016). Specifically it is
the strains of Lactobacillus and Bifidobacterium that have been reported to
inactivate gliadin peptides, thereby neutralising gliadin-mediated reactions on
permeability (Haupt-Jorgensen et al. 2016), inflammation (Laparra and Sanz
2010) and cell agglutination (Hansen et al. 2014). Therefore several important
factors of host physiology may get influenced by the change in the composition
and activity of gut micro biota, induced by gliadin consumption. Concentrations
of these peptides in different food and biological samples are measured using
several methods, the most common of which is enzymatic immunoassay
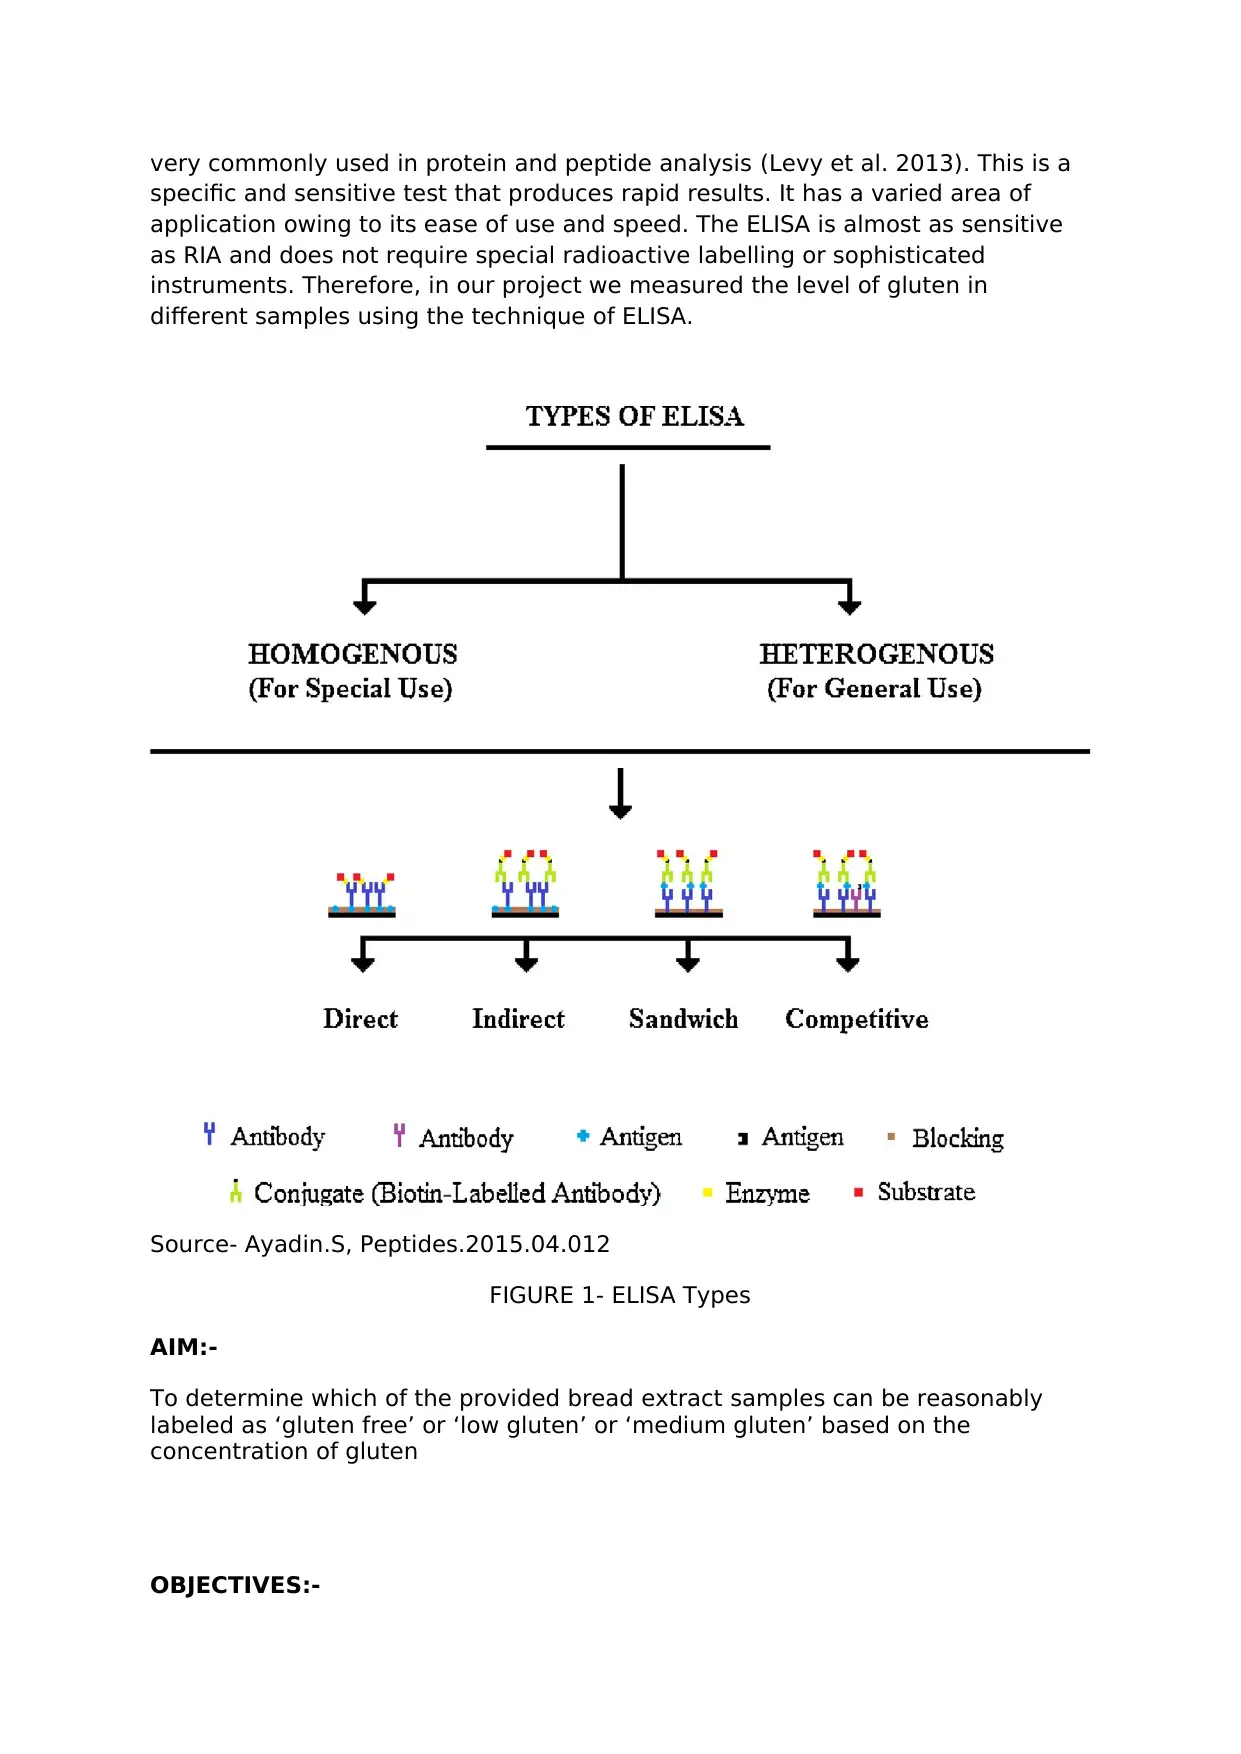
EIA/ELISA. There are different types of ELISA as mentioned in Figure 1.
Techniques where enzymes are engaged to show antigen–antibody reactions are
referred as enzymatic immunoassay EIA/ELISA. Very low concentration molecules
such as proteins/peptides, vitamins, drugs and hormones exhibit a high level of
specificity against antibodies developed in response to them (Watanabe et al.
2013). In simple words, when we have the known antigen which is specific to a
certain substance, we can estimate the type and amount of its antibody and
when we have the known antibody, we can detect the antigen specific to it and
the amount of antigen. Thus, this method can be exploited to estimate even
substances at a very low concentration. The antigen employed in the ELISA is
coated to a solid phase. Microplates and tubes made of rigid polypropylene,
polyvinyl and polystyrene are used as the solid phase. The microplates and tubes
must be able to adsorb the antibody and the antigen (Aydin 2015). The enzymes
that can be employed in ELISA include beta glucose oxidase, galactosidase,
alkaline phosphatase, and peroxidase. P-nitro-phenyl phosphate act as substrate
for alkaline phosphatase and the production of a yellow color is considered as a
positive reaction.5 amino salicylic acid and orthophenylenediamine are used as
the substrates for the peroxidase conjugate for the production of a brown color.
For galactosidase, the fluorometer must be used to read the sample. The
catabolic property of enzymes converts the specificity and the acceleration of
the immunological response during the enzyme-substrate reaction to a
measurable form (Engvall 2010). The reaction can be stopped using sodium
hydroxide, hydrochloric acid or sulphuric acid. The results are read at 400–600
nm on a spectrophotometer depending on the different colors that develop
based on the substrate used. In recent years, the technique of ELISA has been
Secure Best Marks with AI Grader
Need help grading? Try our AI Grader for instant feedback on your assignments.
very commonly used in protein and peptide analysis (Levy et al. 2013). This is a
specific and sensitive test that produces rapid results. It has a varied area of
application owing to its ease of use and speed. The ELISA is almost as sensitive
as RIA and does not require special radioactive labelling or sophisticated
instruments. Therefore, in our project we measured the level of gluten in
different samples using the technique of ELISA.
Source- Ayadin.S, Peptides.2015.04.012
FIGURE 1- ELISA Types
AIM:-
To determine which of the provided bread extract samples can be reasonably
labeled as ‘gluten free’ or ‘low gluten’ or ‘medium gluten’ based on the
concentration of gluten
OBJECTIVES:-
A) To determine and plot an standard curve of gliadin from standard samples
containing known concentrations of gliadin by ELISA
B) To detect and calculate the concentration of gliadin in ‘unknown’ samples
from standard curve of gliadin by ELISA
C) To determine percent depletion of gluten in ‘unknown’ samples relative to
wheat bread sample served as positive control
METHOD:-
A 96-well plastic microtitre plate was coated in duplicate by pipeting 100ul of
50mM carbonate-bicarbonate buffer, pH 9.6 containing either gliadin standard
protein or unknown bread extracts or known bread extracts as positive controls.
Some wells were coated only with the 100ul carbonate coating buffer which
served as negative controls. Gliadin standard was half diluted as required
starting from 100ug/ml concentration of first well. Five unknown bread extract
samples were evaluated. The microtitre plate was sealed with an adhesive film
lid and incubated overnight at 4°degree for immobilising the protein on solid
surface. The microtitre plate was emptied by inverting and ‘flicking’ over the
sink, dried on tissues and filled with wash buffer containing PBS + 0.05% Tween
20 as mild detergent. The microtitre plate was washed four times and then
blocked with 2% BSA in PBS. The blocking of nonspecific proteins was done by
incubating the microtitre plate at room temperature for one hour. The mirotiter
plate was washed and ensured to be completely empty and dry. Rabbit anti-
gliadin HRP-labelled antibody diluted in blocking buffer was added by pipeting
100ul of diluted antibody in each well and was incubated at room temperature
for one hour. Plate was washed seven times and ensured to be completely empty
and dry. 100μl of TMB substrate was pipetted as quickly as possible without
compromising the accuracy and to maintain the uniformity in the rate of color
development. The microtiter plate was incubated at room temperature varying
between 3-10 minutes. Reaction was stopped by pipetting 100μl of stop reagent
(2M H2SO4). The absorbance of the wells was read on a microtitre plate reader at
450nm and at 405nm for overdeveloped plate.
RESULT:-
Gliadin is the main protein of gluten responsible for the inflammatory response in
the intestinal part of digestive tract which is indicated by the conditions like
villous atrophy and chronic inflammatory infiltrate. Gliadin is the primary cause
of intestinal disorders in gluten intolerant individuals (Zhang et al. 2017). Level
of gliadin in different extracts of food sample can be determined by applying a
biochemistry immunoassay known as ELISA. Here, in this project ELISA has been
employed to quantitatively determine the level of gliadin in five unknown
extracts of bread relative to the known concentration of gliadin. An ELISA
standard curve has been prepared from standard samples containing known
concentrations of gliadin to determine and calculate the exact concentration of
gliadin in ‘unknown’ samples from the standard curve along with percent
depletion in the level of the gliadin in unknown samples relative to the wheat
bread extract sample as positive control.
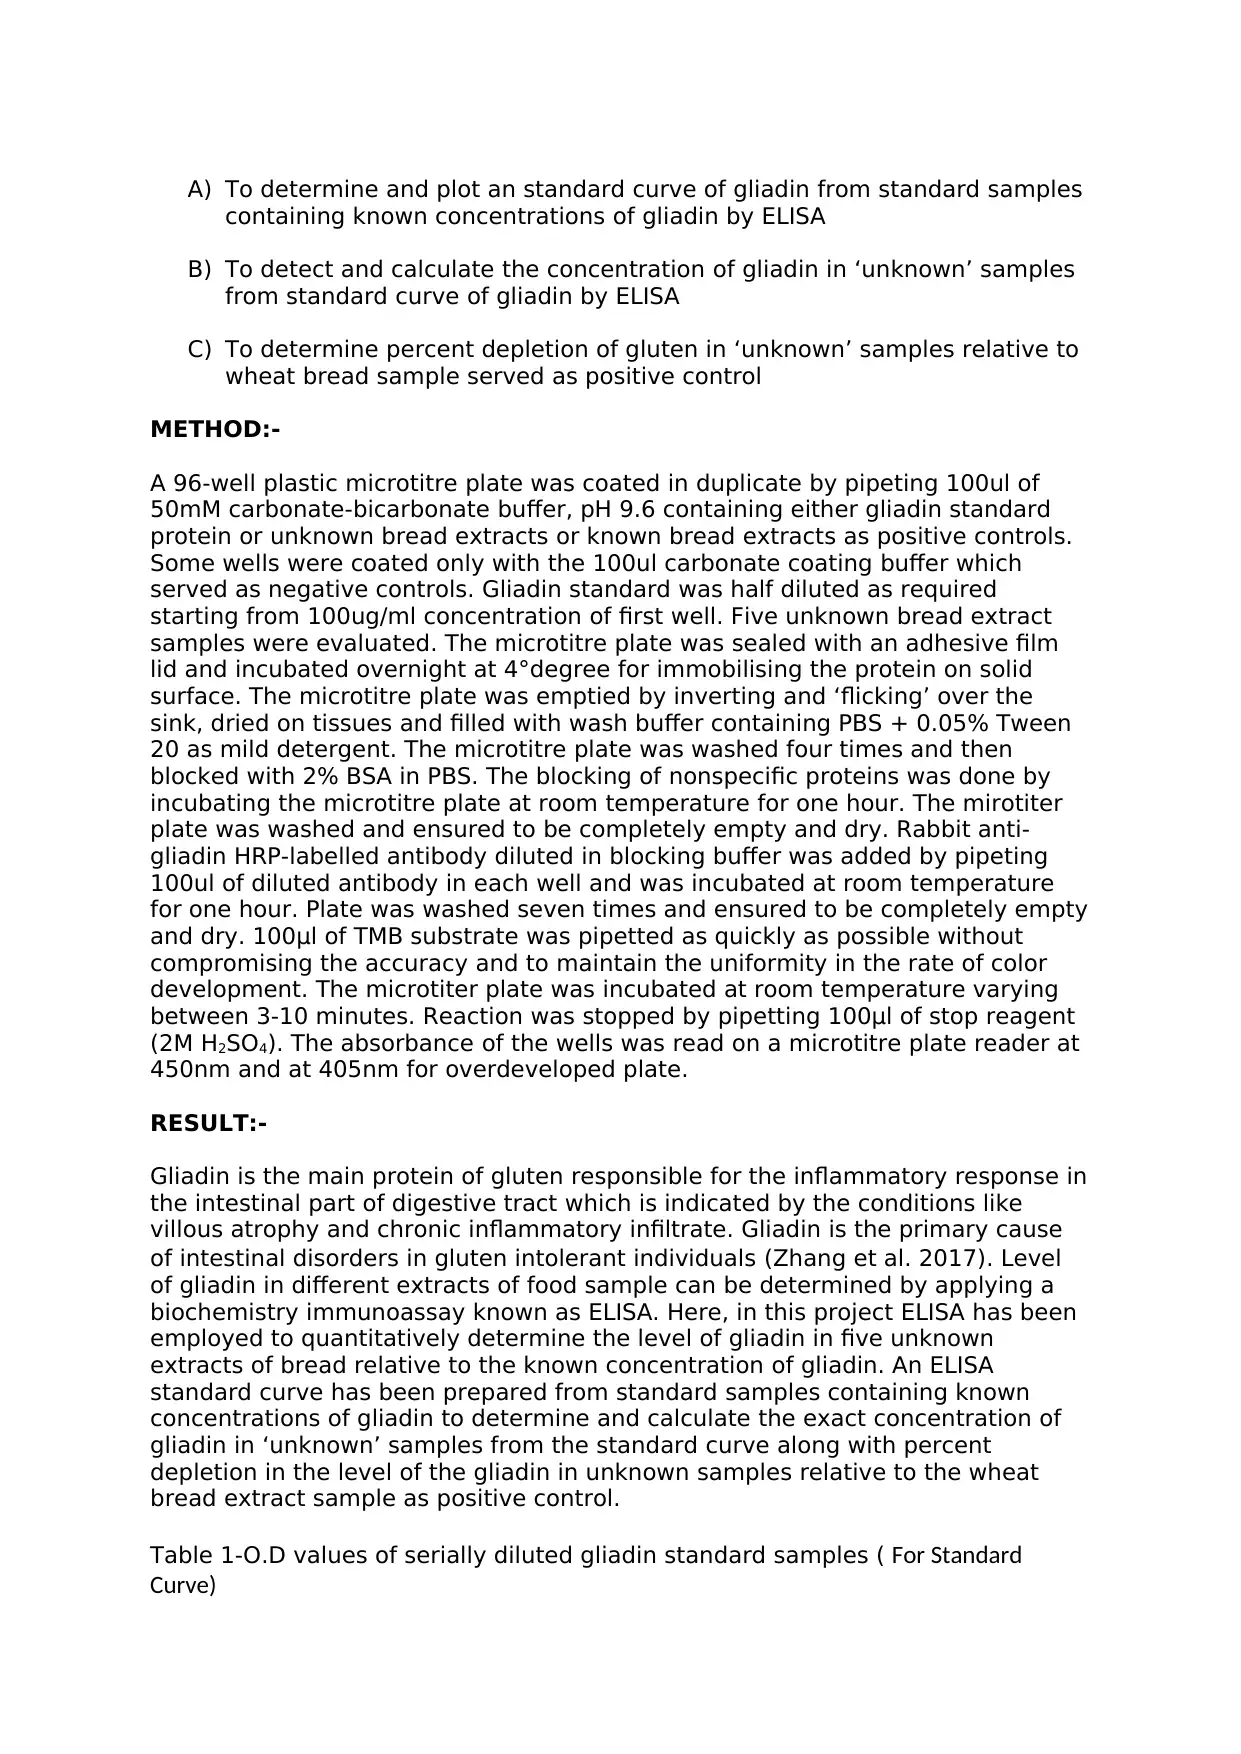
Table 1-O.D values of serially diluted gliadin standard samples ( For Standard
Curve)
Sample Duplicate
A
Duplicate
B
Mean OD Actual
mean OD
Concentration
(ng/ml)
Log10
concentration
(ng/ml)
1 (blank) 0.0502 0.0536 0.0519 - - -
2 (blank) 0.2164 0.1399 0.17815 - - -
1 1.2087 0.9096 1.05915 1.00725 100000 5
2 1.2458 0.9580 1.1019 1.0517 50000 4.6
3 1.4159 0.7589 1.0874 1.0355 25000 4.3
4 1.3506 0.7927 1.07165 1.01975 12500 4.0
5 1.1035 0.7561 0.9298 0.8779 6250 3.7
6 1.4140 0.8980 1.156 1.1041 3125 3.4
7 1.1864 0.7299 0.95815 0.90625 1562.5 3.1
8 1.0068 0.5273 0.76705 0.71515 781.25 2.8
9 0.5707 0.4070 0.48885 0.43695 390.63 2.5
10 0.5370 0.3099 0.42345 0.37155 195.31 2.2
Duplicate
C
Duplicate
D
11 0.2473 0.4178 0.33255 0.28065 97.656 1.9
12 0.3145 0.1887 0.2516 0.1997 48.828 1.6
13 0.2726 0.2190 0.2458 0.1939 24.414 1.3
14 0.2088 0.2535 0.23115 0.17925 12.207 1.0
15 0.3442 0.2870 0.3156 0.2637 6.1035 0.7
0 1 2 3 4 5 6
0
0.2
0.4
0.6
0.8
1
1.2
f(x) = 0.23360675290354 x
R² = 0.964166032429725
s tan d ard cu rv e o f G l i ad i n
CONCENTRATION
oPTICAL DENSITY
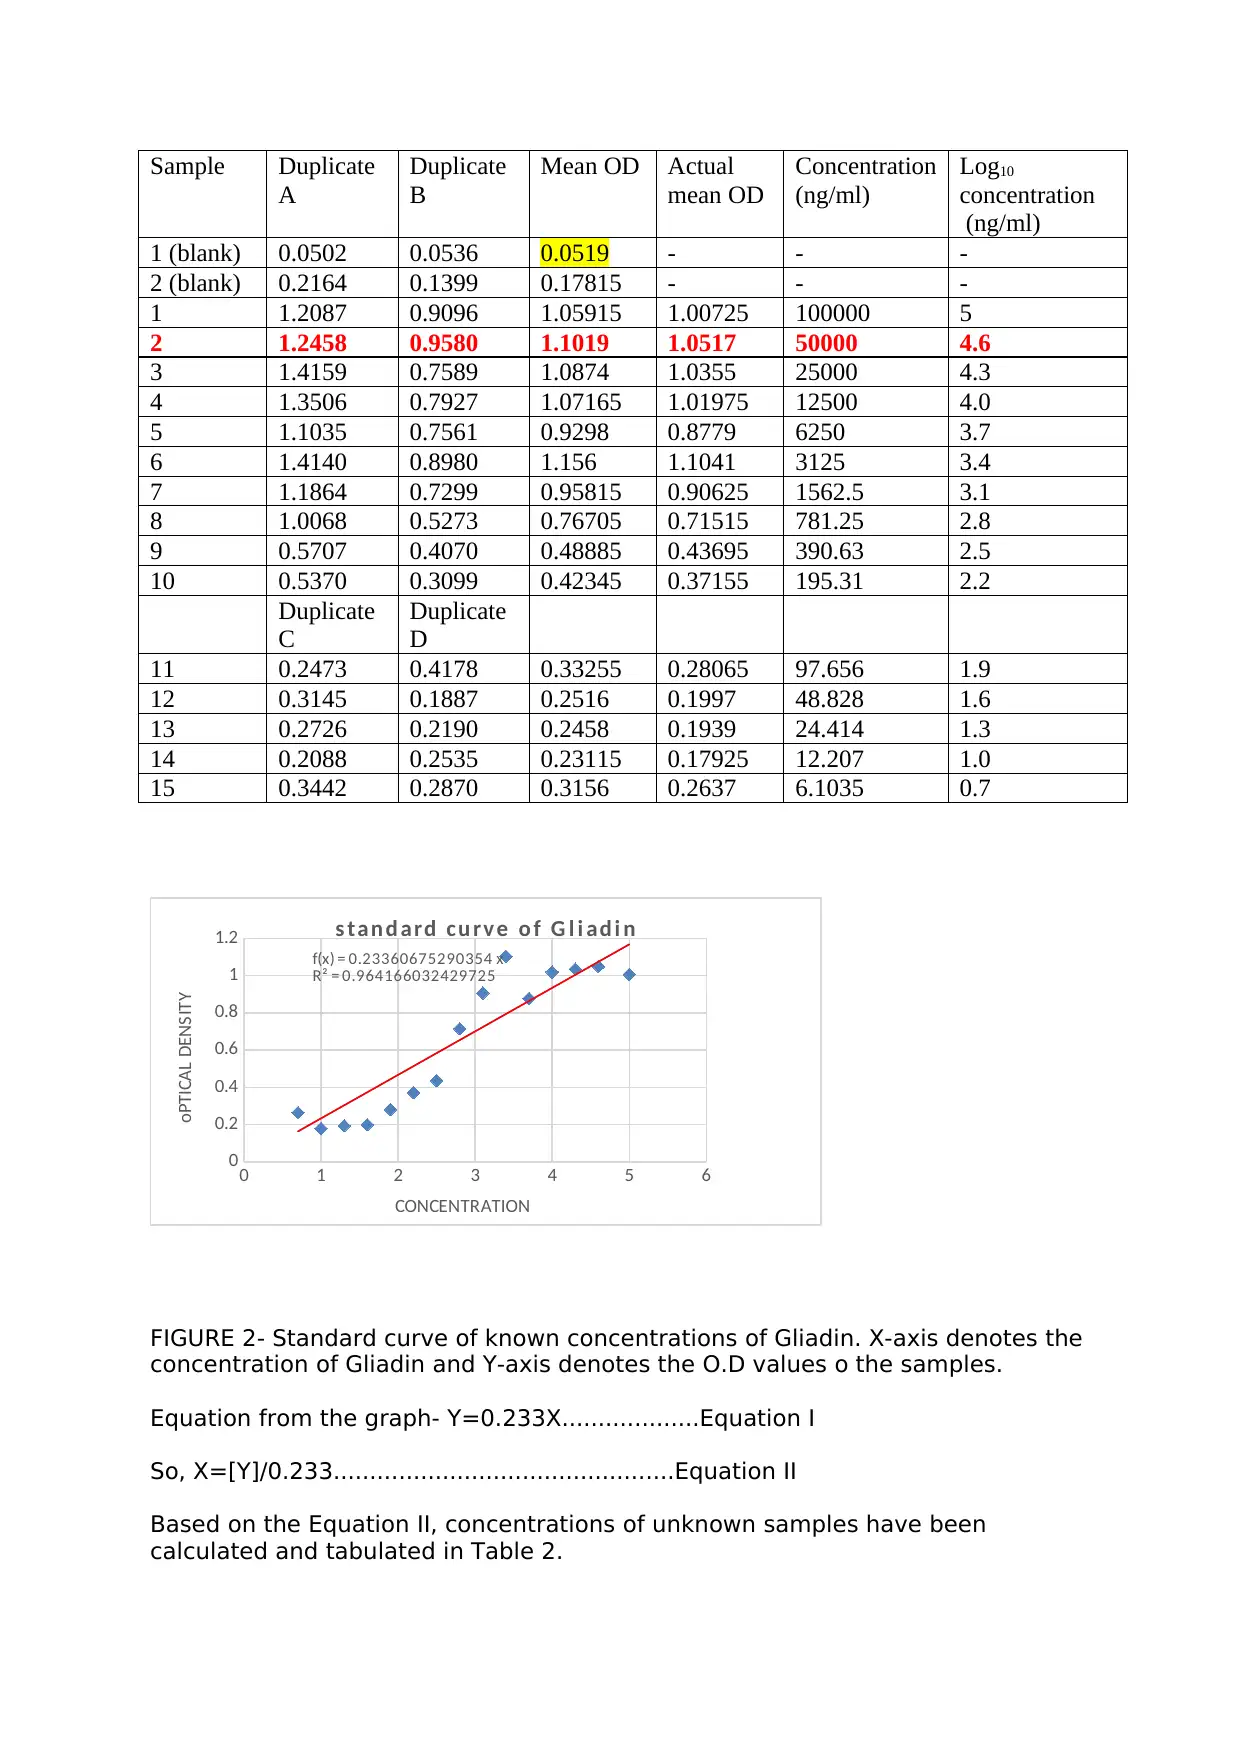
FIGURE 2- Standard curve of known concentrations of Gliadin. X-axis denotes the
concentration of Gliadin and Y-axis denotes the O.D values o the samples.
Equation from the graph- Y=0.233X...................Equation I
So, X=[Y]/0.233...............................................Equation II
Based on the Equation II, concentrations of unknown samples have been
calculated and tabulated in Table 2.
Paraphrase This Document
Need a fresh take? Get an instant paraphrase of this document with our AI Paraphraser
Calculation of % depletion relative to wheat bread (positive control)
% depletion relative to wheat bread = [A-B/A]*100........Equation III
Where A= Concentration of positive control
B=Concentration of sample
Based on Equation III percent depletion of Gliadin have been calculated relative
to wheat bread and tabulated in Table 2.
Table 2- Determination of concentration of unknown
Serial
No
Sample
Name
O.D value
(mean)
Concentration
(ug/ml)
percent
depletion relative
to wheat bread
(%)
Remarks
1 Br1 0.7316 3.139914163 99.05 High gluten
2 Br2 0.2457 1.054506438 33.26 Very low
gluten
3 Br3 0.6923 2.971244635 93.73 High gluten
4 Br4 0.1796 0.770815451 24.31 Very low
gluten
5 Br5 0.6088 2.612875536 82.42 High Gluten
6 Positive
control
0.7401 3.17639485 100.20 + control
The standard curve of serially diluted gliadin has been plotted in figure 2.The O.D
values are not linear in accordance with the concentration of gliadin as tabulated
in table 1. The graph is not showing the linearity of O.D values with that of the
known concentration of gliadin. Concentration of unknown samples of bread
extracts has been calculated from standard curve and tabulated in table 2. The
concentration of sample numbers Br2 and Br4 were in the range of 0.7 to 1.05
ug/ml when calculated from standard curve. For sample numbers Br1, Br3 and
Br5, the concentration was above 0.6 ug/ml, and approached close to the
concentration of positive control. Percent depletion was calculated from these
values and also tabulated in the fifth column of Table 2. From the Table 2, it can
be observed that Br1 has the highest amount of gluten, followed by Br3. The
gluten content of Br5 is ~8% lower. Hence, r1, Br3 and Br5 may be classified as
high- gluten breads. On the other hand, Br2 and Br4 may be classified as low –
gluten breads as their gluten content carried between 33-24%. However, none of
the breads in our study were gluten-free.
DISCUSSION:-
The method of ELISA was developed in 1971 as an alternative technique to
radioimmunoassay methods (Aydin 2015). Because these assays are based on
enzyme coupled reagents, these methods have prominent advantages such as
longevity of the reagents used in the assay, being free of the risks associated
with the radiation waste substance; facilitate the examination of multiple
samples at a time which is beneficiary in diagnosis as well as research
laboratories. So the method is employed worldwide in a very subtle manner for
various reasons like hepatitis screening, analysis of parasites, determining
hormone level for biochemistry and hematoloy assay, measuring a number of
tumor markers. Direct ELISA is a rapid method but lacks sensitivity which means
that the test will give well effective results in the presence of high amount of
antigen in the sample. In contrast to this “sandwich” and “indirect” ELISA’s can
quantify the amount of antigen and antibody with high specifity and sensitivity.
(Plebani 2012). As a number of biological fluids are rich in peptides, recently the
method of ELISA has been utilised to quantify amount of peptides in the
supernatant of biological tissues. To quantify supernatants of biological tissues,
the weight of wet tissue should be determined immediately as soon as it is
removed from the experimental organism (Anton et al. 2015).Some of the key
points to be noted while working with the ELISA are that the enzymes used in the
assay should not be present in the biological or food samples to be analysed, nor
there must be any other sample that can interfere with samples under analysis
(Plebani et al. 2015). Immunoassay methods implementing the highly sensitive
and specific kind of immunological techniques and reactions have been designed
and utilized in the food technology industry too, for identifying the naturally
occurring substances like antibiotics, microorganisms, pesticide residues of
pesticides, insecticides and particles of microbial constituents in relation to the
processing, production, analysis and safety of food. Both monoclonal and
polyclonal antibodies are being exploited for the generation and improvement of
the various methods of immunoassay, including radioimmunoassay (RIA) and
enzyme‐linked immunoassay (ELISA). Techniques of immunoassay provide
comparable and/or alternative approaches in reducing the utilization of
sophisticated and costly equipment along with analysis time, displaying
perpetuating reliability and developed excellent screening tools to detect
qualitative contaminations and adulteration. The application of immunoassay
techniques has enhanced the safety and quality control of our food supply
tremendously (McGrath et al. 2012).
In my project I have employed ‘direct’ ELISA to quantitatively determine the
amount of gliadin peptides in the samples of bread from the standard curve
prepared with known amount of gliadin. The standard curve graph has been
plotted as depicted in Figure 2. But there are some O.D values which are not in
accordance with the concentration, that is they do not show a linear variation
with respect to concentration. Some O.D values are not following the trend with
increasing or decreasing concentrations of peptides. Moreover, the O.D of
standard 1 to 4 is almost same. This may be due to poor mixing, pipetting error
or inappropriate washing of the plate. Still on plotting all the values, a trend line
was obtained which was used to calculate the concentration of gliadin in
unknown samples along with positive control as tabulated in Table 1. Now to
determine whether the bread extracts can be reasonably labelled as ‘gluten-free’
or ‘low gluten’ or ‘medium gluten’, the percent depletion of the level of gliadin
relative to wheat bread extract sample has also been calculated and tabulated in
Table 1. From this it can be concluded that ELISA is a simple yet significant
technique to determine the concentration of specific proteins or peptides in any
food or biological sample. Since the technique is used for the quantitative
evaluation of the sample, utmost care should be taken while serially diluting the
samples and also throughout the process. It must be noted that the
concentration of serially diluted biological sample must reflect perfect linearity.
Washing steps are also very crucial as improper washing may lead to the
detection of unbound antibodies causing the variation in the actual reading. So
automation of the process can be an alternative approach that will reduce the
error arising because of poor manual handling. In order to improve the reliability
of technique of ELISA, it is important to not only internationally standardize
protocols of methods of ELISA but also the chemicals used in the experiments.
REFERENCES:-
Anton, G., Wilson, R., Yu, Z. H., Prehn, C., Zukunft, S., Adamski, J., Heier, M., Meisinger, C.,
Romisch-Margl, W., Wang-Sattler, R., Hveem, K., Wolfenbuttel, B., Peters, A.,
Kastenmuller, G. and Waldenberger, M. (2015) 'Pre-analytical sample quality: metabolite
ratios as an intrinsic marker for prolonged room temperature exposure of serum samples',
PLoS One, 10(3), e0121495.
Aydin, S. (2015) 'A short history, principles, and types of ELISA, and our laboratory
experience with peptide/protein analyses using ELISA', Peptides, 72, 4-15.
Biesiekierski, J. R., Newnham, E. D., Irving, P. M., Barrett, J. S., Haines, M., Doecke, J. D.,
Shepherd, S. J., Muir, J. G. and Gibson, P. R. (2011) 'Gluten causes gastrointestinal
symptoms in subjects without celiac disease: a double-blind randomized placebo-
controlled trial', Am J Gastroenterol, 106(3), 508-14; quiz 515.
Caminero, A., Galipeau, H. J., McCarville, J. L., Johnston, C. W., Bernier, S. P., Russell, A. K.,
Jury, J., Herran, A. R., Casqueiro, J., Tye-Din, J. A., Surette, M. G., Magarvey, N. A.,
Schuppan, D. and Verdu, E. F. (2016) 'Duodenal Bacteria From Patients With Celiac Disease
and Healthy Subjects Distinctly Affect Gluten Breakdown and Immunogenicity',
Gastroenterology, 151(4), 670-83.
Engvall, E. (2010) 'The ELISA, enzyme-linked immunosorbent assay', Clin Chem, 56(2), 319-
20.
Hansen, C. H., Krych, L., Buschard, K., Metzdorff, S. B., Nellemann, C., Hansen, L. H.,
Nielsen, D. S., Frokiaer, H., Skov, S. and Hansen, A. K. (2014) 'A maternal gluten-free diet
reduces inflammation and diabetes incidence in the offspring of NOD mice', Diabetes,
63(8), 2821-32.
Haupt-Jorgensen, M., Buschard, K., Hansen, A. K., Josefsen, K. and Antvorskov, J. C. (2016)
'Gluten-free diet increases beta-cell volume and improves glucose tolerance in an animal
model of type 2 diabetes', Diabetes Metab Res Rev, 32(7), 675-684.
Laparra, J. M. and Sanz, Y. (2010) 'Bifidobacteria inhibit the inflammatory response
induced by gliadins in intestinal epithelial cells via modifications of toxic peptide
generation during digestion', J Cell Biochem, 109(4), 801-7.
Levy, N. S., Vardi, M., Blum, S., Miller-Lotan, R., Afinbinder, Y., Cleary, P. A., Paterson, A.
D., Bharaj, B., Snell-Bergeon, J. K., Rewers, M. J., Lache, O. and Levy, A. P. (2013) 'An
enzyme linked immunosorbent assay (ELISA) for the determination of the human
haptoglobin phenotype', Clin Chem Lab Med, 51(8), 1615-22.
McGrath, T. F., Elliott, C. T. and Fodey, T. L. (2012) 'Biosensors for the analysis of
microbiological and chemical contaminants in food', Anal Bioanal Chem, 403(1), 75-92.
Secure Best Marks with AI Grader
Need help grading? Try our AI Grader for instant feedback on your assignments.
Plebani, M. (2012) 'Quality indicators to detect pre-analytical errors in laboratory testing',
Clin Biochem Rev, 33(3), 85-8.
Plebani, M., Sciacovelli, L., Aita, A., Pelloso, M. and Chiozza, M. L. (2015) 'Performance
criteria and quality indicators for the pre-analytical phase', Clin Chem Lab Med, 53(6), 943-
8.
Sapone, A., Bai, J. C., Ciacci, C., Dolinsek, J., Green, P. H., Hadjivassiliou, M., Kaukinen, K., Rostami,
K., Sanders, D. S., Schumann, M., Ullrich, R., Villalta, D., Volta, U., Catassi, C. and Fasano, A.
(2012) 'Spectrum of gluten-related disorders: consensus on new nomenclature and
classification', BMC Med, 10, 13.
Tremaroli, V. and Backhed, F. (2012) 'Functional interactions between the gut microbiota
and host metabolism', Nature, 489(7415), 242-9.
Wang, J. and Jia, H. (2016) 'Metagenome-wide association studies: fine-mining the
microbiome', Nat Rev Microbiol, 14(8), 508-22.
Watanabe, E., Miyake, S. and Yogo, Y. (2013) 'Review of enzyme-linked immunosorbent
assays (ELISAs) for analyses of neonicotinoid insecticides in agro-environments', J Agric
Food Chem, 61(51), 12459-72.
Zhang, L., Andersen, D., Roager, H. M., Bahl, M. I., Hansen, C. H., Danneskiold-Samsoe, N.
B., Kristiansen, K., Radulescu, I. D., Sina, C., Frandsen, H. L., Hansen, A. K., Brix, S., Hellgren,
L. I. and Licht, T. R. (2017) 'Effects of Gliadin consumption on the Intestinal Microbiota and
Metabolic Homeostasis in Mice Fed a High-fat Diet', Sci Rep, 7, 44613.
1 out of 8
Your All-in-One AI-Powered Toolkit for Academic Success.
+13062052269
info@desklib.com
Available 24*7 on WhatsApp / Email
Unlock your academic potential
© 2024 | Zucol Services PVT LTD | All rights reserved.