Capital budgeting practices: A survey of Central and Eastern European firms
VerifiedAdded on 2022/10/12
|25
|19103
|406
AI Summary
This article reports the results of a survey conducted on 400 executives in ten countries in Central and Eastern Europe (CEE) regarding their companies' capital budgeting practices. The survey found that capital budgeting practices in CEE countries are influenced mostly by firm size, multinational culture, firms' goals, and the presence of code of ethics. The use of discounted cash flow (DCF) method in CEE countries is positively related to firm size, management culture, and business ethics, and to a lesser extent, to the executive ownership, number of projects analyzed, and target leverage.
Contribute Materials
Your contribution can guide someone’s learning journey. Share your
documents today.
Capital budgeting practices: A survey of Central
and Eastern European firms☆
Gyorgy Andora, Sunil K. Mohantyb,⁎, Tamas Totha
a Department of Finance, Budapest University of Technology and Economics, Budapest, Hungary
b Department of Finance, Brooklyn College, City University of New York (CUNY), Brooklyn, NY 11210, United States
a r t i c l e i n f o a b s t r a c t
Article history:
Received 17 November 2013
Received in revised form 22 February 2015
Accepted 2 April 2015
Available online 10 April 2015
We survey 400 executives in ten countries in Central and Eastern Europe
(CEE) and report the results of their companies'capital budgeting
practices. We find that capital budgeting practices in CEE countries are
influenced mostly by firm size, multinational culture, firms' goals, and
the presence of code of ethics, and to a lesser extent, by executive own-
ership, number of projects analyzed, and target leverage. We compare
our results with prior studies and find significant variations in capital
budgeting practices across 35 countries,among high,upper middle,
and lower middle income countries,and across seven geographic
regions.
© 2015 Elsevier B.V. All rights reserved.
JEL classification:
G31
G32
F23
Keywords:
Capital budgeting
Cost of capital
Central and Eastern Europe
1. Introduction
Capital budgeting decisions are among the most important decisions that the financial manager of a firm
has to make. Capital budgeting process refers to the process of selection of investment projects that maximize
shareholder value. Prior studies related to capital budgeting practices have mostly focused on developed
Emerging Markets Review 23 (2015) 148–172
Contents lists available at ScienceDirect
Emerging Markets Review
j o u r n a lh o m e p a g e : w w w . e l s e v i e r . c o m / l o c a t e / e m r
Secure Best Marks with AI Grader
Need help grading? Try our AI Grader for instant feedback on your assignments.
economies (e.g., U.S., Canada, Australia, and Western European countries). However, much less is known
about how capital budgeting decisions are made in transitional economies (e.g., post-communist countries
in Central and Eastern Europe), which is the topic of this paper.
Previous research (e.g., Bennouna et al., 2010; Brounen et al., 2004; Graham and Harvey, 2001) addresses
how corporate finance theories have been adopted by financial managers in practice. However, one would
argue that most of the stylized facts are likely to be rooted in the U.S. and Western European empirical evi-
dence. Several studies document fundamental differences between financial markets, legal systems, and insti-
tutional settings, when comparing the U.S. with Western Europe (e.g., La Porta et al., 1997, 1998). Among
countries and regions, there are significant differences in the extent to which investors are protected from ex-
propriation by managers (e.g., La Porta et al., 2000). Rajan and Zingales (2003) indicate that institution-heavy
relationship-based system is more prevalent in continental Europe, while the market-intensive arms' length
system is more prevalent in the U.S. and Canada. Chew (1997) finds that market-based corporate governance
system differs significantly from the insider-based or relationship-based governance system. For example,
Brounen et al. (2004) provide survey evidence that firms in the U.K. and the Netherlands strive to maximize
shareholders' wealth, while German and French firms attach a low priority to this corporate goal. Licht et al.
(2005, 2007) show how culture, law, and corporate governance mechanisms affect corporate management
decisions. Stulz and Williamson (2003) suggest that corporate financial practices are influenced by national
culture. Similarly, Li et al. (2013) provide theoretic model and empirical evidence on how national culture in-
fluences corporate risk-taking behavior. Finally, most of corporate finance theories have been developed
under the assumption that capital markets are “semi-strong” efficient. However, this assumption seems to
be questionable when it is applied to emerging markets that are typically characterized by higher information
asymmetries, higher transaction costs, relatively concentrated ownership with small and medium enter-
prises, and relatively low market liquidity. For example, Maquieira et al. (2012) and Mendes-Da-Silva and
Saito (2014) find evidence that capital budgeting practices of firms in Latin America where capital markets
are still emerging are significantly different from those of developed countries.
In this study, we conduct a comprehensive survey that asks business executives from a wide range of firms
in the Central and Eastern Europe (CEE) region1 to describe their choices related to capital budgeting analysis
and decisions. We measure the extent to which corporate finance theories explain the capital budgeting prac-
tices in Central and Eastern European countries. The CEE region consists of several small, open economies
where most of the GDP is produced by small- and medium-sized companies with a strong interdependence
on multinational companies. We include ten CEE countries in our survey. These countries are considered
either high or middle income countries based on the OECD classification.2 CEE countries are characterized
by diverse culture, languages, legal systems, institutional settings, and corporate governance mechanisms.
These countries tend to have a well-developed banking system, but they tend to have less developed capital
markets that are likely be less efficient and less liquid than developed capital markets. The levels of economic
and financial development in CEE countries tend to be lower than those of developed countries in North
America and Western Europe. Most firms in CEE countries tend to be small or medium private enterprises.
Given the significant differences between developed and emerging economies; between efficient and less-
149G. Andor et al. / Emerging Markets Review 23 (2015) 148–172
2001); in South America: Argentina,Brazil, Chile, Colombia,Ecuador,Uruguay,Peru, and Venezuela
(Maquieira et al., 2012; Mendes-Da-Silva and Saito, 2014); in East Asia and Pacific: Australia, China, Hong
Kong, Indonesia, Malaysia, the Philippines, and Singapore (Hermes et al., 2007; Kester et al., 1999; Truong
et al., 2008); in South Asia: India (Singh et al., 2012); in Africa: South Africa (Correia and Cramer, 2008);
and in Western Europe: the U.K.,the Netherlands,Germany,France,Finland,and Sweden (Arnold and
Hatzopoulos, 2000; Brounen et al., 2004; Daunfeldt and Hartwig, 2014; Hermes et al., 2007; Holmén and
Pramborg, 2009; Liljeblom and Vaihekoski, 2004).
Our paper contributes to the corporate finance literature in a number of ways. First, we use the field study
method in finance, which to date remains a relatively rare approach in corporate finance literature. Second,
many previous studies applying comprehensive survey approaches focus only on developed countries such
as the USA, U.K. and Western Europe. In this study, we survey a large number of financial executives in ten
countries in Central and Eastern Europe (CEE) and report the results of their companies' capital budgeting
practices.We examine the use of different capital budgeting methods,and the relation between capital
budgeting practices and the general goals of firms. Therefore, our survey results are useful to both practi-
tioners and investors because they will learn more about capital budgeting practices of firms in CEE countries.
To our knowledge, none of the empirical studies has yet addressed capital budgeting practices of firms in CEE
countries that are next to the most developed economies in terms of GDP per capita except for Hernádi and
Ormos' (2012) study which provides an analysis and discussion on capital structure decisions in CEE coun-
tries. Third, this study is broader in scope than other capital budgeting surveys. We compare the corporate fi-
nance practices of 35 countries in seven geographic regions (Central and Eastern Europe, Western Europe,
North America, South America, East Asia and Pacific, South Asia, and Africa) around the world. We also com-
pare capital budgeting practices among countries by economic development (high income, upper middle in-
come, and lower middle income).
We sample a large cross section of approximately 70,000 firms (excluding micro-firms) representing a
wide variety of firms and industries across ten CEE countries — Bulgaria, Croatia, Czech Republic, Hungary,
Latvia, Lithuania, Poland, Romania, Slovak Republic, and Slovenia. We collect 400 responses by conducting a
telephone survey. Then, we restrict our analysis to 333 sample firms that follow a formal capital budgeting
practice and thus create a sample size representing one of the largest survey samples in the financial litera-
ture.3 We analyze responses conditional on several key firm characteristics such as firm size, number of pro-
jects analyzed in a year,executive ownership,code of ethics,target leverage,and the role of Western
management culture. We also examine the relation between capital budgeting practices and general goals
of the companies. Our empirical evidence is consistent with several theoretical predictions and empirical find-
ings of earlier studies. The main results of our survey indicate that the use of discounted cash flow (DCF)
method in CEE countries is positively related to firm size (e.g., Brounen et al., 2004; Graham and Harvey,
2001; Hermes et al., 2007), management culture, and business ethics (e.g., Li et al., 2013; Licht et al., 2005;
Stulz and Williamson, 2003), and to a lesser extent, to the executive ownership, number of projects analyzed,
and target leverage. Our survey results suggest that that top executives of firms in CEE countries are mostly
concerned with the long-term performance (stability) and solvency (liquidity) of their firms instead of
150 G. Andor et al. / Emerging Markets Review 23 (2015) 148–172
budgeting practices of six other geographic regions (e.g., Western Europe, North America, South America, East
Asia and Pacific, South Asia, and Africa). Consistent with findings of previous studies (e.g., La Porta et al. (1997,
1998, 2000), Hermes et al. (2007), and Maquieira et al. (2012)), we report significant variations in capital
budgeting practices across geographic regions and levels of economic development.4
The paper is organized as follows.In the next section, we provide a brief overview of prior studies on
capital budgeting practices. In Section 3, we present our methodology and describe our data set, sample de-
sign, and collection procedure. In Section 4, we offer a comprehensive overview of the survey results for
CEE countries and how they compare with findings of previous international studies. Finally, in Section 5,
we offer some concluding remarks.
2. Prior studies on capital budgeting practices: a brief overview
Over the past four decades, numerous capital budgeting surveys have been conducted to confront corpo-
rate finance theory with practice by financial managers. The following includes a summary of major studies on
capital budgeting practices around the world.
Graham and Harvey (2001) conduct a comprehensive field study on the practice of corporate finance. They
survey financial executives who are members of the Financial Executives Institute (FEI) and have held policy-
making positions as CFOs, treasurers, and controllers in 8000 companies throughout the USA and Canada.
They sent questionnaires to 4440 FEI members (including 313 CFOs of Fortune 500 companies). They received
392 completed questionnaires with a response rate of nearly 9%. Approximately 67% of the responding firms
were publicly traded and about half of them had sales greater than 500 million USD. In later years, Graham
et al.(2005) surveyed 401 U.S.financial executives on corporate financial reporting,Brav et al.(2005)
surveyed 384 financialexecutives to determine the factors that drive dividend and share repurchase
decisions, and more recently Graham et al. (2010) surveyed more than 1000 CEOs and CFOs to understand
how capital is allocated and decision-making authority is delegated within firms.
Another study includes Bennouna et al.(2010) who conducted a mail survey in Canada.The survey
population included the 500 largest firms that were listed in the Financial Post magazine.Their sample
contained 88 firms with a response rate of 18.4%. The sales revenues of the sample firms varied from 1000
to 1999 million Canadian dollars.
Brounen et al. (2004) chose 6000 firms in the U.K., Germany, and France and 500 firms in the Netherlands
for a total of 6500 firms. These firms were publicly traded as well as privately held. Their sample firms includ-
ed demographic data about the CFOs from the Amadeus data sets. The response rate for their survey was only
5% (313 responses), which is quite low compared to other surveys. Only 30% of the responding firms were
publicly listed and about half of the responding firms had sales more than 100 million Euros.
Hermes et al.(2007) conducted a survey on China and the Netherlands that mostly focused on listed
companies. They received 42 responses from Dutch firms of which 69% were publicly traded firms, while
93% of Chinese responding firms were publicly traded ones. Almost half of the Dutch firms had sales more
151G. Andor et al. / Emerging Markets Review 23 (2015) 148–172
Secure Best Marks with AI Grader
Need help grading? Try our AI Grader for instant feedback on your assignments.
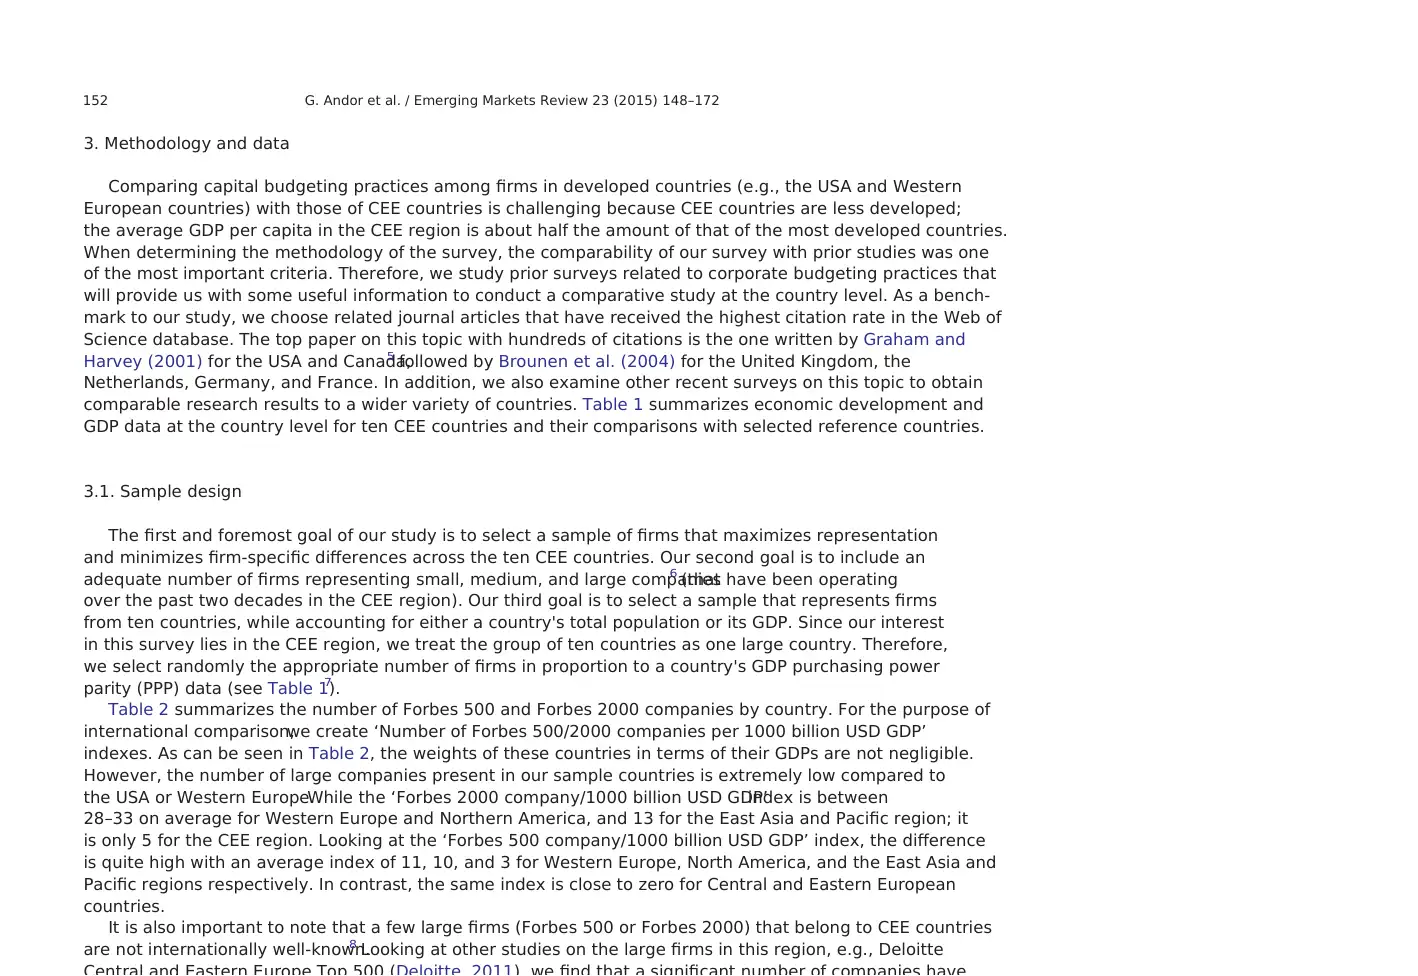
3. Methodology and data
Comparing capital budgeting practices among firms in developed countries (e.g., the USA and Western
European countries) with those of CEE countries is challenging because CEE countries are less developed;
the average GDP per capita in the CEE region is about half the amount of that of the most developed countries.
When determining the methodology of the survey, the comparability of our survey with prior studies was one
of the most important criteria. Therefore, we study prior surveys related to corporate budgeting practices that
will provide us with some useful information to conduct a comparative study at the country level. As a bench-
mark to our study, we choose related journal articles that have received the highest citation rate in the Web of
Science database. The top paper on this topic with hundreds of citations is the one written by Graham and
Harvey (2001) for the USA and Canada,5 followed by Brounen et al. (2004) for the United Kingdom, the
Netherlands, Germany, and France. In addition, we also examine other recent surveys on this topic to obtain
comparable research results to a wider variety of countries. Table 1 summarizes economic development and
GDP data at the country level for ten CEE countries and their comparisons with selected reference countries.
3.1. Sample design
The first and foremost goal of our study is to select a sample of firms that maximizes representation
and minimizes firm-specific differences across the ten CEE countries. Our second goal is to include an
adequate number of firms representing small, medium, and large companies6 (that have been operating
over the past two decades in the CEE region). Our third goal is to select a sample that represents firms
from ten countries, while accounting for either a country's total population or its GDP. Since our interest
in this survey lies in the CEE region, we treat the group of ten countries as one large country. Therefore,
we select randomly the appropriate number of firms in proportion to a country's GDP purchasing power
parity (PPP) data (see Table 1).7
Table 2 summarizes the number of Forbes 500 and Forbes 2000 companies by country. For the purpose of
international comparison,we create ‘Number of Forbes 500/2000 companies per 1000 billion USD GDP’
indexes. As can be seen in Table 2, the weights of these countries in terms of their GDPs are not negligible.
However, the number of large companies present in our sample countries is extremely low compared to
the USA or Western Europe.While the ‘Forbes 2000 company/1000 billion USD GDP’index is between
28–33 on average for Western Europe and Northern America, and 13 for the East Asia and Pacific region; it
is only 5 for the CEE region. Looking at the ‘Forbes 500 company/1000 billion USD GDP’ index, the difference
is quite high with an average index of 11, 10, and 3 for Western Europe, North America, and the East Asia and
Pacific regions respectively. In contrast, the same index is close to zero for Central and Eastern European
countries.
It is also important to note that a few large firms (Forbes 500 or Forbes 2000) that belong to CEE countries
are not internationally well-known.8 Looking at other studies on the large firms in this region, e.g., Deloitte
152 G. Andor et al. / Emerging Markets Review 23 (2015) 148–172
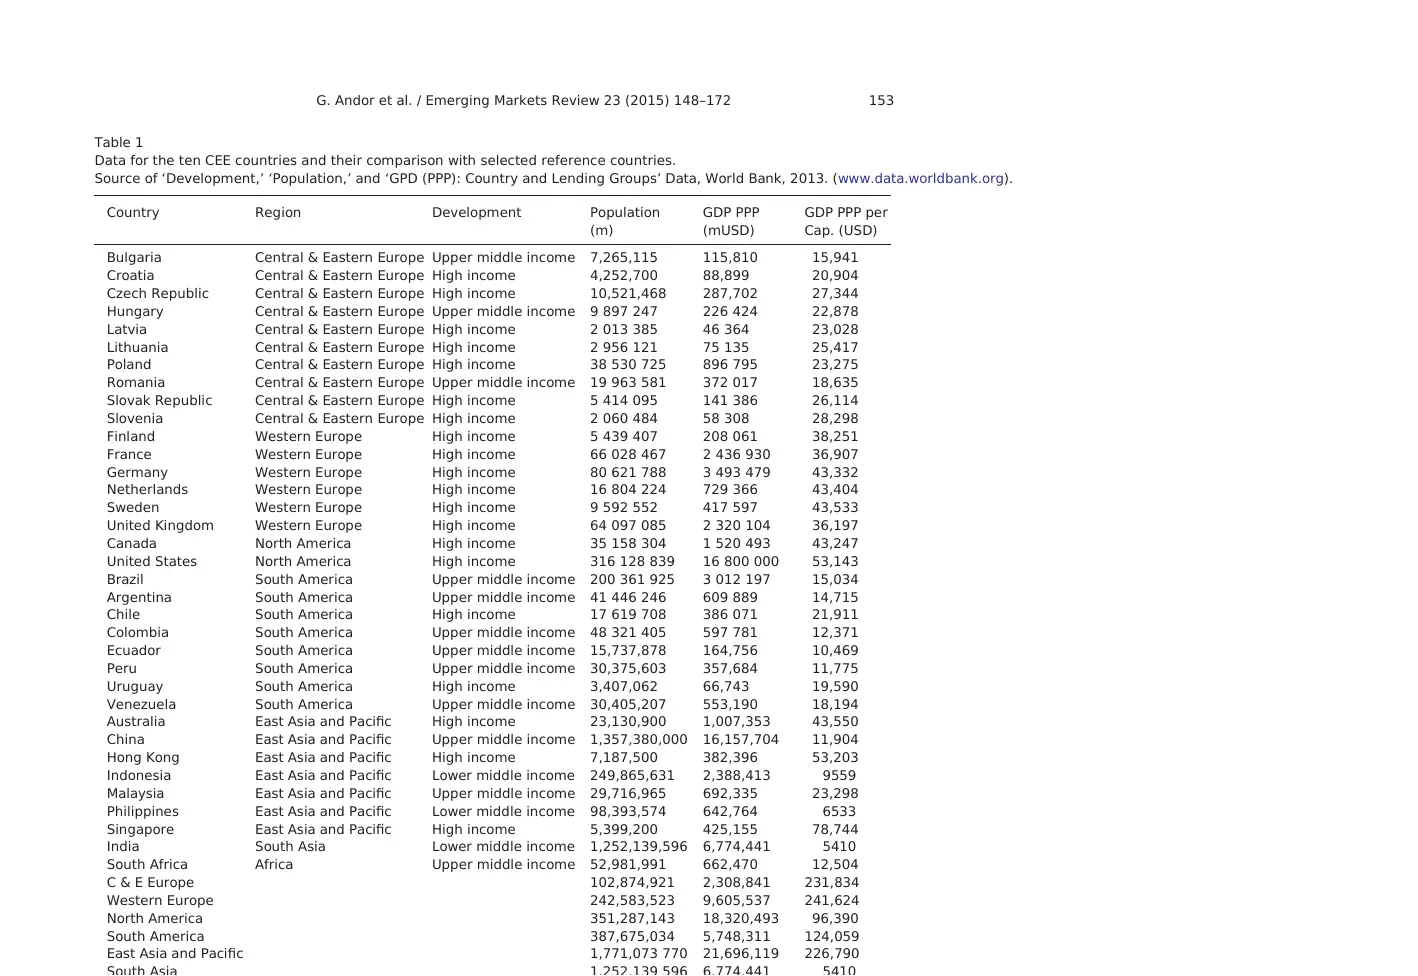
Table 1
Data for the ten CEE countries and their comparison with selected reference countries.
Source of ‘Development,’ ‘Population,’ and ‘GPD (PPP): Country and Lending Groups’ Data, World Bank, 2013. (www.data.worldbank.org).
Country Region Development Population
(m)
GDP PPP
(mUSD)
GDP PPP per
Cap. (USD)
Bulgaria Central & Eastern Europe Upper middle income 7,265,115 115,810 15,941
Croatia Central & Eastern Europe High income 4,252,700 88,899 20,904
Czech Republic Central & Eastern Europe High income 10,521,468 287,702 27,344
Hungary Central & Eastern Europe Upper middle income 9 897 247 226 424 22,878
Latvia Central & Eastern Europe High income 2 013 385 46 364 23,028
Lithuania Central & Eastern Europe High income 2 956 121 75 135 25,417
Poland Central & Eastern Europe High income 38 530 725 896 795 23,275
Romania Central & Eastern Europe Upper middle income 19 963 581 372 017 18,635
Slovak Republic Central & Eastern Europe High income 5 414 095 141 386 26,114
Slovenia Central & Eastern Europe High income 2 060 484 58 308 28,298
Finland Western Europe High income 5 439 407 208 061 38,251
France Western Europe High income 66 028 467 2 436 930 36,907
Germany Western Europe High income 80 621 788 3 493 479 43,332
Netherlands Western Europe High income 16 804 224 729 366 43,404
Sweden Western Europe High income 9 592 552 417 597 43,533
United Kingdom Western Europe High income 64 097 085 2 320 104 36,197
Canada North America High income 35 158 304 1 520 493 43,247
United States North America High income 316 128 839 16 800 000 53,143
Brazil South America Upper middle income 200 361 925 3 012 197 15,034
Argentina South America Upper middle income 41 446 246 609 889 14,715
Chile South America High income 17 619 708 386 071 21,911
Colombia South America Upper middle income 48 321 405 597 781 12,371
Ecuador South America Upper middle income 15,737,878 164,756 10,469
Peru South America Upper middle income 30,375,603 357,684 11,775
Uruguay South America High income 3,407,062 66,743 19,590
Venezuela South America Upper middle income 30,405,207 553,190 18,194
Australia East Asia and Pacific High income 23,130,900 1,007,353 43,550
China East Asia and Pacific Upper middle income 1,357,380,000 16,157,704 11,904
Hong Kong East Asia and Pacific High income 7,187,500 382,396 53,203
Indonesia East Asia and Pacific Lower middle income 249,865,631 2,388,413 9559
Malaysia East Asia and Pacific Upper middle income 29,716,965 692,335 23,298
Philippines East Asia and Pacific Lower middle income 98,393,574 642,764 6533
Singapore East Asia and Pacific High income 5,399,200 425,155 78,744
India South Asia Lower middle income 1,252,139,596 6,774,441 5410
South Africa Africa Upper middle income 52,981,991 662,470 12,504
C & E Europe 102,874,921 2,308,841 231,834
Western Europe 242,583,523 9,605,537 241,624
North America 351,287,143 18,320,493 96,390
South America 387,675,034 5,748,311 124,059
East Asia and Pacific 1,771,073 770 21,696,119 226,790
153G. Andor et al. / Emerging Markets Review 23 (2015) 148–172
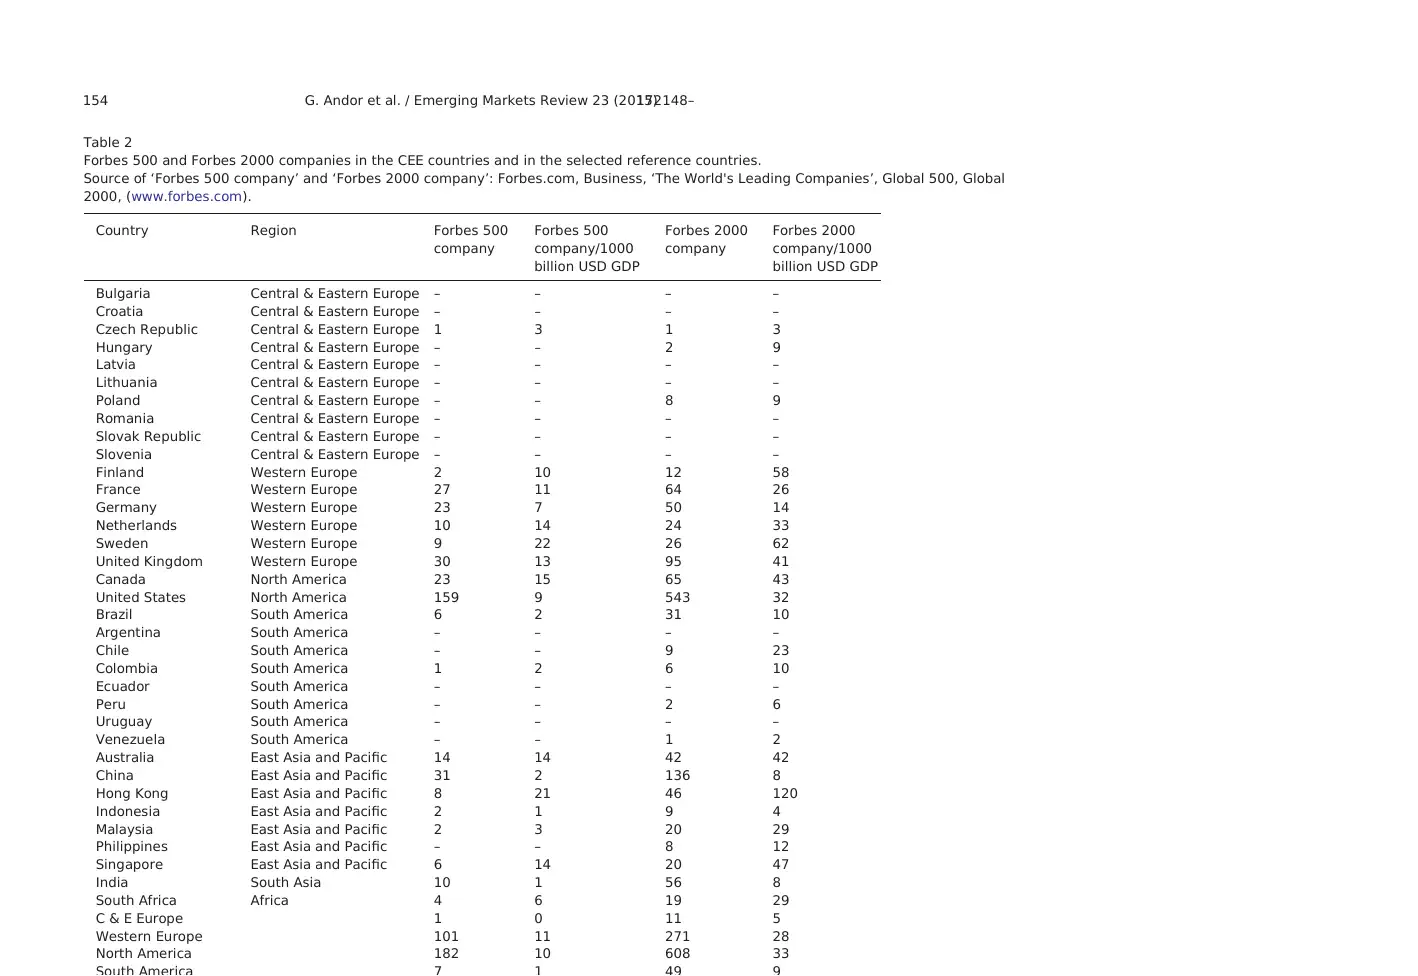
Table 2
Forbes 500 and Forbes 2000 companies in the CEE countries and in the selected reference countries.
Source of ‘Forbes 500 company’ and ‘Forbes 2000 company’: Forbes.com, Business, ‘The World's Leading Companies’, Global 500, Global
2000, (www.forbes.com).
Country Region Forbes 500
company
Forbes 500
company/1000
billion USD GDP
Forbes 2000
company
Forbes 2000
company/1000
billion USD GDP
Bulgaria Central & Eastern Europe – – – –
Croatia Central & Eastern Europe – – – –
Czech Republic Central & Eastern Europe 1 3 1 3
Hungary Central & Eastern Europe – – 2 9
Latvia Central & Eastern Europe – – – –
Lithuania Central & Eastern Europe – – – –
Poland Central & Eastern Europe – – 8 9
Romania Central & Eastern Europe – – – –
Slovak Republic Central & Eastern Europe – – – –
Slovenia Central & Eastern Europe – – – –
Finland Western Europe 2 10 12 58
France Western Europe 27 11 64 26
Germany Western Europe 23 7 50 14
Netherlands Western Europe 10 14 24 33
Sweden Western Europe 9 22 26 62
United Kingdom Western Europe 30 13 95 41
Canada North America 23 15 65 43
United States North America 159 9 543 32
Brazil South America 6 2 31 10
Argentina South America – – – –
Chile South America – – 9 23
Colombia South America 1 2 6 10
Ecuador South America – – – –
Peru South America – – 2 6
Uruguay South America – – – –
Venezuela South America – – 1 2
Australia East Asia and Pacific 14 14 42 42
China East Asia and Pacific 31 2 136 8
Hong Kong East Asia and Pacific 8 21 46 120
Indonesia East Asia and Pacific 2 1 9 4
Malaysia East Asia and Pacific 2 3 20 29
Philippines East Asia and Pacific – – 8 12
Singapore East Asia and Pacific 6 14 20 47
India South Asia 10 1 56 8
South Africa Africa 4 6 19 29
C & E Europe 1 0 11 5
Western Europe 101 11 271 28
North America 182 10 608 33
154 G. Andor et al. / Emerging Markets Review 23 (2015) 148–172
Paraphrase This Document
Need a fresh take? Get an instant paraphrase of this document with our AI Paraphraser
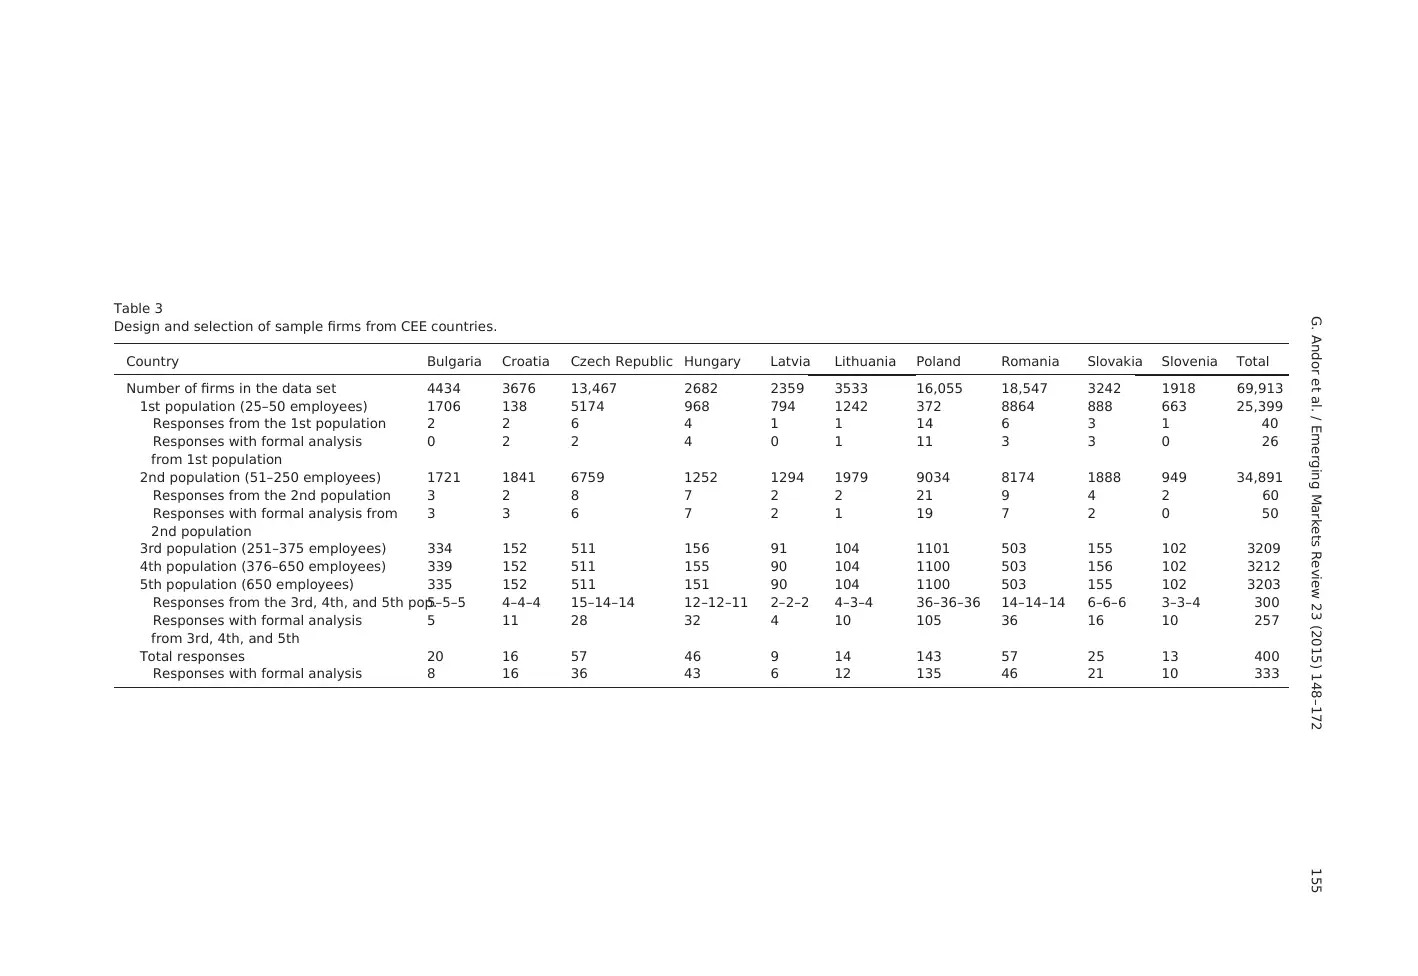
Table 3
Design and selection of sample firms from CEE countries.
Country Bulgaria Croatia Czech Republic Hungary Latvia Lithuania Poland Romania Slovakia Slovenia Total
Number of firms in the data set 4434 3676 13,467 2682 2359 3533 16,055 18,547 3242 1918 69,913
1st population (25–50 employees) 1706 138 5174 968 794 1242 372 8864 888 663 25,399
Responses from the 1st population 2 2 6 4 1 1 14 6 3 1 40
Responses with formal analysis
from 1st population
0 2 2 4 0 1 11 3 3 0 26
2nd population (51–250 employees) 1721 1841 6759 1252 1294 1979 9034 8174 1888 949 34,891
Responses from the 2nd population 3 2 8 7 2 2 21 9 4 2 60
Responses with formal analysis from
2nd population
3 3 6 7 2 1 19 7 2 0 50
3rd population (251–375 employees) 334 152 511 156 91 104 1101 503 155 102 3209
4th population (376–650 employees) 339 152 511 155 90 104 1100 503 156 102 3212
5th population (650 employees) 335 152 511 151 90 104 1100 503 155 102 3203
Responses from the 3rd, 4th, and 5th pop.5–5–5 4–4–4 15–14–14 12–12–11 2–2–2 4–3–4 36–36–36 14–14–14 6–6–6 3–3–4 300
Responses with formal analysis
from 3rd, 4th, and 5th
5 11 28 32 4 10 105 36 16 10 257
Total responses 20 16 57 46 9 14 143 57 25 13 400
Responses with formal analysis 8 16 36 43 6 12 135 46 21 10 333
155G. Andor et al. / Emerging Markets Review 23 (2015) 148–172
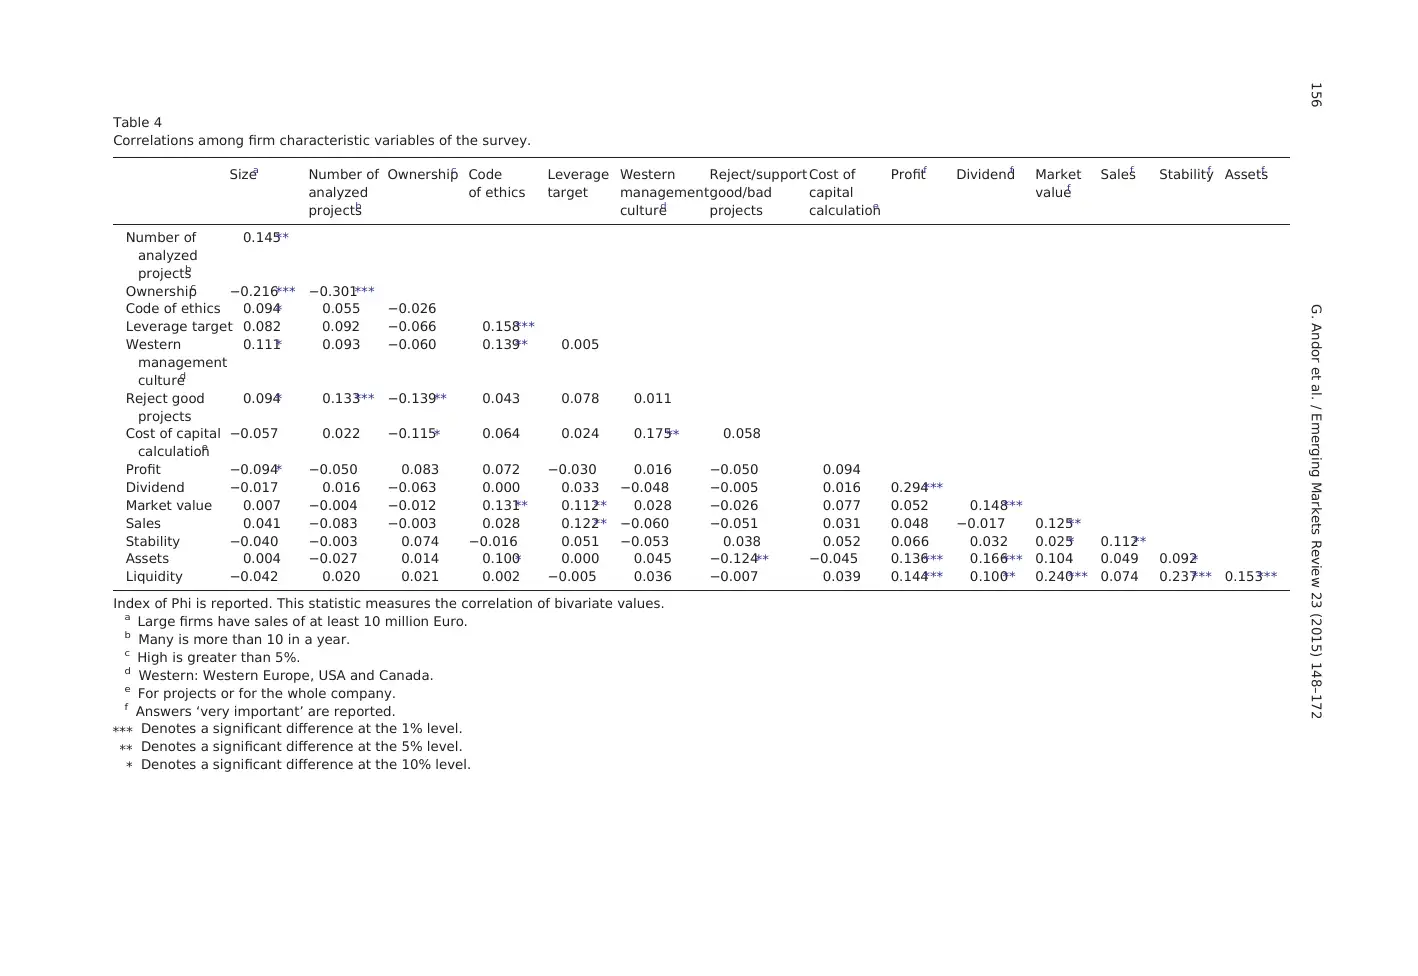
Table 4
Correlations among firm characteristic variables of the survey.
Sizea Number of
analyzed
projectsb
Ownershipc Code
of ethics
Leverage
target
Western
management
cultured
Reject/support
good/bad
projects
Cost of
capital
calculatione
Profitf Dividendf Market
valuef
Salesf Stabilityf Assetsf
Number of
analyzed
projectsb
0.145⁎⁎
Ownershipc −0.216⁎⁎⁎ −0.301⁎⁎⁎
Code of ethics 0.094⁎ 0.055 −0.026
Leverage target 0.082 0.092 −0.066 0.158⁎⁎⁎
Western
management
cultured
0.111⁎ 0.093 −0.060 0.139⁎⁎ 0.005
Reject good
projects
0.094⁎ 0.133⁎⁎⁎ −0.139⁎⁎ 0.043 0.078 0.011
Cost of capital
calculatione
−0.057 0.022 −0.115⁎ 0.064 0.024 0.175⁎⁎ 0.058
Profit −0.094⁎ −0.050 0.083 0.072 −0.030 0.016 −0.050 0.094
Dividend −0.017 0.016 −0.063 0.000 0.033 −0.048 −0.005 0.016 0.294⁎⁎⁎
Market value 0.007 −0.004 −0.012 0.131⁎⁎ 0.112⁎⁎ 0.028 −0.026 0.077 0.052 0.148⁎⁎⁎
Sales 0.041 −0.083 −0.003 0.028 0.122⁎⁎ −0.060 −0.051 0.031 0.048 −0.017 0.125⁎⁎
Stability −0.040 −0.003 0.074 −0.016 0.051 −0.053 0.038 0.052 0.066 0.032 0.025⁎ 0.112⁎⁎
Assets 0.004 −0.027 0.014 0.100⁎ 0.000 0.045 −0.124⁎⁎ −0.045 0.136⁎⁎⁎ 0.166⁎⁎⁎ 0.104 0.049 0.092⁎
Liquidity −0.042 0.020 0.021 0.002 −0.005 0.036 −0.007 0.039 0.144⁎⁎⁎ 0.100⁎⁎ 0.240⁎⁎⁎ 0.074 0.237⁎⁎⁎ 0.153⁎⁎⁎
Index of Phi is reported. This statistic measures the correlation of bivariate values.
a Large firms have sales of at least 10 million Euro.
b Many is more than 10 in a year.
c High is greater than 5%.
d Western: Western Europe, USA and Canada.
e For projects or for the whole company.
f Answers ‘very important’ are reported.
⁎⁎⁎ Denotes a significant difference at the 1% level.
⁎⁎ Denotes a significant difference at the 5% level.
⁎ Denotes a significant difference at the 10% level.
156 G. Andor et al. / Emerging Markets Review 23 (2015) 148–172
of employees between 251 and 375 belong to the 3rd population, large firms with number of employees be-
tween 376 to 650 belong to the 4th, and large firms with number of employees over 650 are put into the 5th
population. We drop the firms with missing data. As a result, we lose about 10% of the total firms from the data
set. However, the number of firms included in each population is at least ten times larger than the expected
response numbers. Finally, we include only those firms that conduct formal capital budgeting analysis.
The number of expected responses for each population is determined in advance. Our goal is to collect 400
usable responses that represent small, medium, and large firms from each of the ten CEE countries. We choose
10% of the total responses from the first population, 15% from the second population, and 25% from each of the
third, fourth, and fifth populations. This implies that our sample consists of 100 responses (that is, 25%) from
smaller companies and 300 (that is, 75%) from larger companies — considering the typical company size for
this region. Table 3 reports the population and expected number of responses from each of the five popula-
tions for each country. A separate row in Table 3 shows the number of respondent firms from each of the
ten countries. For example, the largest number of firms represented in our sample is drawn from Poland
(143 firms), while the smallest number of firms is drawn from Latvia (9 firms).
3.2. Delivery and response
Following Graham and Harvey's (2001) survey, we initially developed our questionnaires in English and
then have them translated into ten languages. This process has raised some challenging issues here. Although
these countries have relatively small populations and are located in close proximity to each other, languages
spoken in the CEE region vary significantly across countries. Moreover, there is no common spoken language
in the CEE region even though the knowledge of English has become increasingly important over the past de-
cade. Given the low level of proficiency and comprehension of the English language among native people in
this region, we do not use an English form of the questionnaire. Instead, we develop questionnaires in ten
native languages for each country in the CEE region. However, when we translate the questionnaires we
face several other challenges. First, even though business managers from CEE countries are more likely to
be familiar with modern corporate finance literature in terms of their local language, they are less likely to
be familiar with the terminology written in the English language. Second, business managers may use special
words in their local language as the equivalent to a given English term. Third, there have been large gaps
between newly developed academic jargons and everyday slangs used by local managers in these countries.
To overcome such challenges encountered in translating the survey questionnaires, we conduct a phone
survey in the respondents' native languages instead of conducting mail surveys. Oral interviews provide us
the opportunity to interact with respondents and help them understand the terminology and special
meanings associated with corporate finance theory and practice.
Phone interviews were carried out during the 2007–2009 period with the assistance of a multinational
polling company that had a professional call center. Operators are native speakers of the local languages
and are trained on the corporate finance aspects of the survey by the authors of this study.For example,
prior to conducting any phone interviews, each caller had to take part in a special professional course present-
157G. Andor et al. / Emerging Markets Review 23 (2015) 148–172
Secure Best Marks with AI Grader
Need help grading? Try our AI Grader for instant feedback on your assignments.
details about capital budgeting practices are not asked at all, and we collect these questionnaires separately.
Our survey finds that 83% of the respondents (333 out of 400 sample firms) do make formal capital budgeting
analyses. It is surprising that some of the large firms in the CEE region make capital budgeting decisions with-
out making any formal written or quantitative analyses. These findings may be attributed to lack of availability
of reliable data.
4. Survey results
4.1. Correlation analysis of demographic variables
We use several binary dummy variables to describe sample firm characteristics. The variable used to mea-
sure the effect of firm size is ‘size.’ Size is equal to one (large) if a firm's sales revenue is greater than 10 million
Euros; otherwise it is zero (small). Based on this criterion, our survey shows that one-third of our sample firms
in CEE countries are ‘small’ and two-thirds of our sample firms are ‘large.’ The variable used to describe the
number of projects analyzed by a firm in a given year is ‘number of analyzed projects.’ Number of analyzed
projects is equal to one (many) if a firm analyzes more than ten projects in a year11; otherwise it is zero
(few). The variable used to measure the effect of executive ownership is ‘ownership.’ Ownership is equal to
one (high) if the management owns more than 5% of the company; otherwise it is zero (low). Firms respond
‘yes’ to the question related to code of ethics if they have written documents on ethical considerations.12‘Code
of ethics’ is equal to one (yes) if a firm adheres to a written code of ethics; otherwise it is zero (no). Similarly, if
the firm has a target financial leverage ratio, the variable ‘leverage target’ is equal to one (yes); otherwise it is
zero (no).13 The ‘Western management culture’ variable is used to measure the influence of Western manage-
ment culture on capital budgeting practices of CEE firms. Western management culture is equal to one (yes) if
the company reports a dominance of a foreign management culture that is rooted in Western culture such as
Western Europe, USA, or Canada14; otherwise it is zero. The variable ‘reject (support) bad (good) project’ is
designed to address other factors beyond formal capital budgeting analysis that may affect management
decisions on the rejection of a ‘good’ project or acceptance of a ‘bad’ project.15 Reject (support) bad (good)
project is equal to one (yes) if the firm rejects a good project or accepts a bad project; otherwise it is zero.
We also ask whether firms use a given value for cost of capital for all projects or different costs of capitals
for each project. The response to the ‘cost of capital calculation’ variable is ‘projects’ when the company
makes calculations for each project and ‘cost of capital calculation’ is ‘company’ when firms make only one
calculation for the entire firm and use this rate for all its projects.‘Cost of capital calculation’ variable is
equal to one (projects); otherwise it is zero (company).
Table 4 presents correlations among the demographic variables. The results show that large firms have a
lower proportion of management ownership, which is consistent with evidence reported in Graham and
Harvey (2001) study. Even though large companies operating in CEE countries are more likely to evaluate a
higher number of projects than small–medium firms, a number of good projects can be rejected by top man-
158 G. Andor et al. / Emerging Markets Review 23 (2015) 148–172
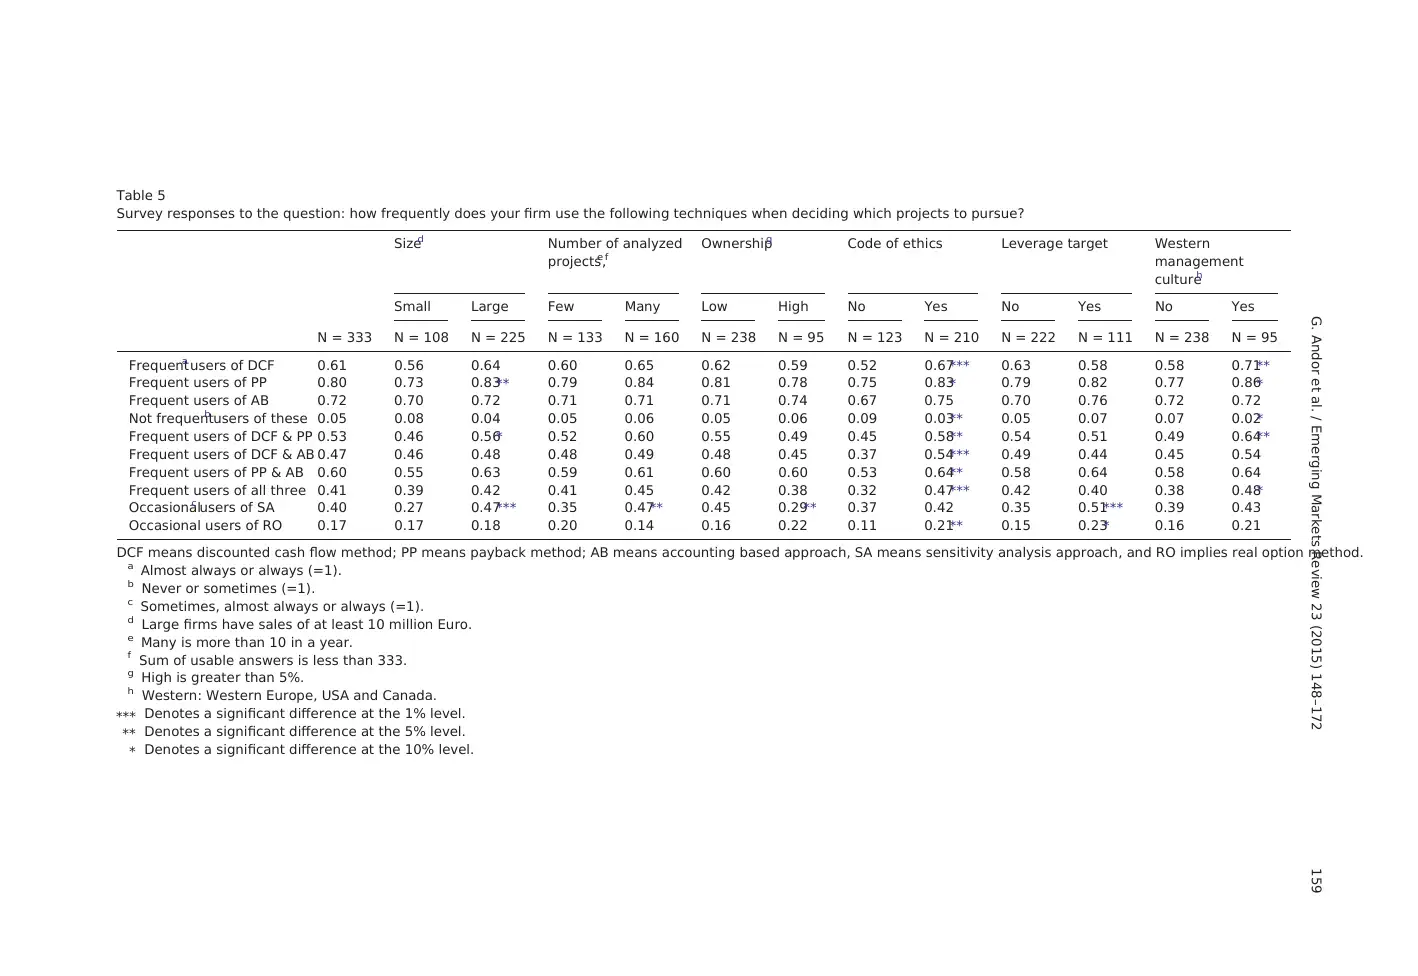
Table 5
Survey responses to the question: how frequently does your firm use the following techniques when deciding which projects to pursue?
Sized Number of analyzed
projectse,f
Ownershipg Code of ethics Leverage target Western
management
cultureh
Small Large Few Many Low High No Yes No Yes No Yes
N = 333 N = 108 N = 225 N = 133 N = 160 N = 238 N = 95 N = 123 N = 210 N = 222 N = 111 N = 238 N = 95
Frequenta users of DCF 0.61 0.56 0.64 0.60 0.65 0.62 0.59 0.52 0.67⁎⁎⁎ 0.63 0.58 0.58 0.71⁎⁎
Frequent users of PP 0.80 0.73 0.83⁎⁎ 0.79 0.84 0.81 0.78 0.75 0.83⁎ 0.79 0.82 0.77 0.86⁎
Frequent users of AB 0.72 0.70 0.72 0.71 0.71 0.71 0.74 0.67 0.75 0.70 0.76 0.72 0.72
Not frequentb users of these 0.05 0.08 0.04 0.05 0.06 0.05 0.06 0.09 0.03⁎⁎ 0.05 0.07 0.07 0.02⁎
Frequent users of DCF & PP 0.53 0.46 0.56⁎ 0.52 0.60 0.55 0.49 0.45 0.58⁎⁎ 0.54 0.51 0.49 0.64⁎⁎
Frequent users of DCF & AB 0.47 0.46 0.48 0.48 0.49 0.48 0.45 0.37 0.54⁎⁎⁎ 0.49 0.44 0.45 0.54
Frequent users of PP & AB 0.60 0.55 0.63 0.59 0.61 0.60 0.60 0.53 0.64⁎⁎ 0.58 0.64 0.58 0.64
Frequent users of all three 0.41 0.39 0.42 0.41 0.45 0.42 0.38 0.32 0.47⁎⁎⁎ 0.42 0.40 0.38 0.48⁎
Occasionalc users of SA 0.40 0.27 0.47⁎⁎⁎ 0.35 0.47⁎⁎ 0.45 0.29⁎⁎ 0.37 0.42 0.35 0.51⁎⁎⁎ 0.39 0.43
Occasional users of RO 0.17 0.17 0.18 0.20 0.14 0.16 0.22 0.11 0.21⁎⁎ 0.15 0.23⁎ 0.16 0.21
DCF means discounted cash flow method; PP means payback method; AB means accounting based approach, SA means sensitivity analysis approach, and RO implies real option method.
a Almost always or always (=1).
b Never or sometimes (=1).
c Sometimes, almost always or always (=1).
d Large firms have sales of at least 10 million Euro.
e Many is more than 10 in a year.
f Sum of usable answers is less than 333.
g High is greater than 5%.
h Western: Western Europe, USA and Canada.
⁎⁎⁎ Denotes a significant difference at the 1% level.
⁎⁎ Denotes a significant difference at the 5% level.
⁎ Denotes a significant difference at the 10% level.
159G. Andor et al. / Emerging Markets Review 23 (2015) 148–172
4.2. Capital budgeting methods in Central and Eastern Europe
According to the theory of capital budgeting, it is generally accepted, that the proper method for invest-
ment project valuation is based on the DCF technique. There are two basic types of DCF approaches: (1) the
internal rate of return (IRR, hereafter) method and (2) the net present value (NPV, hereafter) method. The
IRR method examines whether the project future cash flows produce higher average yearly yield than the
average capital market investment with similar risk.
The NPV method examines whether the present value of the discounted project's future cash flows is
higher than the present value of the investment cash flows. Despite the fact that the two methods are theo-
retically identical, the two concepts were treated separately, mainly due to the multiple root problem associ-
ated with the IRR approach. While the NPV calculation has always a mathematically unique result, the IRR
calculation can be derived only from trial and error, and as the function is a polynomial of order n, it has n
roots. Recent studies, however, solved this issue (e.g. Hazen, 2003; Osborne, 2010; Weber, 2014 have provid-
ed solutions to this hundred-year-old debate). The findings of the above studies imply that a proper IRR
always exists. It is unique, and can be compared to the cost of capital of the project. Thus, both IRR and NPV
approaches used to make capital budgeting decisions are consistent. Hence, our survey is different from the
earlier studies.In this study,we do not distinguish between the uses of the two methods.Further,our
study does not distinguish between the use of NPV and IRR because previous studies do not find any survey
evidence on the use of only one method.
According to the corporate finance theory there are many versions of NPV calculation, such as adjusted
present value (APV), free cash flow (FCF), or equity cash flow (ECF) methods. All these methods are built
upon the shareholder value paradigm advanced by Marshall, Markowitz, Sharpe, Modigliani, Miller, Fama,
Treynor, Black etc., and all build on the same DCF concept. We believe that if both methods are correctly
used capital budgeting decisions will lead to the same result. However, the DCF method does not account
for the flexibility of the project's investment. In such case, capital budgeting decisions call for the real option
(RO, hereafter) method. In addition to DCF analysis, corporate managers sometimes use sensitivity analysis
(SA) method which is considered to be a more sophisticated approach to measure project's risk.
To study capital budgeting practices in the CEE region, we ask respondents whether they conduct any
formal capital budgeting analysis. Next, we ask whether they use any kind of DCF technique such as IRR,
profitability index (PI, hereafter), NPV or its variants like APV, ECF or FCF. Then we ask separately wheth-
er they use the simple PP method since this method is based on cash flows but does not utilize a
discounting technique.16 For this reason, the discounted payback period (hereafter, DPP) is considered
as a type of DCF method.17
Then we ask whether they use any kind of accounting-based (AB) such as accounting rate of return (ARR),
return on investment (ROI),return on assets (ROA),and simple earnings multiples.18 These valuation
methods do not use any kind of discount rates, and the calculations are mainly based on accounting data.
Following Graham and Harvey (2001) and Brounen et al. (2004), we also ask respondents whether they
use more advanced methods (‘modern’techniques) like sensitivity analysis (SA) and real option (RO)
19
160 G. Andor et al. / Emerging Markets Review 23 (2015) 148–172
Paraphrase This Document
Need a fresh take? Get an instant paraphrase of this document with our AI Paraphraser
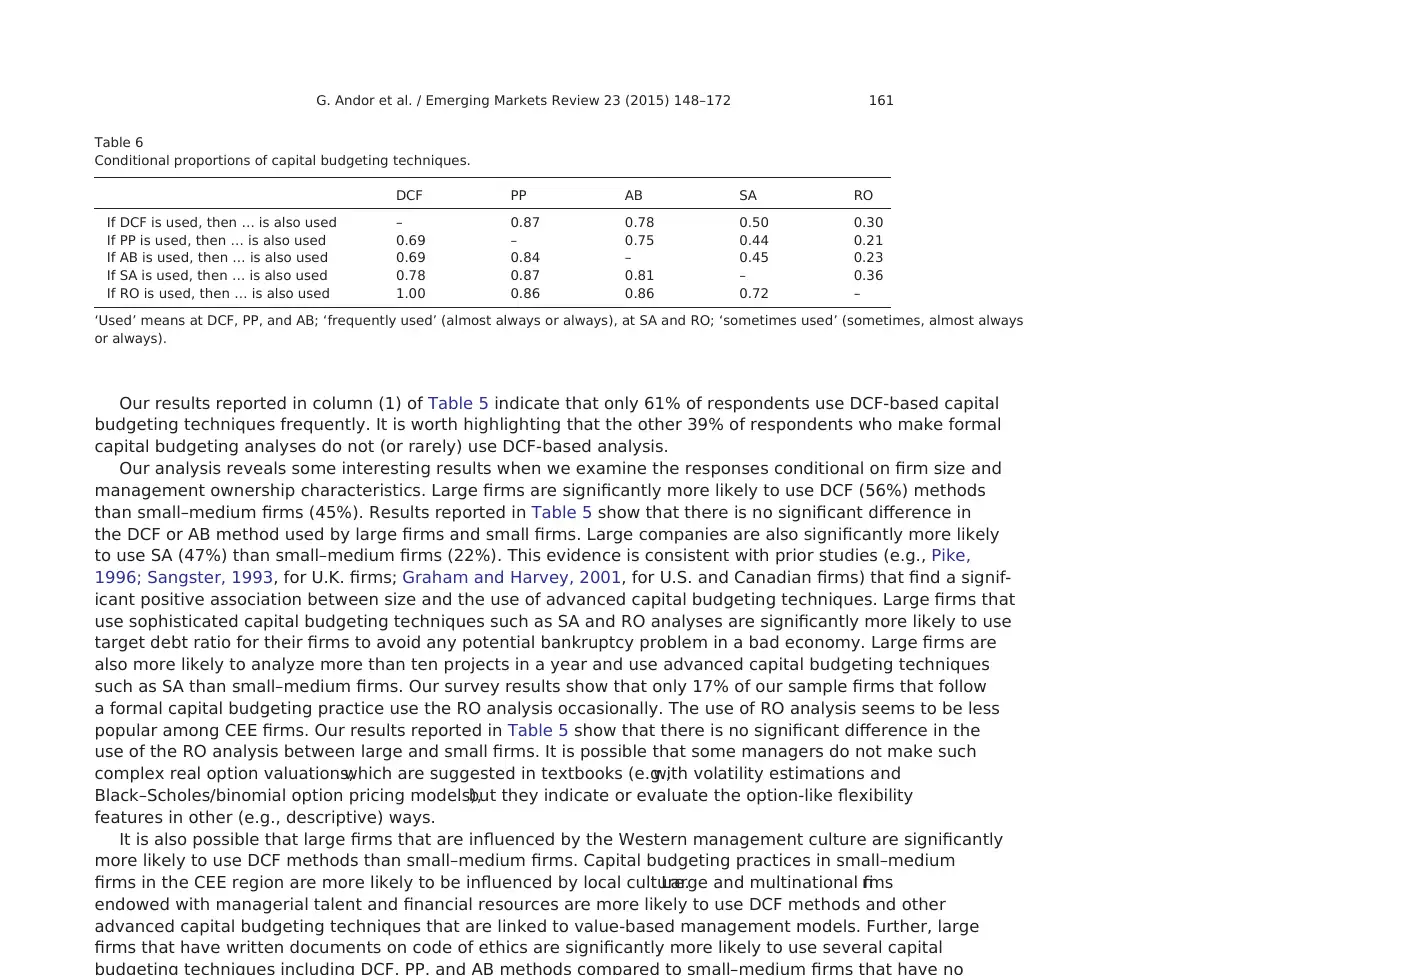
Our results reported in column (1) of Table 5 indicate that only 61% of respondents use DCF-based capital
budgeting techniques frequently. It is worth highlighting that the other 39% of respondents who make formal
capital budgeting analyses do not (or rarely) use DCF-based analysis.
Our analysis reveals some interesting results when we examine the responses conditional on firm size and
management ownership characteristics. Large firms are significantly more likely to use DCF (56%) methods
than small–medium firms (45%). Results reported in Table 5 show that there is no significant difference in
the DCF or AB method used by large firms and small firms. Large companies are also significantly more likely
to use SA (47%) than small–medium firms (22%). This evidence is consistent with prior studies (e.g., Pike,
1996; Sangster, 1993, for U.K. firms; Graham and Harvey, 2001, for U.S. and Canadian firms) that find a signif-
icant positive association between size and the use of advanced capital budgeting techniques. Large firms that
use sophisticated capital budgeting techniques such as SA and RO analyses are significantly more likely to use
target debt ratio for their firms to avoid any potential bankruptcy problem in a bad economy. Large firms are
also more likely to analyze more than ten projects in a year and use advanced capital budgeting techniques
such as SA than small–medium firms. Our survey results show that only 17% of our sample firms that follow
a formal capital budgeting practice use the RO analysis occasionally. The use of RO analysis seems to be less
popular among CEE firms. Our results reported in Table 5 show that there is no significant difference in the
use of the RO analysis between large and small firms. It is possible that some managers do not make such
complex real option valuations,which are suggested in textbooks (e.g.,with volatility estimations and
Black–Scholes/binomial option pricing models),but they indicate or evaluate the option-like flexibility
features in other (e.g., descriptive) ways.
It is also possible that large firms that are influenced by the Western management culture are significantly
more likely to use DCF methods than small–medium firms. Capital budgeting practices in small–medium
firms in the CEE region are more likely to be influenced by local culture.Large and multinational firms
endowed with managerial talent and financial resources are more likely to use DCF methods and other
advanced capital budgeting techniques that are linked to value-based management models. Further, large
firms that have written documents on code of ethics are significantly more likely to use several capital
Table 6
Conditional proportions of capital budgeting techniques.
DCF PP AB SA RO
If DCF is used, then … is also used – 0.87 0.78 0.50 0.30
If PP is used, then … is also used 0.69 – 0.75 0.44 0.21
If AB is used, then … is also used 0.69 0.84 – 0.45 0.23
If SA is used, then … is also used 0.78 0.87 0.81 – 0.36
If RO is used, then … is also used 1.00 0.86 0.86 0.72 –
‘Used’ means at DCF, PP, and AB; ‘frequently used’ (almost always or always), at SA and RO; ‘sometimes used’ (sometimes, almost always
or always).
161G. Andor et al. / Emerging Markets Review 23 (2015) 148–172
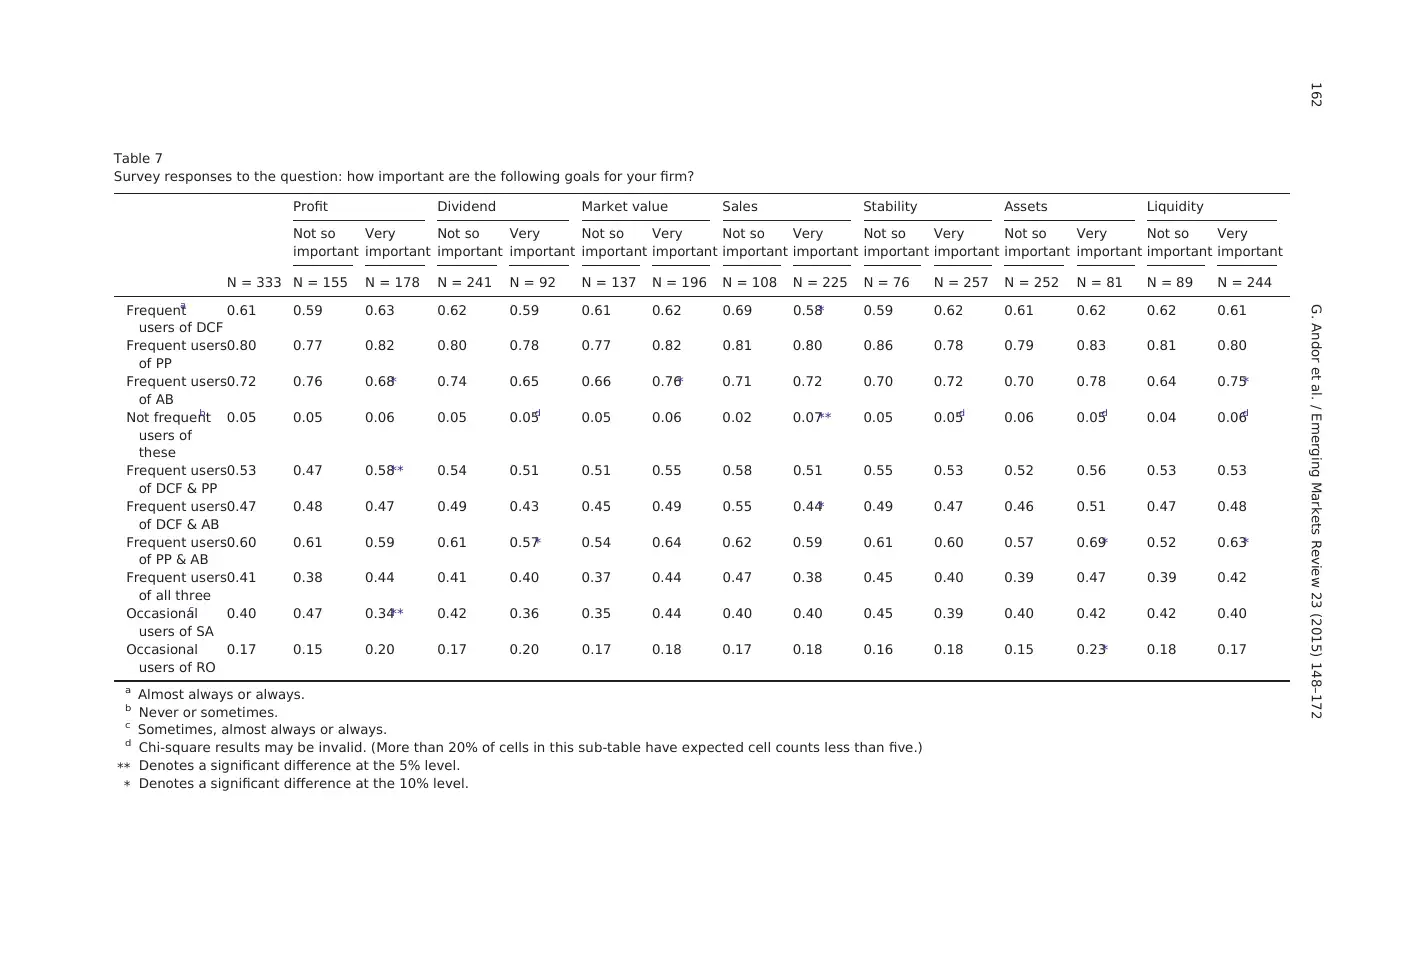
Table 7
Survey responses to the question: how important are the following goals for your firm?
Profit Dividend Market value Sales Stability Assets Liquidity
Not so
important
Very
important
Not so
important
Very
important
Not so
important
Very
important
Not so
important
Very
important
Not so
important
Very
important
Not so
important
Very
important
Not so
important
Very
important
N = 333 N = 155 N = 178 N = 241 N = 92 N = 137 N = 196 N = 108 N = 225 N = 76 N = 257 N = 252 N = 81 N = 89 N = 244
Frequenta
users of DCF
0.61 0.59 0.63 0.62 0.59 0.61 0.62 0.69 0.58⁎ 0.59 0.62 0.61 0.62 0.62 0.61
Frequent users
of PP
0.80 0.77 0.82 0.80 0.78 0.77 0.82 0.81 0.80 0.86 0.78 0.79 0.83 0.81 0.80
Frequent users
of AB
0.72 0.76 0.68⁎ 0.74 0.65 0.66 0.76⁎ 0.71 0.72 0.70 0.72 0.70 0.78 0.64 0.75⁎
Not frequentb
users of
these
0.05 0.05 0.06 0.05 0.05d 0.05 0.06 0.02 0.07⁎⁎ 0.05 0.05d 0.06 0.05d 0.04 0.06d
Frequent users
of DCF & PP
0.53 0.47 0.58⁎⁎ 0.54 0.51 0.51 0.55 0.58 0.51 0.55 0.53 0.52 0.56 0.53 0.53
Frequent users
of DCF & AB
0.47 0.48 0.47 0.49 0.43 0.45 0.49 0.55 0.44⁎ 0.49 0.47 0.46 0.51 0.47 0.48
Frequent users
of PP & AB
0.60 0.61 0.59 0.61 0.57⁎ 0.54 0.64 0.62 0.59 0.61 0.60 0.57 0.69⁎ 0.52 0.63⁎
Frequent users
of all three
0.41 0.38 0.44 0.41 0.40 0.37 0.44 0.47 0.38 0.45 0.40 0.39 0.47 0.39 0.42
Occasionalc
users of SA
0.40 0.47 0.34⁎⁎ 0.42 0.36 0.35 0.44 0.40 0.40 0.45 0.39 0.40 0.42 0.42 0.40
Occasional
users of RO
0.17 0.15 0.20 0.17 0.20 0.17 0.18 0.17 0.18 0.16 0.18 0.15 0.23⁎ 0.18 0.17
a Almost always or always.
b Never or sometimes.
c Sometimes, almost always or always.
d Chi-square results may be invalid. (More than 20% of cells in this sub-table have expected cell counts less than five.)
⁎⁎ Denotes a significant difference at the 5% level.
⁎ Denotes a significant difference at the 10% level.
162 G. Andor et al. / Emerging Markets Review 23 (2015) 148–172
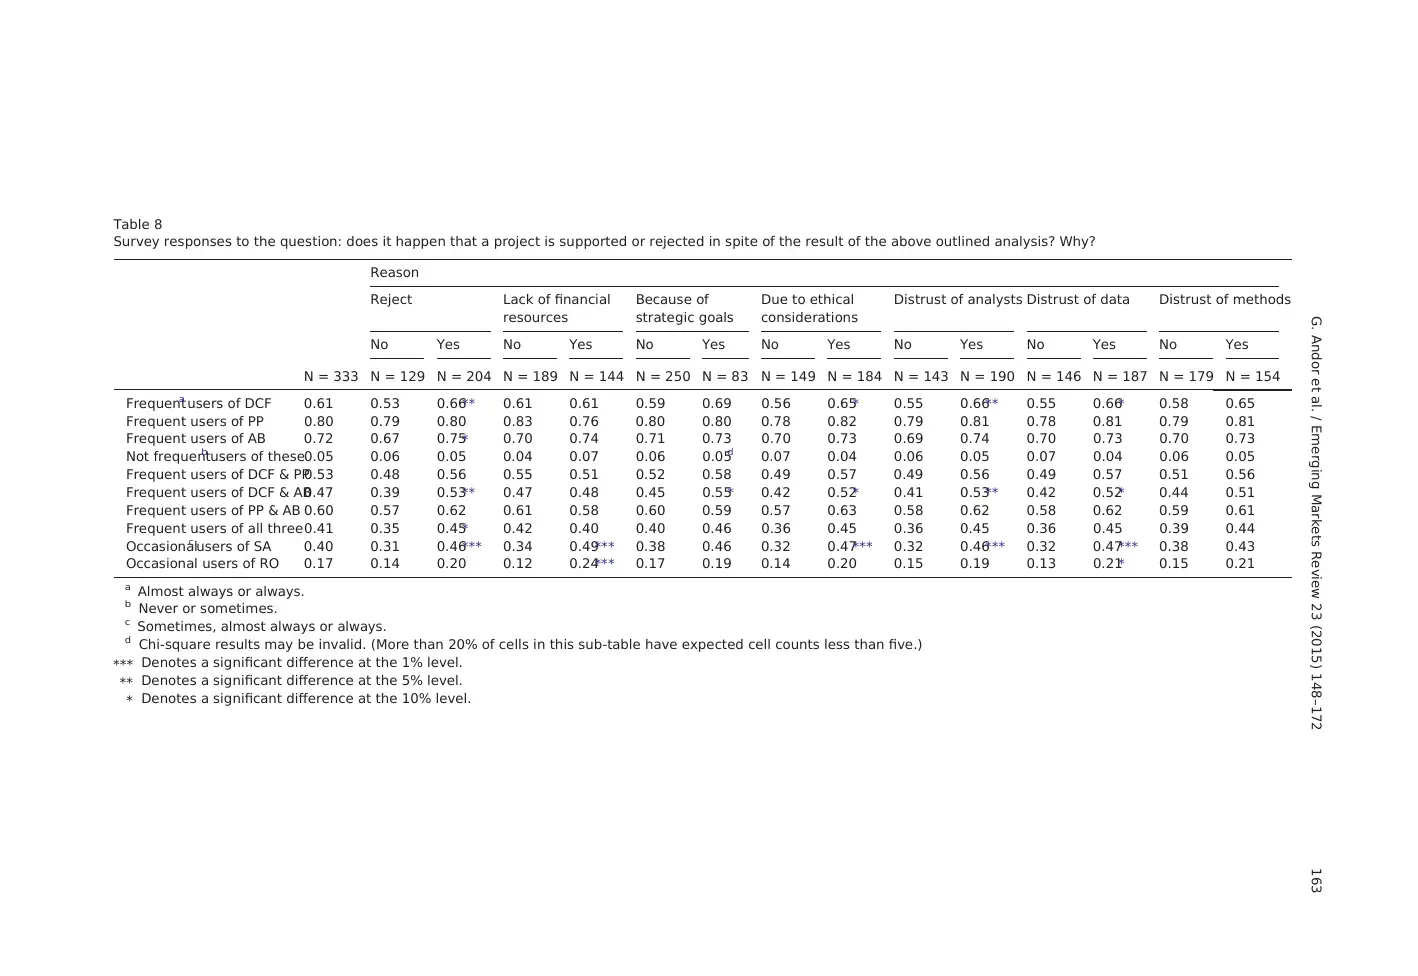
Table 8
Survey responses to the question: does it happen that a project is supported or rejected in spite of the result of the above outlined analysis? Why?
Reason
Reject Lack of financial
resources
Because of
strategic goals
Due to ethical
considerations
Distrust of analysts Distrust of data Distrust of methods
No Yes No Yes No Yes No Yes No Yes No Yes No Yes
N = 333 N = 129 N = 204 N = 189 N = 144 N = 250 N = 83 N = 149 N = 184 N = 143 N = 190 N = 146 N = 187 N = 179 N = 154
Frequenta users of DCF 0.61 0.53 0.66⁎⁎ 0.61 0.61 0.59 0.69 0.56 0.65⁎ 0.55 0.66⁎⁎ 0.55 0.66⁎ 0.58 0.65
Frequent users of PP 0.80 0.79 0.80 0.83 0.76 0.80 0.80 0.78 0.82 0.79 0.81 0.78 0.81 0.79 0.81
Frequent users of AB 0.72 0.67 0.75⁎ 0.70 0.74 0.71 0.73 0.70 0.73 0.69 0.74 0.70 0.73 0.70 0.73
Not frequentb users of these0.05 0.06 0.05 0.04 0.07 0.06 0.05d 0.07 0.04 0.06 0.05 0.07 0.04 0.06 0.05
Frequent users of DCF & PP0.53 0.48 0.56 0.55 0.51 0.52 0.58 0.49 0.57 0.49 0.56 0.49 0.57 0.51 0.56
Frequent users of DCF & AB0.47 0.39 0.53⁎⁎ 0.47 0.48 0.45 0.55⁎ 0.42 0.52⁎ 0.41 0.53⁎⁎ 0.42 0.52⁎ 0.44 0.51
Frequent users of PP & AB 0.60 0.57 0.62 0.61 0.58 0.60 0.59 0.57 0.63 0.58 0.62 0.58 0.62 0.59 0.61
Frequent users of all three0.41 0.35 0.45⁎ 0.42 0.40 0.40 0.46 0.36 0.45 0.36 0.45 0.36 0.45 0.39 0.44
Occasionalc users of SA 0.40 0.31 0.46⁎⁎⁎ 0.34 0.49⁎⁎⁎ 0.38 0.46 0.32 0.47⁎⁎⁎ 0.32 0.46⁎⁎⁎ 0.32 0.47⁎⁎⁎ 0.38 0.43
Occasional users of RO 0.17 0.14 0.20 0.12 0.24⁎⁎⁎ 0.17 0.19 0.14 0.20 0.15 0.19 0.13 0.21⁎ 0.15 0.21
a Almost always or always.
b Never or sometimes.
c Sometimes, almost always or always.
d Chi-square results may be invalid. (More than 20% of cells in this sub-table have expected cell counts less than five.)
⁎⁎⁎ Denotes a significant difference at the 1% level.
⁎⁎ Denotes a significant difference at the 5% level.
⁎ Denotes a significant difference at the 10% level.
163G. Andor et al. / Emerging Markets Review 23 (2015) 148–172
Secure Best Marks with AI Grader
Need help grading? Try our AI Grader for instant feedback on your assignments.
important’ and 4 being ‘very important’): profit, dividend, market value, sales, stability, and assets.20 Sur-
vey responses reported in Table 7 show that long-term survival of the firm is by far the most important
goal (257 out of 333 responses), indicating that stability of performance is very important for a typical
CEE firm.The second and third most important goals of firms in the CEE region are liquidity (244 out
of 333 responses) and sales (225 out of 333 responses),respectively.The two least popular goals for
firms operating in the CEE region are maximization of dividends (92 out of 333 responses) and maximi-
zation of assets (81 out of 333 responses). These results differ substantially from Brounen et al. (2004)
who surveyed corporate governance practices in Western Europe (the U.K.,the Netherlands,France,
and Germany). Their study finds that maximization of accounting profit is the most important goal for
Western European firms followed by sustainable growth and maximization of market share goals.
Their study finds that maximization of shareholders' wealth is an important goal for British and Dutch
firms, but German and French firms consider the goal of shareholders' wealth maximization to be less
important than optimizing financial leverage.
One of the most important results revealed from survey responses was conditional on several important
company goals. Firms that believe in maximizing profits as an important goal are less likely to use AB methods
and are more likely to use DCF and PP methods. Firms that prefer to maximize sales revenue are significantly
more likely to use the DCF method. These findings suggest that when financial managers have short-term
goals (profit or sales maximization goals), firms are more likely to use simple capital budgeting techniques
such as payback period (PP) or discounted payback period (DPP) rather than NPV or IRR methods that are
considered risk-adjusted discounted cash flow methods. DCF approaches are based on the value maximiza-
tion concept. When firms focus on the profit maximization goal, they are less likely to use sophisticated capital
budgeting techniques such as sensitivity analysis. Not surprisingly, the results reported in Table 7 show that
firms that consider liquidity as the most important goal are significantly more likely to use AB and PP methods
than other firms.
We further analyze the survey responses by asking the following question in our survey: “Does it happen
that a project is supported or rejected by top management despite an unfavorable (favorable) decision based
on formal capital budgeting analyses?” There are several reasons why a good project is rejected by top
management including lack of financial resources, strategic considerations, ethical (moral) reasons, and
lack of reliable data or credible analyses (e.g., availability of appropriate market index data or equity beta of
the firm). Survey results reported in Table 8 confirms this hypothesis: a project can be rejected due to a variety
of reasons despite being supported by DCF-based analysis, which contradicts the theory. The most popular
response is the senior management's distrust in analysts and/or lack of credible sources of data used by
such analysts.
The second most popular response for disapproval of a project despite being supported by data is ethical or
moral considerations. It is possible that some projects may be accepted based on DCF analysis or other sophis-
ticated capital budgeting techniques such as sensitivity analysis and real option analysis, but they may be
rejected by senior management due to ethical and moral issues involving those projects. These results are
consistent with prior studies (e.g.Li et al.,2013; Licht et al,2005) indicating that corporate managerial
164 G. Andor et al. / Emerging Markets Review 23 (2015) 148–172
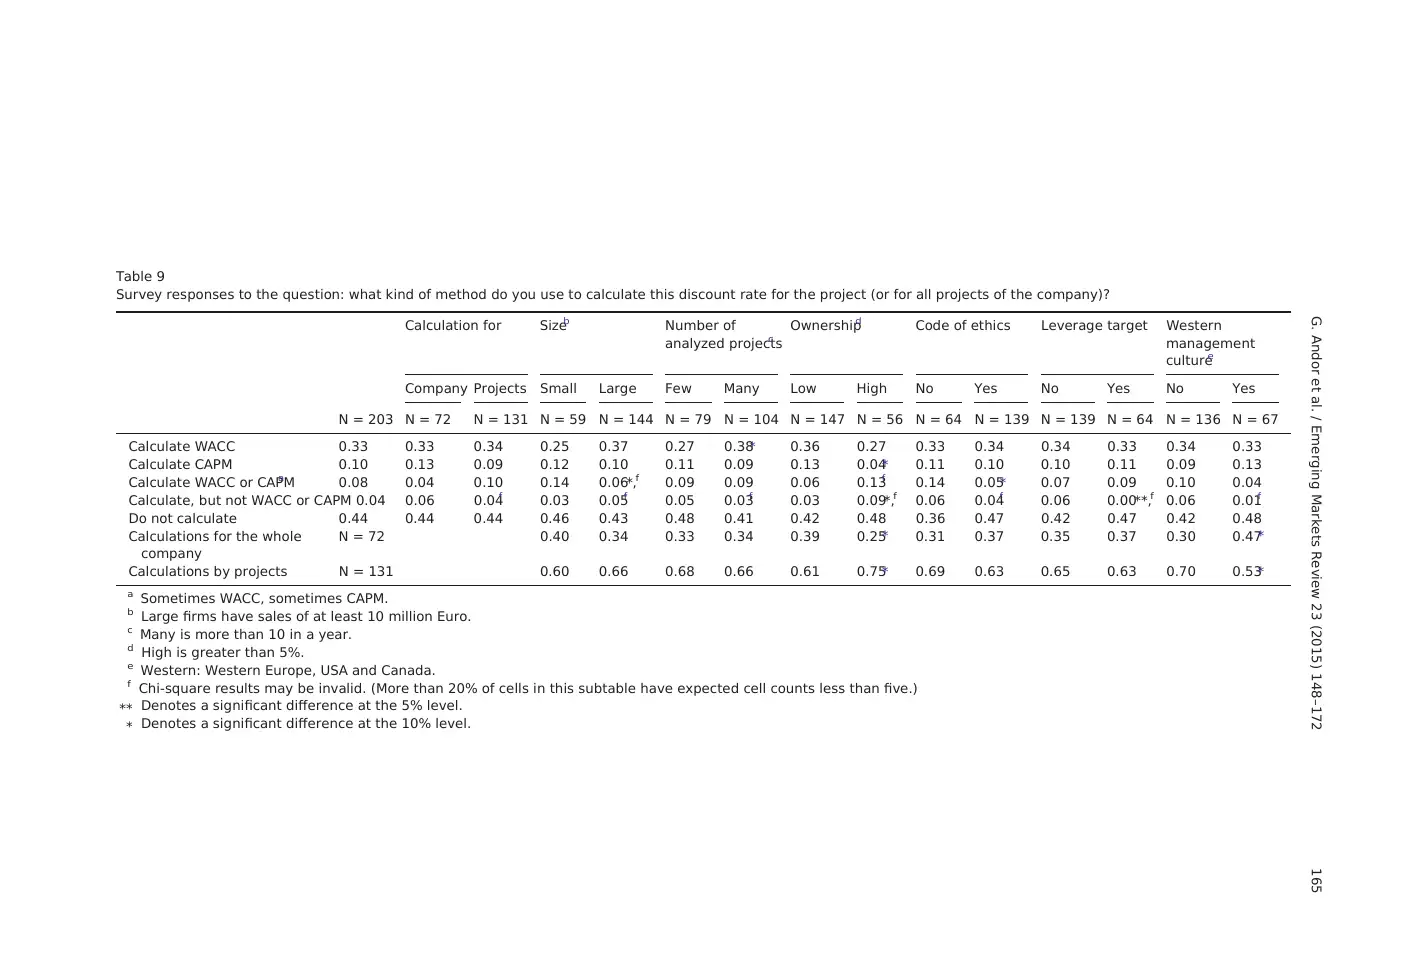
Table 9
Survey responses to the question: what kind of method do you use to calculate this discount rate for the project (or for all projects of the company)?
Calculation for Sizeb Number of
analyzed projectsc
Ownershipd Code of ethics Leverage target Western
management
culturee
Company Projects Small Large Few Many Low High No Yes No Yes No Yes
N = 203 N = 72 N = 131 N = 59 N = 144 N = 79 N = 104 N = 147 N = 56 N = 64 N = 139 N = 139 N = 64 N = 136 N = 67
Calculate WACC 0.33 0.33 0.34 0.25 0.37 0.27 0.38⁎ 0.36 0.27 0.33 0.34 0.34 0.33 0.34 0.33
Calculate CAPM 0.10 0.13 0.09 0.12 0.10 0.11 0.09 0.13 0.04⁎ 0.11 0.10 0.10 0.11 0.09 0.13
Calculate WACC or CAPMa 0.08 0.04 0.10 0.14 0.06⁎,f 0.09 0.09 0.06 0.13f 0.14 0.05⁎ 0.07 0.09 0.10 0.04
Calculate, but not WACC or CAPM 0.04 0.06 0.04f 0.03 0.05f 0.05 0.03f 0.03 0.09⁎,f 0.06 0.04f 0.06 0.00⁎⁎,f 0.06 0.01f
Do not calculate 0.44 0.44 0.44 0.46 0.43 0.48 0.41 0.42 0.48 0.36 0.47 0.42 0.47 0.42 0.48
Calculations for the whole
company
N = 72 0.40 0.34 0.33 0.34 0.39 0.25⁎ 0.31 0.37 0.35 0.37 0.30 0.47⁎
Calculations by projects N = 131 0.60 0.66 0.68 0.66 0.61 0.75⁎ 0.69 0.63 0.65 0.63 0.70 0.53⁎
a Sometimes WACC, sometimes CAPM.
b Large firms have sales of at least 10 million Euro.
c Many is more than 10 in a year.
d High is greater than 5%.
e Western: Western Europe, USA and Canada.
f Chi-square results may be invalid. (More than 20% of cells in this subtable have expected cell counts less than five.)
⁎⁎ Denotes a significant difference at the 5% level.
⁎ Denotes a significant difference at the 10% level.
165G. Andor et al. / Emerging Markets Review 23 (2015) 148–172
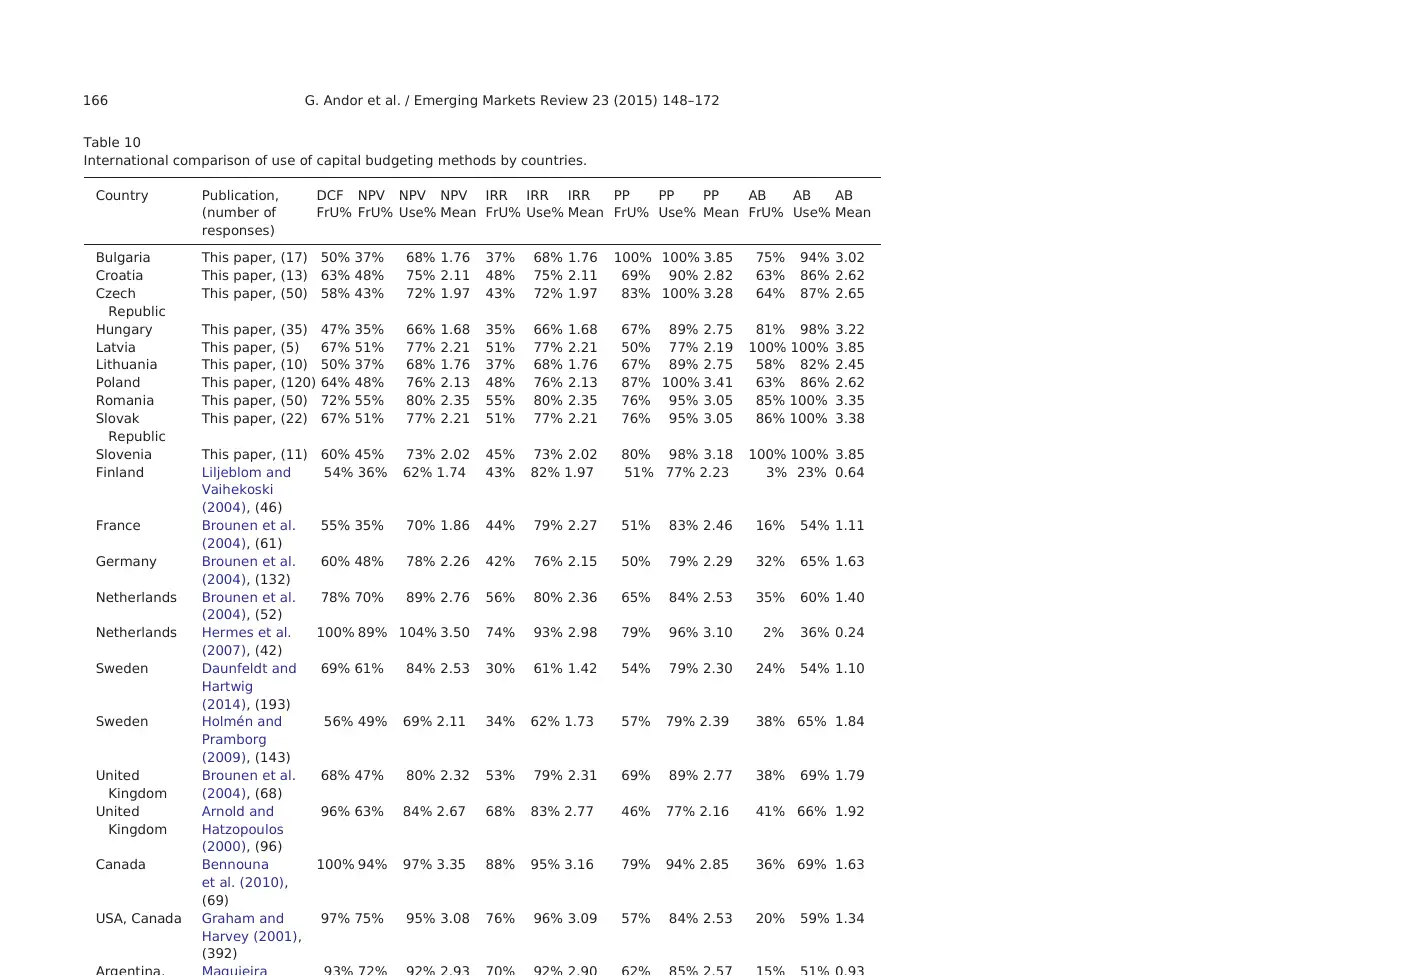
Table 10
International comparison of use of capital budgeting methods by countries.
Country Publication,
(number of
responses)
DCF
FrU%
NPV
FrU%
NPV
Use%
NPV
Mean
IRR
FrU%
IRR
Use%
IRR
Mean
PP
FrU%
PP
Use%
PP
Mean
AB
FrU%
AB
Use%
AB
Mean
Bulgaria This paper, (17) 50% 37% 68% 1.76 37% 68% 1.76 100% 100% 3.85 75% 94% 3.02
Croatia This paper, (13) 63% 48% 75% 2.11 48% 75% 2.11 69% 90% 2.82 63% 86% 2.62
Czech
Republic
This paper, (50) 58% 43% 72% 1.97 43% 72% 1.97 83% 100% 3.28 64% 87% 2.65
Hungary This paper, (35) 47% 35% 66% 1.68 35% 66% 1.68 67% 89% 2.75 81% 98% 3.22
Latvia This paper, (5) 67% 51% 77% 2.21 51% 77% 2.21 50% 77% 2.19 100% 100% 3.85
Lithuania This paper, (10) 50% 37% 68% 1.76 37% 68% 1.76 67% 89% 2.75 58% 82% 2.45
Poland This paper, (120) 64% 48% 76% 2.13 48% 76% 2.13 87% 100% 3.41 63% 86% 2.62
Romania This paper, (50) 72% 55% 80% 2.35 55% 80% 2.35 76% 95% 3.05 85% 100% 3.35
Slovak
Republic
This paper, (22) 67% 51% 77% 2.21 51% 77% 2.21 76% 95% 3.05 86% 100% 3.38
Slovenia This paper, (11) 60% 45% 73% 2.02 45% 73% 2.02 80% 98% 3.18 100% 100% 3.85
Finland Liljeblom and
Vaihekoski
(2004), (46)
54% 36% 62% 1.74 43% 82% 1.97 51% 77% 2.23 3% 23% 0.64
France Brounen et al.
(2004), (61)
55% 35% 70% 1.86 44% 79% 2.27 51% 83% 2.46 16% 54% 1.11
Germany Brounen et al.
(2004), (132)
60% 48% 78% 2.26 42% 76% 2.15 50% 79% 2.29 32% 65% 1.63
Netherlands Brounen et al.
(2004), (52)
78% 70% 89% 2.76 56% 80% 2.36 65% 84% 2.53 35% 60% 1.40
Netherlands Hermes et al.
(2007), (42)
100% 89% 104% 3.50 74% 93% 2.98 79% 96% 3.10 2% 36% 0.24
Sweden Daunfeldt and
Hartwig
(2014), (193)
69% 61% 84% 2.53 30% 61% 1.42 54% 79% 2.30 24% 54% 1.10
Sweden Holmén and
Pramborg
(2009), (143)
56% 49% 69% 2.11 34% 62% 1.73 57% 79% 2.39 38% 65% 1.84
United
Kingdom
Brounen et al.
(2004), (68)
68% 47% 80% 2.32 53% 79% 2.31 69% 89% 2.77 38% 69% 1.79
United
Kingdom
Arnold and
Hatzopoulos
(2000), (96)
96% 63% 84% 2.67 68% 83% 2.77 46% 77% 2.16 41% 66% 1.92
Canada Bennouna
et al. (2010),
(69)
100% 94% 97% 3.35 88% 95% 3.16 79% 94% 2.85 36% 69% 1.63
USA, Canada Graham and
Harvey (2001),
(392)
97% 75% 95% 3.08 76% 96% 3.09 57% 84% 2.53 20% 59% 1.34
166 G. Andor et al. / Emerging Markets Review 23 (2015) 148–172
Paraphrase This Document
Need a fresh take? Get an instant paraphrase of this document with our AI Paraphraser

discount rate for the firm or project.21 We specifically ask whether firms use the WACC or the CAPM to calcu-
late the cost of capital.22 Companies using only CAPM for calculating cost of capital presumably use APV or ECF
methods (or they do not utilize debt). Only 4% of respondents reported ‘special’ cost of capital calculation
methods that are different from WACC or CAPM.
Table 9 contains some surprising results. Thirty-five percent of our sample firms (72 out of 203 responses)
that frequently use DCF-based models use a single, company-wide discount rate to evaluate a project even
though different projects are likely to have different risk characteristics. However, approximately 65% (131
Table 10 (continued)
Country Publication,
(number of
responses)
DCF
FrU%
NPV
FrU%
NPV
Use%
NPV
Mean
IRR
FrU%
IRR
Use%
IRR
Mean
PP
FrU%
PP
Use%
PP
Mean
AB
FrU%
AB
Use%
AB
Mean
Kester et al.
(1999), (16)
Malaysia Kester et al.
(1999), (35)
91% 72% 91% 2.90 69% 89% 2.83 71% 94% 2.88 37% 69% 1.76
Philippines Kester et al.
(1999), (35)
100% 67% 81% 2.75 87% 94% 3.42 72% 100% 2.90 41% 78% 1.90
Singapore Kester et al.
(1999), (54)
85% 60% 86% 2.53 71% 88% 2.89 71% 98% 2.89 47% 80% 2.07
India Singh et al.
(2012), (31)
44% 11% 50% 0.90 52% 79% 2.27 38% 68% 1.78 0% 39% 0.38
South Africa Correia and
Cramer (2008),
(28)
100% 82% 99% 3.25 79% 97% 3.14 54% 79% 2.31 14% 52% 1.00
Total in the
sample
(2415) 84% 57% 84% 2.54 71% 91% 2.90 63% 86% 2.62 19% 56% 1.20
Mean: mean values on a scale of 0–4 (never–almost never–sometimes–almost always–always); FrU%: response rates provided by sample
firms that frequently (almost always or always) use a method; DCF: any discounted cash flow method; NPV: net present value method;
PP, payback method, AB: accounting-based (accounting rate of return) method. Bold numbers: values from surveys; italic numbers:
calculated values.
Notes for Table 10:
1. The following scales are considered as a scale of 0–4 (never–almost never–sometimes–almost always–always): never–rarely–often–
mostly–always in Arnold and Hatzopoulos (2000), and not applicable–not important–moderately important–important–very impor-
tant in Truong et al. (2008).
2. The following scales are converted to a scale of 0–4 (never–almost never–sometimes–almost always–always): 0–3 (never–almost
never–almost always–always) in Bennouna et al. (2010); 0–3 (never–in some cases–secondary–primary) in Liljeblom and Vaihekoski
(2004); 0–5 (not used–unimportant–…–very important) in Both Mendes-Da-Silva and Saito (2014) and Kester et al. (1999). 0–1 (not
used–used) inSingh et al. (2012).
3. Three regression equationsare used at calculations: FrU% = −0.16 + 0.30 mean; use% = 0.31 + 0.21 mean;and DCF
FrU% = −0.16 + 0.19 (NPV mean + IRR mean).(If there were no NPV mean and IRR mean values,equal values for both were
supposEd.)
167G. Andor et al. / Emerging Markets Review 23 (2015) 148–172
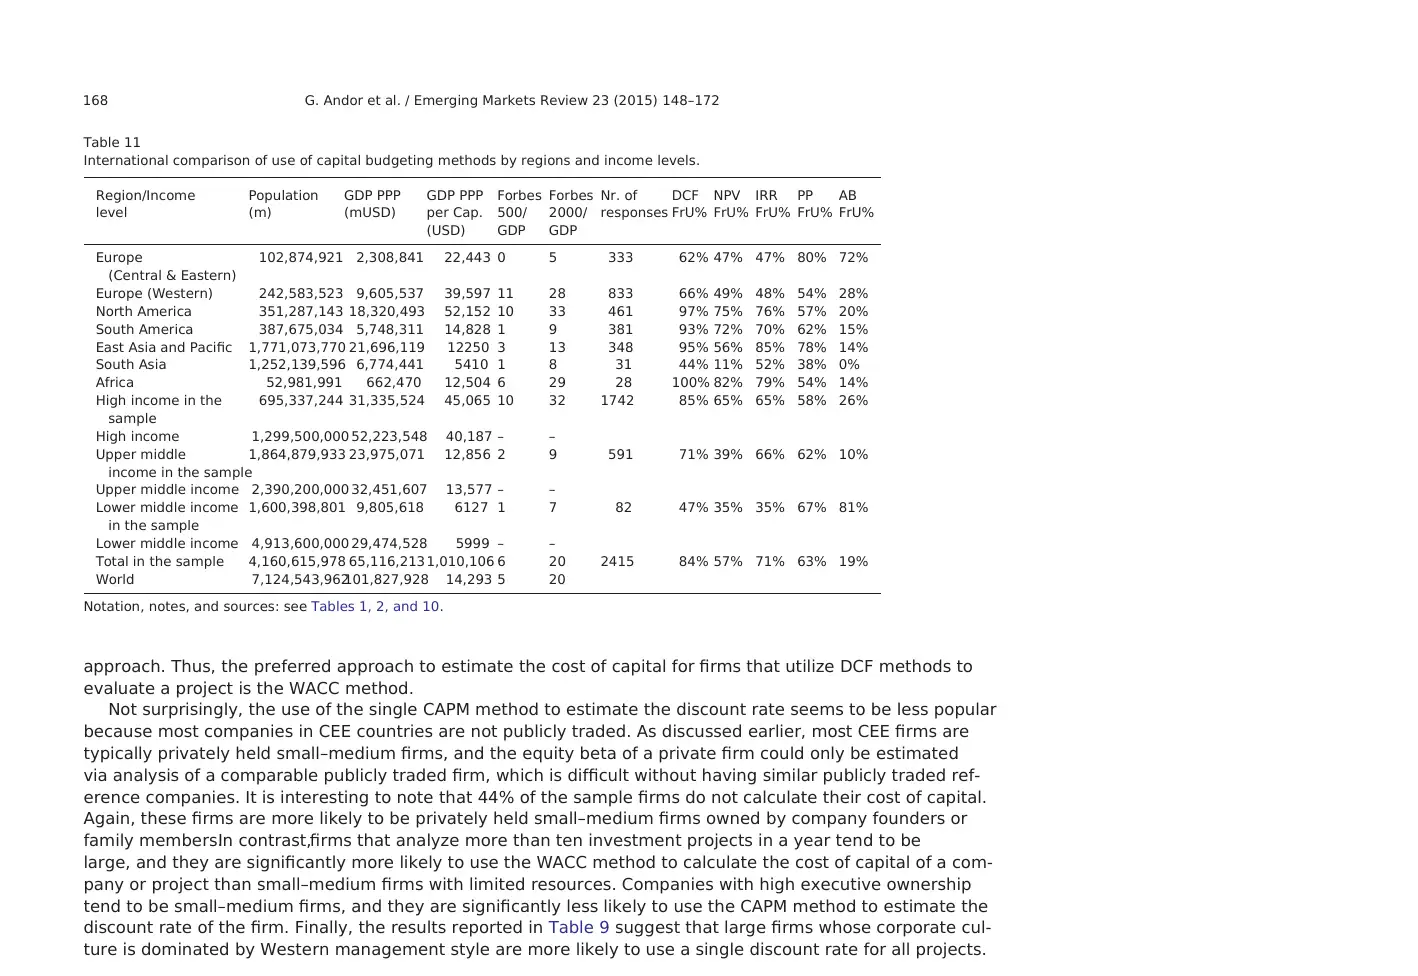
approach. Thus, the preferred approach to estimate the cost of capital for firms that utilize DCF methods to
evaluate a project is the WACC method.
Not surprisingly, the use of the single CAPM method to estimate the discount rate seems to be less popular
because most companies in CEE countries are not publicly traded. As discussed earlier, most CEE firms are
typically privately held small–medium firms, and the equity beta of a private firm could only be estimated
via analysis of a comparable publicly traded firm, which is difficult without having similar publicly traded ref-
erence companies. It is interesting to note that 44% of the sample firms do not calculate their cost of capital.
Again, these firms are more likely to be privately held small–medium firms owned by company founders or
family members.In contrast,firms that analyze more than ten investment projects in a year tend to be
large, and they are significantly more likely to use the WACC method to calculate the cost of capital of a com-
pany or project than small–medium firms with limited resources. Companies with high executive ownership
tend to be small–medium firms, and they are significantly less likely to use the CAPM method to estimate the
discount rate of the firm. Finally, the results reported in Table 9 suggest that large firms whose corporate cul-
ture is dominated by Western management style are more likely to use a single discount rate for all projects.
Table 11
International comparison of use of capital budgeting methods by regions and income levels.
Region/Income
level
Population
(m)
GDP PPP
(mUSD)
GDP PPP
per Cap.
(USD)
Forbes
500/
GDP
Forbes
2000/
GDP
Nr. of
responses
DCF
FrU%
NPV
FrU%
IRR
FrU%
PP
FrU%
AB
FrU%
Europe
(Central & Eastern)
102,874,921 2,308,841 22,443 0 5 333 62% 47% 47% 80% 72%
Europe (Western) 242,583,523 9,605,537 39,597 11 28 833 66% 49% 48% 54% 28%
North America 351,287,143 18,320,493 52,152 10 33 461 97% 75% 76% 57% 20%
South America 387,675,034 5,748,311 14,828 1 9 381 93% 72% 70% 62% 15%
East Asia and Pacific 1,771,073,770 21,696,119 12250 3 13 348 95% 56% 85% 78% 14%
South Asia 1,252,139,596 6,774,441 5410 1 8 31 44% 11% 52% 38% 0%
Africa 52,981,991 662,470 12,504 6 29 28 100% 82% 79% 54% 14%
High income in the
sample
695,337,244 31,335,524 45,065 10 32 1742 85% 65% 65% 58% 26%
High income 1,299,500,000 52,223,548 40,187 – –
Upper middle
income in the sample
1,864,879,933 23,975,071 12,856 2 9 591 71% 39% 66% 62% 10%
Upper middle income 2,390,200,000 32,451,607 13,577 – –
Lower middle income
in the sample
1,600,398,801 9,805,618 6127 1 7 82 47% 35% 35% 67% 81%
Lower middle income 4,913,600,000 29,474,528 5999 – –
Total in the sample 4,160,615,978 65,116,213 1,010,106 6 20 2415 84% 57% 71% 63% 19%
World 7,124,543,962101,827,928 14,293 5 20
Notation, notes, and sources: see Tables 1, 2, and 10.
168 G. Andor et al. / Emerging Markets Review 23 (2015) 148–172
firms in the U.K.; Holmén and Pramborg (2009) and Daunfeldt and Hartwig (2014) for Swedish firms;
Liljeblom and Vaihekoski (2004) for firms in Finland; Hermes et al. (2007) for the Dutch and Chinese firms;
Truong et al. (2008) for Australian firms; Maquieira et al. (2012) for firms in Argentina, Chile, Colombia,
Ecuador, Peru, Uruguay, and Venezuela; Mendes-Da-Silva and Saito (2014) for Brazilian firms; Correia and
Cramer (2008) for South African firms; Singh et al.(2012) for Indian firms; and Kester et al.(1999) for
firms in Australia, Hong Kong, Indonesia, Malaysia, the Philippines, and Singapore. Our goal is to generate a
consistent set of results from these studies so that we can draw an international comparison on the use of cap-
ital budgeting methods among various countries, geographic regions, and income groups.
We encounter some major problems when comparing the previous survey results with ours. Most sur-
veys ask how frequently firms use the different capital budgeting techniques on different scales.We con-
sider the scale of 0–4 used by Graham and Harvey (2001) as the standard scale and ordinal variables:
‘0—never’,‘1—almost never’,‘2—sometimes’, ‘3—almost always’,‘4—always’,where ‘almost always’ and ‘al-
ways’are considered as ‘frequently used’.That standard scale is adopted by Brounen et al.(2004),Correia
and Cramer (2008),Daunfeldt and Hartwig (2014),Hermes et al.(2007),Holmén and Pramborg (2009),
and Maquieira et al.(2012). Arnold and Hatzopoulos (2000) use a similar approach: (‘never’),‘rarely’,
‘often’, ‘mostly’, ‘always’. On the other hand, Truong et al. (2008) use a 0–4 scale but with different ordinal
variables: ‘not applicable’,‘not important’,‘moderately important’,‘important’,‘very important’.Although,
the scale used by Bennouna et al.(2010) is similar,they use a 0–3 scale (‘never’,‘almost never’,‘almost
always’,‘always’).Therefore,we transform their results into a 0–4 scale by multiplying their mean values
by 4/3.While Liljeblom and Vaihekoski (2004) use the 0–3 scale,their ordinal variables (‘never’,‘in some
cases’, ‘secondary’) differ from that of Bennouna et al. (2010).Both Mendes-Da-Silva and Saito (2014)and
Kester et al.(1999) use a 0–5 scale,however the latter's ordinalvariables are similar to Truong et al.
(2008) such as ‘0—not used’,‘1—unimportant’,‘2—somewhat important’,‘3—important’; and ‘4—very
important’.We transform their results by multiplying their mean values by 4/5.
After adjusting all the survey results to a standard 0–4 scale, we focus on the ‘frequently used’ (‘almost al-
ways’ and ‘always’) answers. In some prior studies we can find ‘frequently used’ responses separately, but in
some cases we have to estimate those rates with the help of the (sometimes adjusted) mean values presented
in these studies. Many surveys provide both mean values and frequency of responses for ‘almost always
and always’ (or those can be calculated from other data), and we estimate that means of the survey results
on a 0–4 scale and the frequency of responses for ‘3’ or ‘4’ are found to be highly correlated (Corr = 0.98;
R-square = 0.96; Regression: a = 0.16, b = 0.30). Accordingly, where ‘frequently used’ data is missing, we
are able to estimate those figures (and vice versa).
The second problem we encounter is related to the use of NPV, IRR, and the DCF method. It is very likely
that a firm that uses the DCF method would also use NPV, IRR, or both. One of the goals of our survey is to
investigate whether there is any gap between the capital budgeting theory and practice. Further, we are
interested in learning whether firms frequently use (‘almost always or always’) any DCF method. Similar to
Graham and Harvey (2001) andBrounen et al. (2004), we ask respondents whether they ‘almost always or
always’ use any DCF method. While survey results are consistent in the case of the U.S. and Canada, survey
169G. Andor et al. / Emerging Markets Review 23 (2015) 148–172
Secure Best Marks with AI Grader
Need help grading? Try our AI Grader for instant feedback on your assignments.
We then explored whether such differences in the use of the DCF approach could be attributed to a
country's geographic region.We find that the use of DCF methods is less popular in Western Europe
(especially in Germany and France) as well as in Central and Eastern European countries than in North
American, Asian and Pacific countries.Thus,the theory–practice gap continues to remain as a recurrent
theme in the capitalbudgeting literature,in particular with respect to the use of the DCF method in
Germany, France, Sweden, and Finland, and CEE countries. Our results seem to be consistent with the findings
of prior studies (e.g.,Chew, 1997; La Porta et al., 2000; Li et al,2013; Licht et al.,2005,2007; Rajan and
Zingales, 2003) that suggest corporate finance practices may vary across countries or geographic regions
due to differences in corporate governance and legal systems, institutional settings, and national culture.
Next, we turn to the use of PP method which seems to be quite popular (about 80% on average) in both CEE
countries (former communist countries) and China. These results are not surprising for three reasons. First,
our survey results show that firms in CEE countries prefer liquidity and stability as their most important
goals and the payback method is generally perceived to be related to liquidity and stability goals of such
firms. Second, since emerging markets (e.g., China and CEE countries) are known to suffer from higher market
volatility in general, firms from emerging economies tend to emphasize payback method. Third, Danielson
and Scott (2006) suggest that small firms suffer from capital constraints and therefore,they rely on PP
approach because it focuses on liquidity. Moreover, most firms in CEE countries tend to be small in compar-
ison to those in North America.Therefore,it makes sense why PP method is the most prevalent capital
budgeting technique in CEE countries.
The international comparison results presented in Table 11 show that the use of AB and PP methods vary
widely across countries, geographic regions and income groups. The response rate for the use of AB methods is
significantly higher in CEE countries (72% on average) than that of Western European countries (23% on
average).Prior studies related to capital budgeting practices find that the PP method is widely used in
China (e.g., Hermes et al., 2007) and Latin America (Maquieira et al., 2012). Above findings have significant
implications for capital budgeting practices in emerging markets. Capital markets in emerging economies
are more volatile and relatively less liquid than those in developed economies.Moreover, emerging
economies are dominated by mostly small–medium firms that face capital constraints, and require liquidity
as their top priority when evaluating capital budgets. Hence, corporate managers are primarily concerned
with liquidity needs for their firms (e.g., Maquieira et al., 2012). Therefore, our findings suggest that corporate
managers from emerging markets are more likely to use PP method as their preferred capital budgeting
technique than those from developed markets.
Prior literature (e.g., Hermes et al., 2007) suggests that levels of economic developments have significant
impact on corporate finance practices. Consistent with Hermes et al. (2007) findings, our international compar-
ison results reported in Table 11 (with 2415 responses) indicate a positive relation between the level of
economic development and the use of ‘modern’ capital budgeting techniques such as DCF method. In the case
of the high income countries, the response rate for the use of the DCF method is the highest (85%), while the
response rate for the upper-middle-income countries is lower than that of high income countries (71%). In
the case of the lower-middle income countries,the response rate for the use of DCF method is the least
170 G. Andor et al. / Emerging Markets Review 23 (2015) 148–172
process in place than small–medium firms. Large and multinational firms are more likely to use DCF and other
sophisticated techniques than small and medium firms. One of the interesting findings of our survey is that
despite the use of advanced capital budgeting techniques, including DCF methods and sensitivity analysis
or real option analysis, a good project that is selected based on DCF analysis can be rejected by top manage-
ment due to several other factors such as ethical and moral considerations, lack of financial resources, strategic
fit, trust in the analysts or credible sources of data.
We compare capital budgeting practices across 35 countries, three income groups (high, upper middle, and
lower middle income countries), and seven geographic regions (Central and Eastern Europe, Western Europe,
North America, South America, East Asia and Pacific, South Asia, and Africa). We find significant variations in
the capital budgeting practices across countries, income groups, and geographic regions. Corporate finance prac-
tices across countries, income groups, and geographic regions might differ from one country to other, from high
income countries to lower-middle income countries, or from one geographic region to another due to the diver-
sity of institutional settings, level of economic developments, different national culture, different corporate
governance systems, and to the degree of influence of multinational companies' culture on local firms.
We hope our findings fill a gap in the corporate finance literature and will lead to the development of new
theories or modification of existing ones. We also believe that further research is needed to increase our
understanding of the theory and practice of corporate finance in CEE countries. As a next step, it would be
interesting to extend our work by making direct comparison between the capital budgeting practices of
small–medium firms in the Central and Eastern European and Asia-Pacific countries. Are there significant
variations in capital budgeting practices of small–medium firms across emerging economies in CEE and
Asia-Pacific countries and between the two geographic regions? These questions are beyond the scope of
the current paper but definitely deserve further research.
References
Arnold,G.,Hatzopoulos,P., 2000.The theory–practice gap in capital budgeting: evidence from the United Kingdom.J. Bus.Financ.
Account. 27, 603–626.
Bennouna, K., Meredith, G., Marchant, T., 2010. Improved capital budgeting decision making: evidence from Canada. Manag. Decis. 48
(2), 225–247.
Brav, A., Lehavy, R., 2003. An empirical analysis of analysts' target prices: short-term informativeness and long-term dynamics. J. Financ.
58 (5), 1933–1968.
Brav, A., Graham, J., Harvey, C., Michaely, R., 2005. Payout policy in the 21st century: the data. J. Financ. Econ. 77 (3), 483–527.
Brounen, D., De Jong, A., Koedijk, K., 2004. Corporate finance in Europe: confronting theory with practice. Financ. Manag. 33 (4), 71–101.
Bureau Van Dijk, 2008. Amadeus database. Bureau Van Dijk.
Chew, D., 1997. Studies in International Corporate Finance and Governance Systems: A Comparison of the U.S., Japan, and Europe. Oxford
University Press, Oxford.
Correia, C., Cramer, P., 2008. An analysis of cost of capital, capital structure and capital budgeting practices: a survey of South African
listed companies. Meditari Account. Res. 16 (2), 31–52.
Danielson, M., Scott, J., 2006. The capital budgeting decisions of small business. J. App. Financ. 16 (2), 45–56.
Daunfeldt, S.-O., Hartwig, F., 2014. What determines the use of capital budgeting methods? Evidence from Swedish listed companies.
J. Financ. Econ. 2 (4), 101–112.
Deloitte, 2011. Top 500 Central Europe. Deloitte Central Europe.
European Union, 2003. European Union Directives. Directive 2003/361/EU, European Union.
171G. Andor et al. / Emerging Markets Review 23 (2015) 148–172
Maquieira, C.P., Preve, L.A., Sarria-Allende, V., 2012. Theory and practice of corporate finance: evidence and distinctive features in Latin
America. Emerg. Mark. Rev. 13 (2), 118–148.
Mendes-Da-Silva,W., Saito,R.,2014.Stock exchange listing induces sophistication of capital budgeting.Rev.Adm. Empres.54 (5),
560–574.
Moore, J., Reichert, A., 1983. An analysis of the financial management techniques currently employed by large US corporations. J. Bus.
Financ. Account. 10 (4), 623–645.
Osborne, M.J., 2010. A resolution to the NPV–IRR debate? Q. Rev. Econ. Financ. 50 (2), 234–239.
Pike, R., 1996. A longitudinal survey on capital budgeting practices. J. Bus. Financ. Account. 23 (1), 79–92.
Rajan, R., Zingales, L., 2003. The great reversals: the politics of financial development in the twentieth century. J. Financ. Econ. 69 (1), 5–50.
Sangster, A., 1993. Capital budgeting appraisal techniques: a survey of current usage. J. Bus. Financ. Account. 20 (3), 307–332.
Singh, S., Jain, P.K., Yadav, S.S., 2012. Capital budgeting decisions: evidence from India. J. Adv. Manag. Res. 9 (1), 96–112.
Stulz, R., Williamson, R., 2003. Culture, openness, and finance. J. Financ. Econ. 70, 313–349.
Truong, G., Partington, G., Peat, M., 2008. Cost of capital estimation and capital budgeting practice in Australia. Aust. J. Manag. 33, 1–6.
Weber, T.A., 2014. On the (non-)equivalence of IRR and NPV. J. Math. Econ. 52, 25–39.
The World Bank, 2013. Data by Country. http://data.worldbank.org/about/country-classifications, The World Bank.
172 G. Andor et al. / Emerging Markets Review 23 (2015) 148–172
1 out of 25


Your All-in-One AI-Powered Toolkit for Academic Success.
+13062052269
info@desklib.com
Available 24*7 on WhatsApp / Email
![[object Object]](/_next/static/media/star-bottom.7253800d.svg)
Unlock your academic potential
© 2024 | Zucol Services PVT LTD | All rights reserved.