A Sustainable System: Analyzing Energy Efficiency in NSW Homes
VerifiedAdded on 2023/06/04
|11
|2172
|405
Report
AI Summary
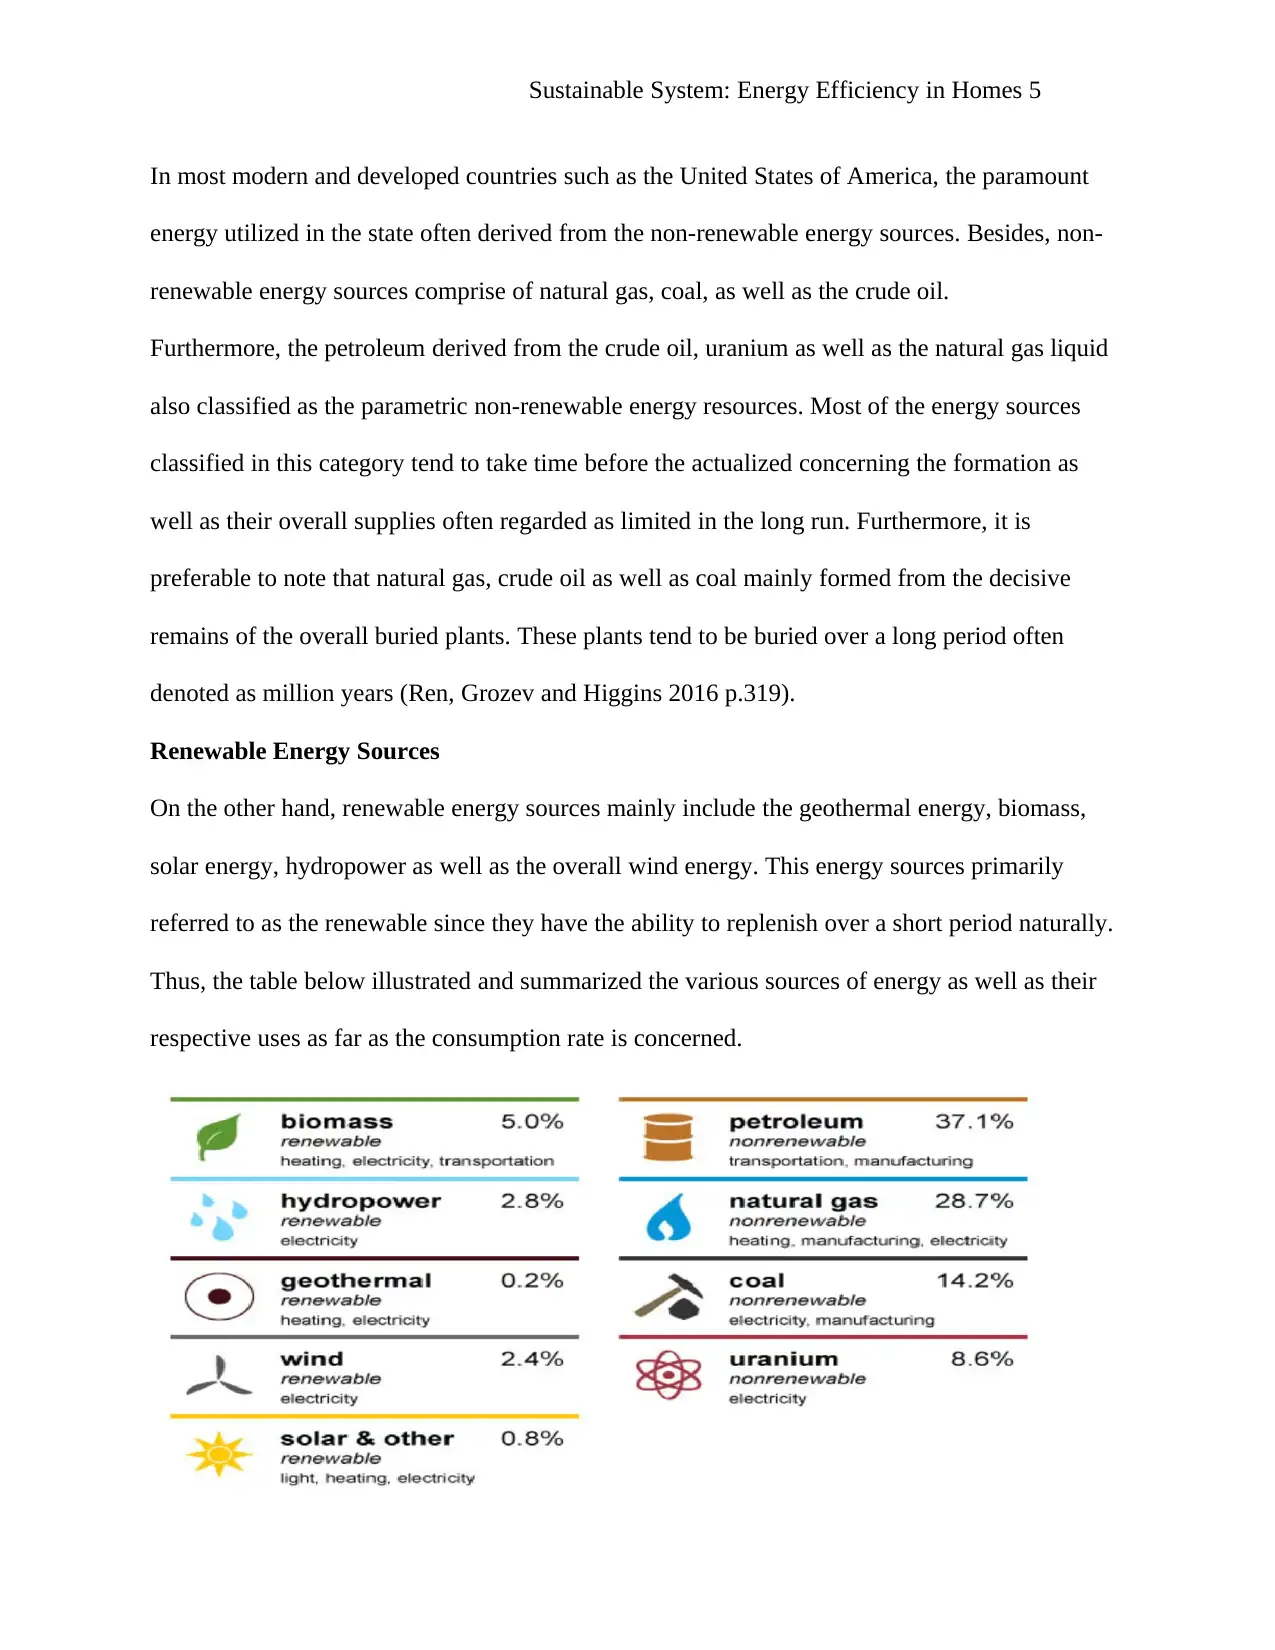
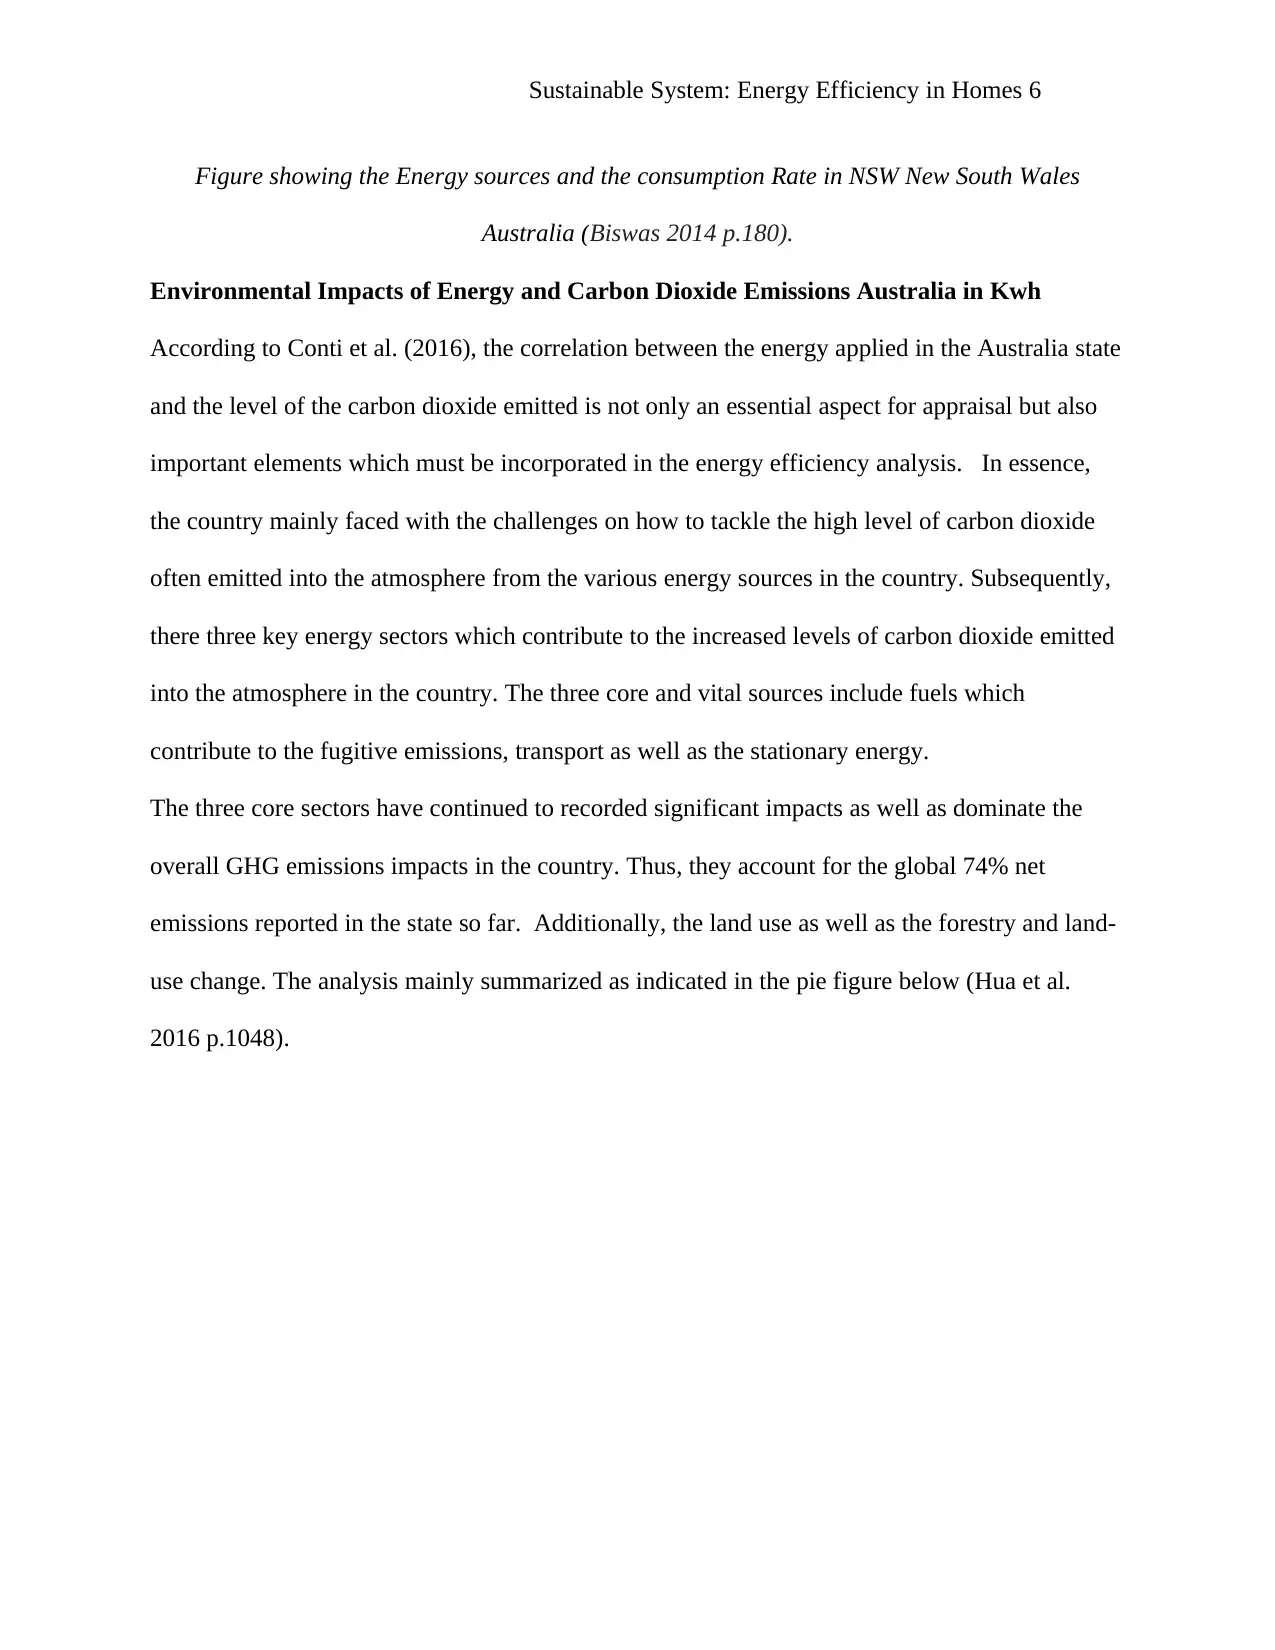
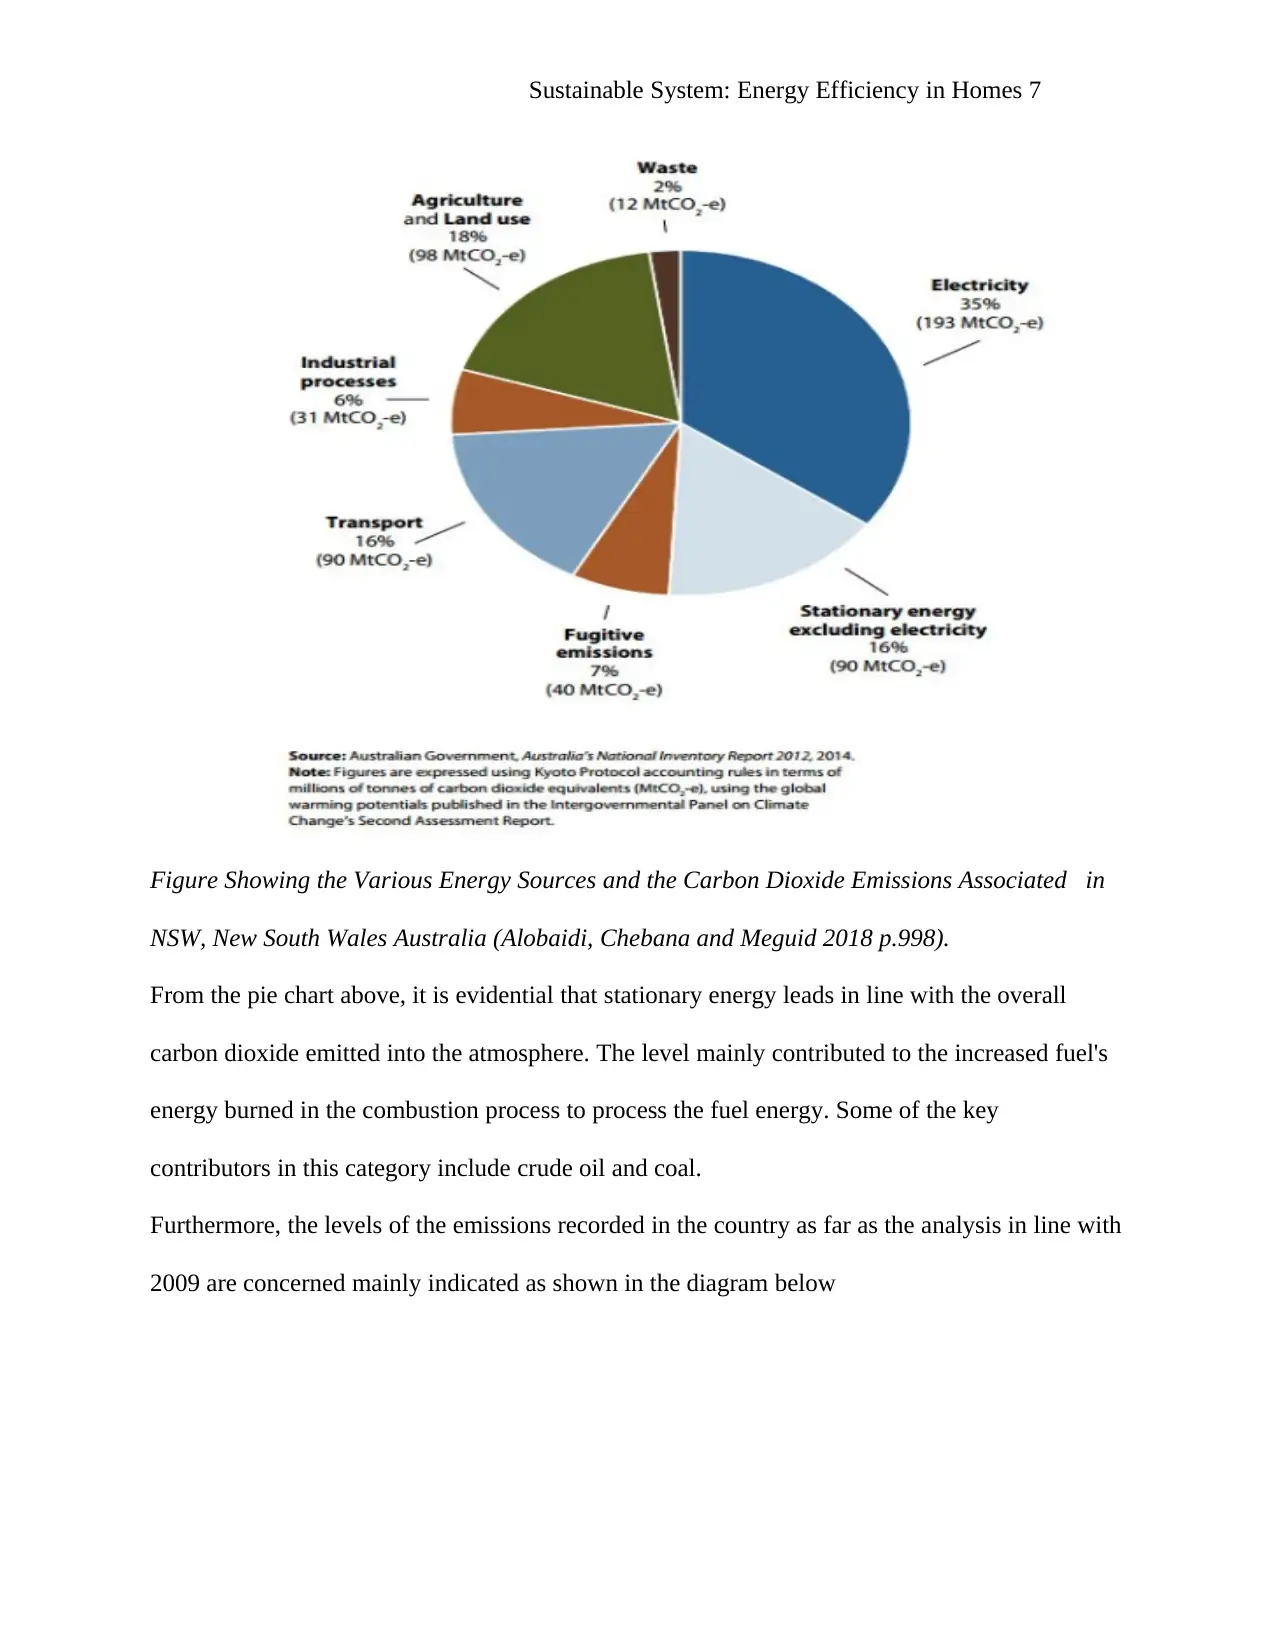
This report examines energy efficiency in homes within New South Wales, Australia, focusing on household energy consumption, appliances, and the impact of energy sources on carbon dioxide emissions. It identifies key challenges related to high energy usage and greenhouse gas emissions from sectors like stationary energy, transport, and fuel use. The study explores renewable and non-renewable energy sources, highlighting the environmental impacts of each. Furthermore, it identifies organizations promoting energy efficiency in Australia and proposes opportunities to decrease energy consumption through alternative fuels and device replacements. The report concludes by emphasizing the importance of implementing efficient energy practices to reduce environmental impact and promote sustainability, providing a cost-benefit analysis for improvement options. Desklib offers this report and many other resources for students studying environmental science and sustainable systems.
1 out of 11
Related Documents


Your All-in-One AI-Powered Toolkit for Academic Success.
+13062052269
info@desklib.com
Available 24*7 on WhatsApp / Email
![[object Object]](/_next/static/media/star-bottom.7253800d.svg)
Copyright © 2020–2026 A2Z Services. All Rights Reserved. Developed and managed by ZUCOL.