ENGIN5201 Surface Water Hydrology: Streamflow Analysis and HEC-RAS
VerifiedAdded on 2023/04/04
|20
|2459
|288
Homework Assignment
AI Summary
This assignment solution focuses on surface water hydrology, specifically analyzing the Cann River (West Branch) using over 40 years of continuous daily streamflow data. The analysis includes statistical summaries (daily, monthly, seasonal, and annual) with corresponding frequency plots. Furthermore, the assignment explores flood frequency distributions using the Log-Pearson Type III method and discusses hydraulic modeling with HEC-RAS software, including assumptions made during project execution and the interpretation of generated graphs and tables. The HEC-RAS component involves steady flow analysis and the computation of river profiles. The assignment provides a comprehensive overview of river analysis techniques and their applications in water resource management. Desklib provides a platform for students to access this solution and other study resources like past papers and solved assignments.
Running head: ENGIN5201 SURFACE WATER HYDROLOGY 1
ENGIN5201 Surface Water Hydrology
Name
Institution
ENGIN5201 Surface Water Hydrology
Name
Institution
Paraphrase This Document
Need a fresh take? Get an instant paraphrase of this document with our AI Paraphraser
ENGIN5201 SURFACE WATER HYDROLOGY 2
ENGIN5201 Surface Water Hydrology
Problem 1
Task (i)
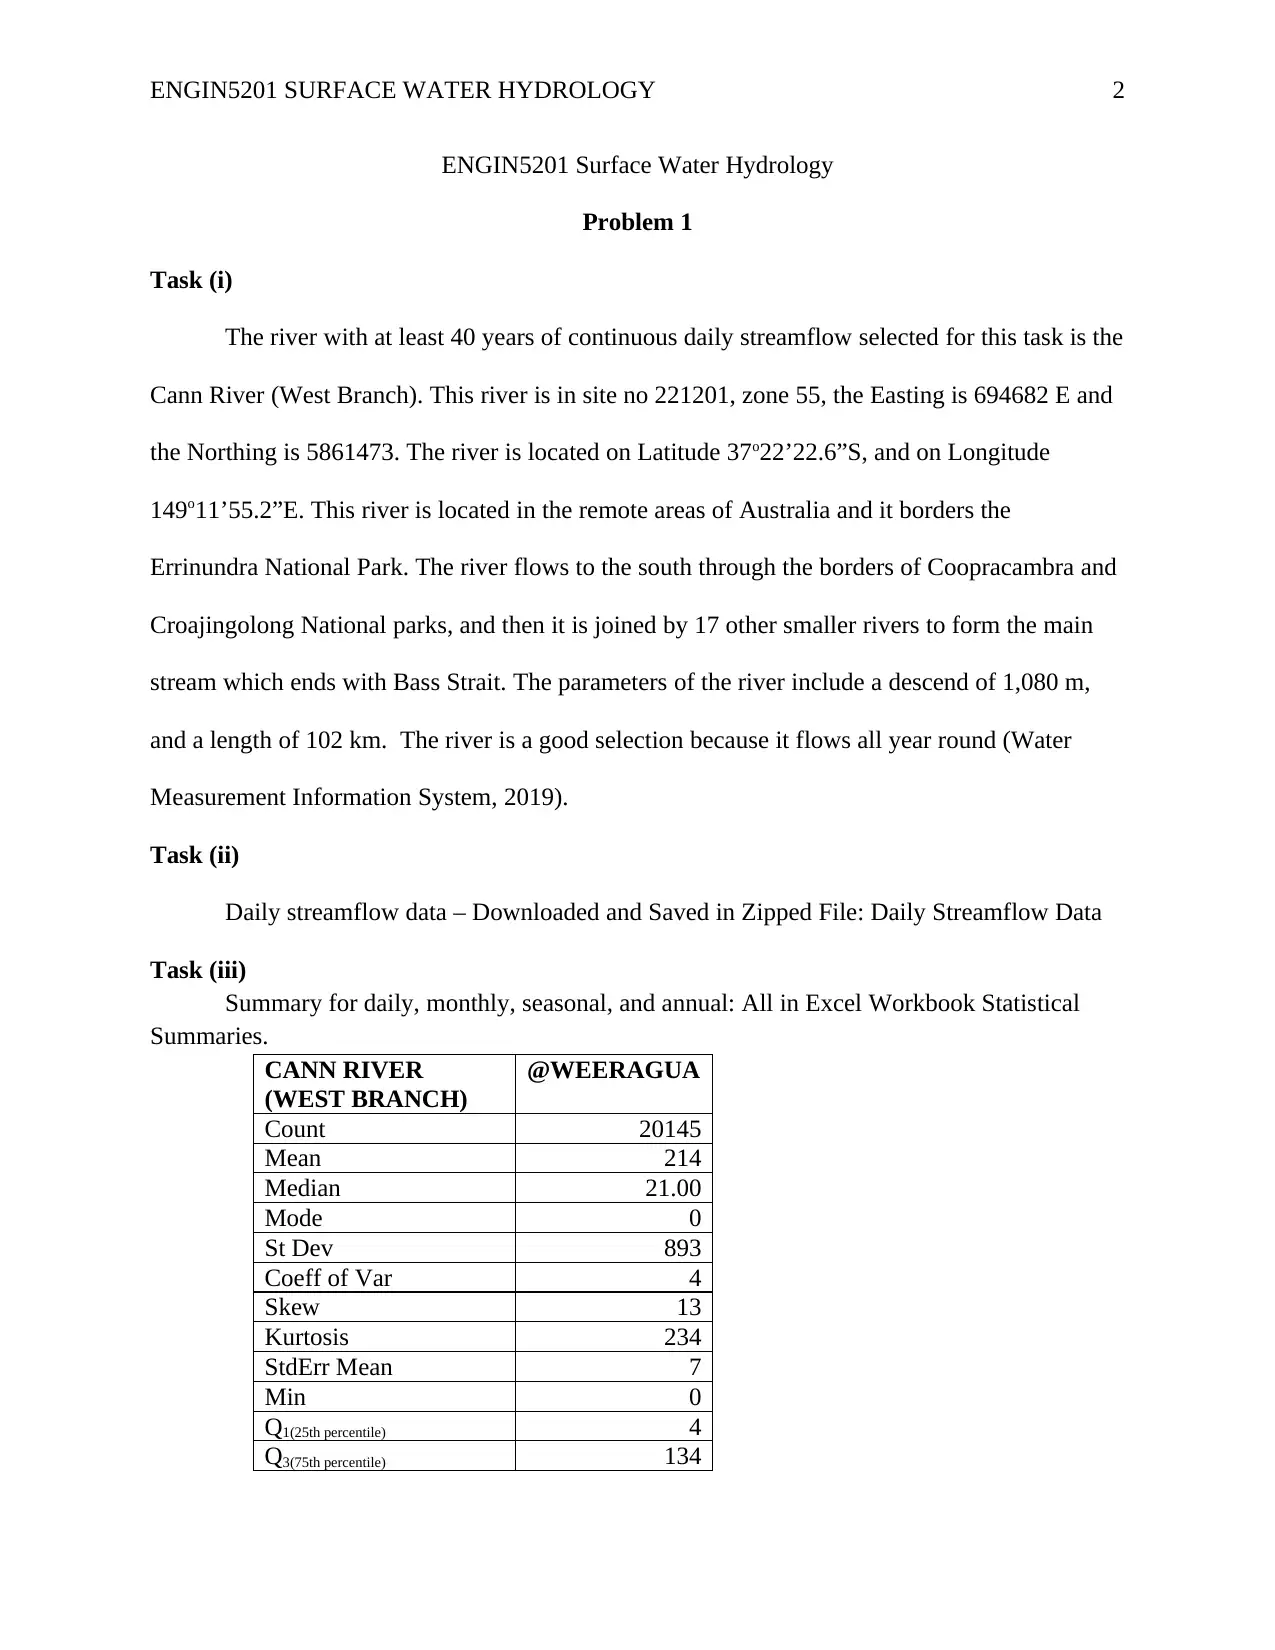
The river with at least 40 years of continuous daily streamflow selected for this task is the
Cann River (West Branch). This river is in site no 221201, zone 55, the Easting is 694682 E and
the Northing is 5861473. The river is located on Latitude 37o22’22.6”S, and on Longitude
149o11’55.2”E. This river is located in the remote areas of Australia and it borders the
Errinundra National Park. The river flows to the south through the borders of Coopracambra and
Croajingolong National parks, and then it is joined by 17 other smaller rivers to form the main
stream which ends with Bass Strait. The parameters of the river include a descend of 1,080 m,
and a length of 102 km. The river is a good selection because it flows all year round (Water
Measurement Information System, 2019).
Task (ii)
Daily streamflow data – Downloaded and Saved in Zipped File: Daily Streamflow Data
Task (iii)
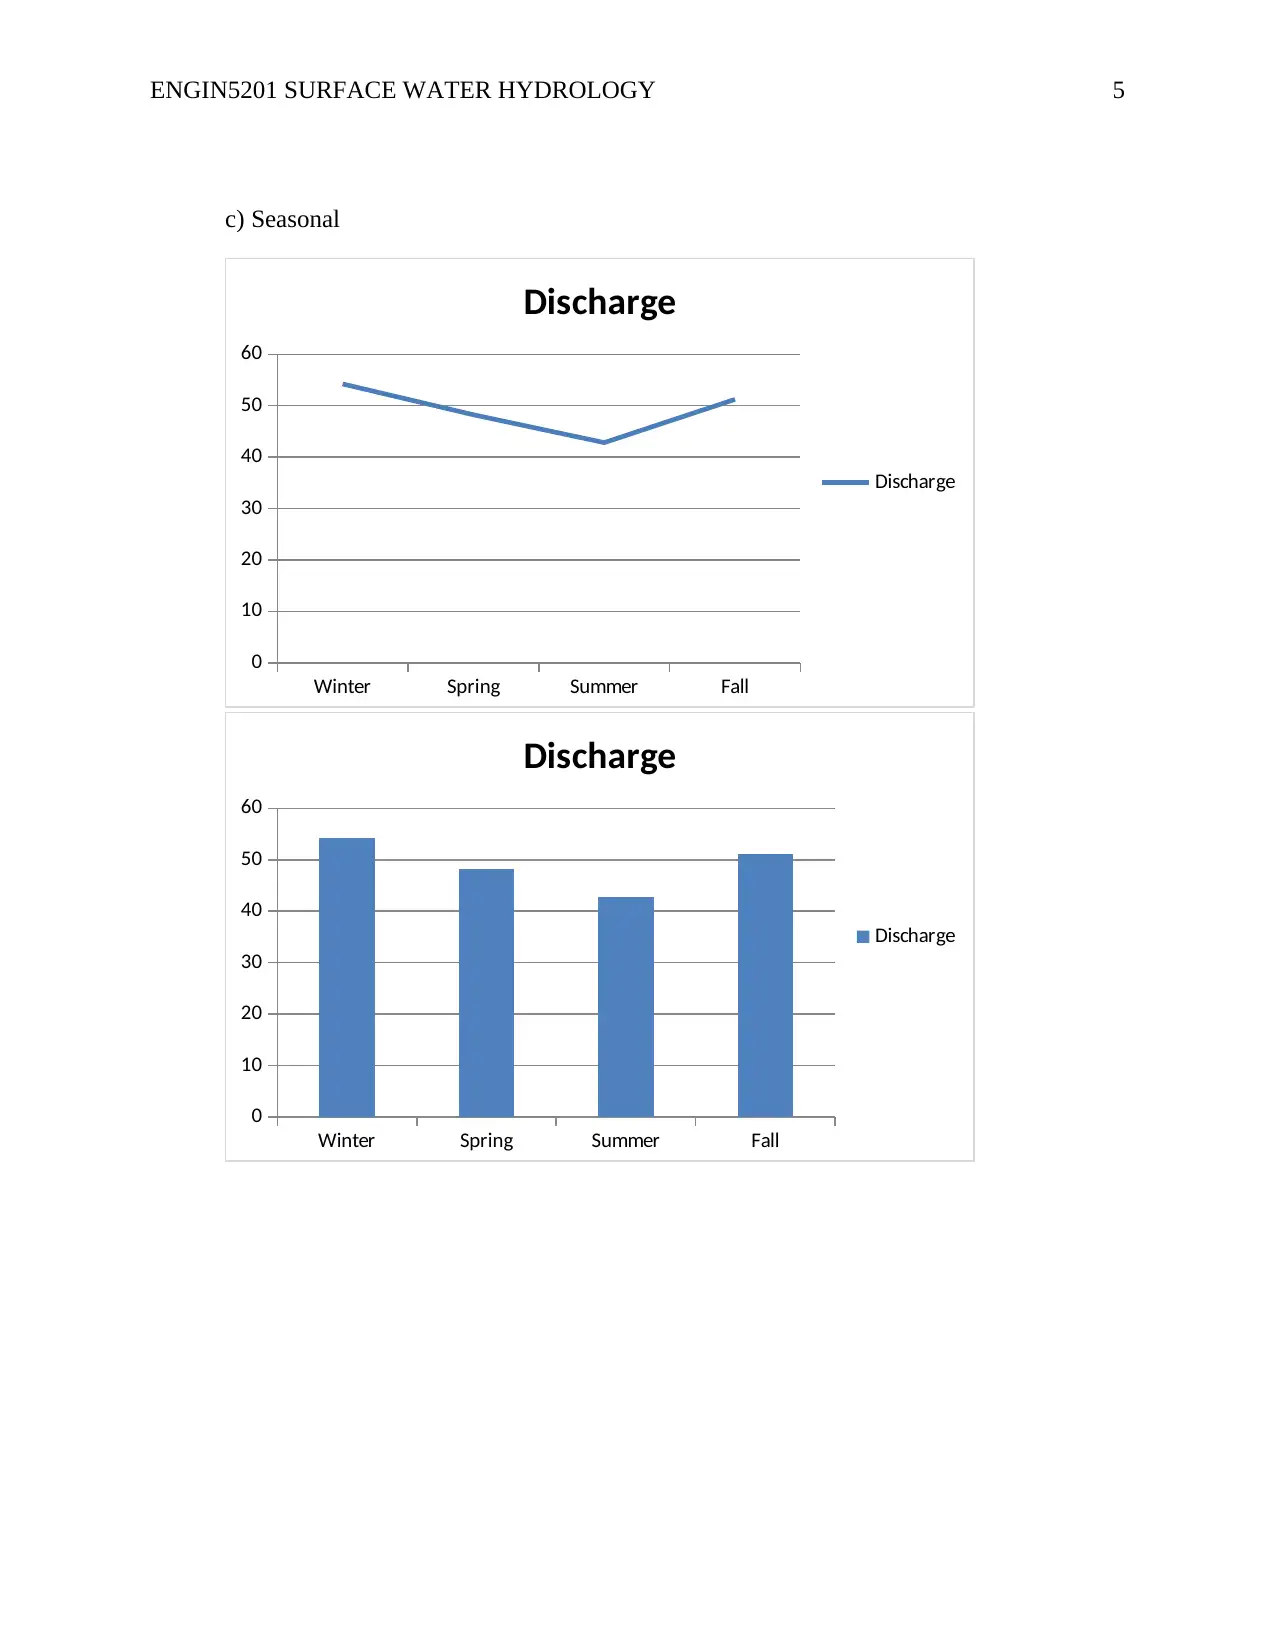
Summary for daily, monthly, seasonal, and annual: All in Excel Workbook Statistical
Summaries.
CANN RIVER
(WEST BRANCH)
@WEERAGUA
Count 20145
Mean 214
Median 21.00
Mode 0
St Dev 893
Coeff of Var 4
Skew 13
Kurtosis 234
StdErr Mean 7
Min 0
Q1(25th percentile) 4
Q3(75th percentile) 134
ENGIN5201 SURFACE WATER HYDROLOGY 3
Max 36351
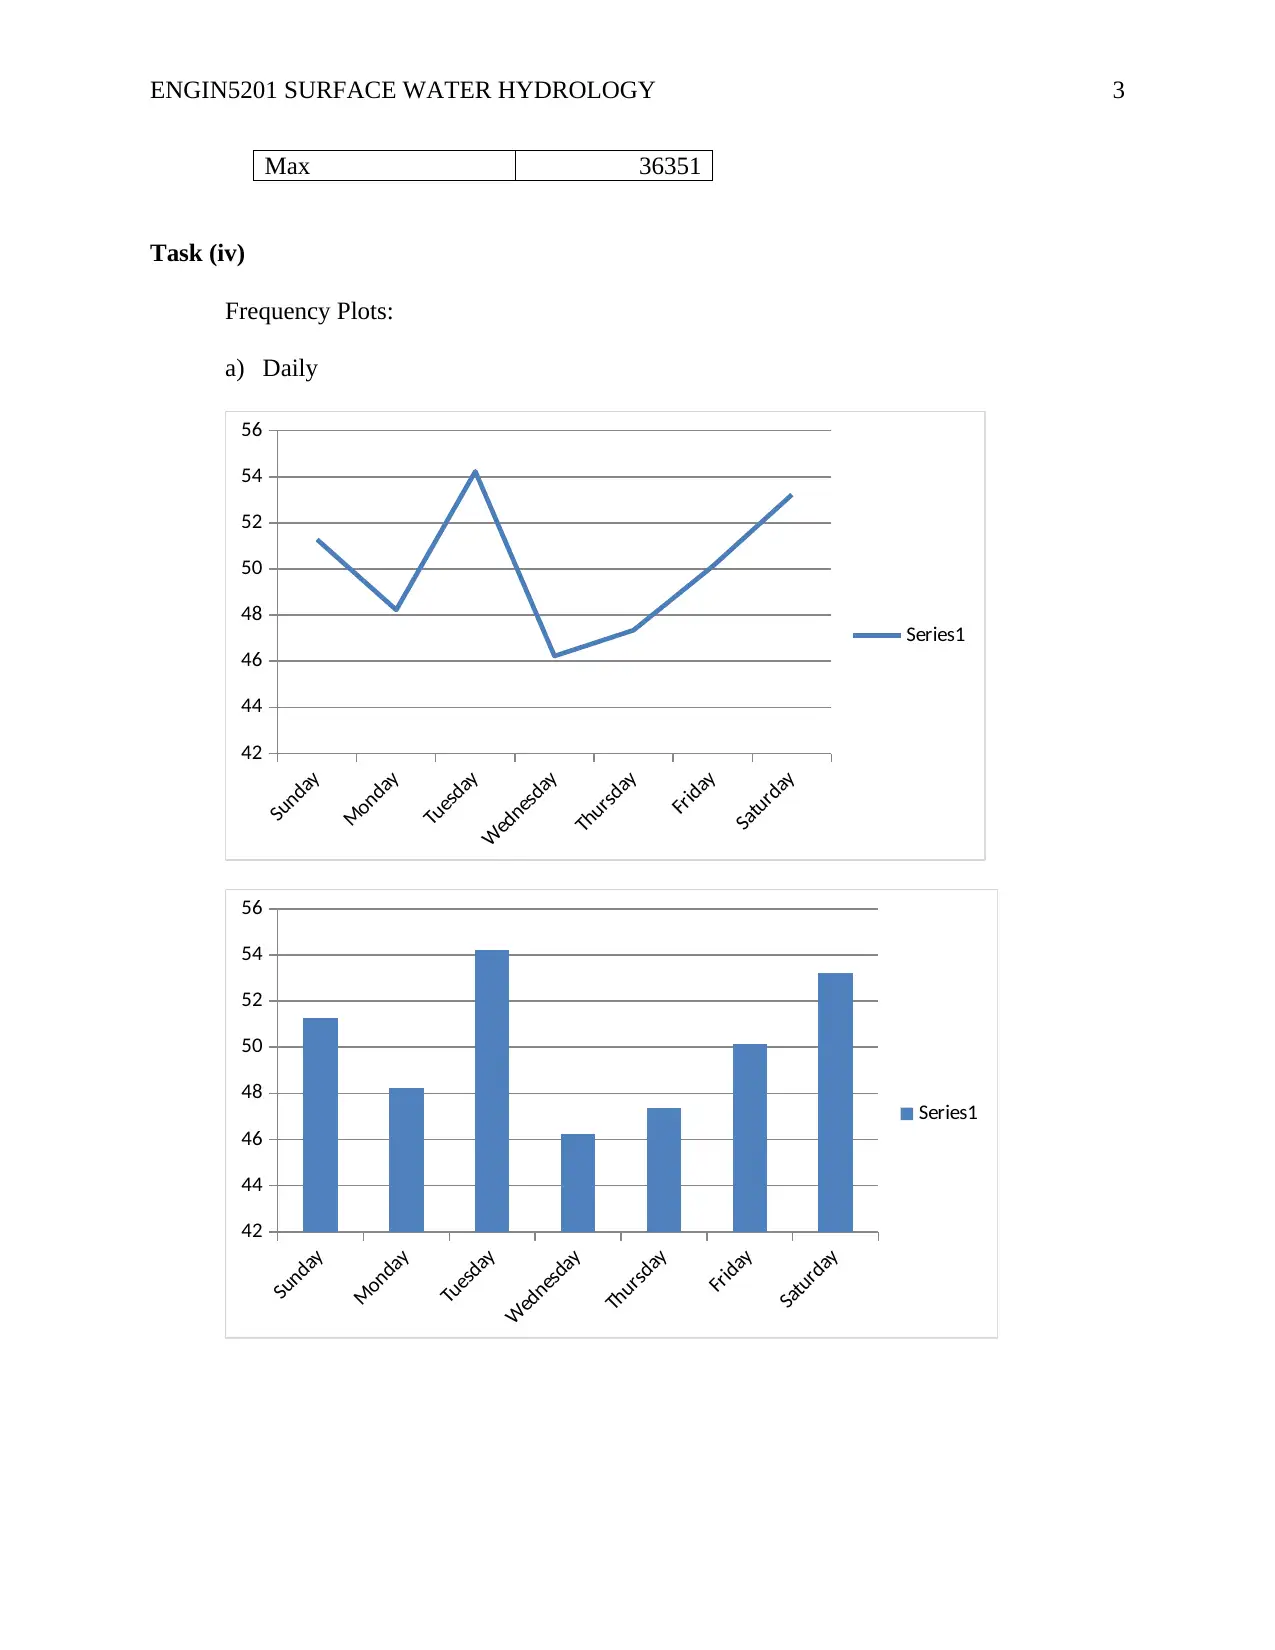
Task (iv)
Frequency Plots:
a) Daily
Sunday
Monday
Tuesday
Wednesday
Thursday
Friday
Saturday
42
44
46
48
50
52
54
56
Series1
Sunday
Monday
Tuesday
Wednesday
Thursday
Friday
Saturday
42
44
46
48
50
52
54
56
Series1
Max 36351
Task (iv)
Frequency Plots:
a) Daily
Sunday
Monday
Tuesday
Wednesday
Thursday
Friday
Saturday
42
44
46
48
50
52
54
56
Series1
Sunday
Monday
Tuesday
Wednesday
Thursday
Friday
Saturday
42
44
46
48
50
52
54
56
Series1
⊘ This is a preview!⊘
Do you want full access?
Subscribe today to unlock all pages.

Trusted by 1+ million students worldwide
ENGIN5201 SURFACE WATER HYDROLOGY 4
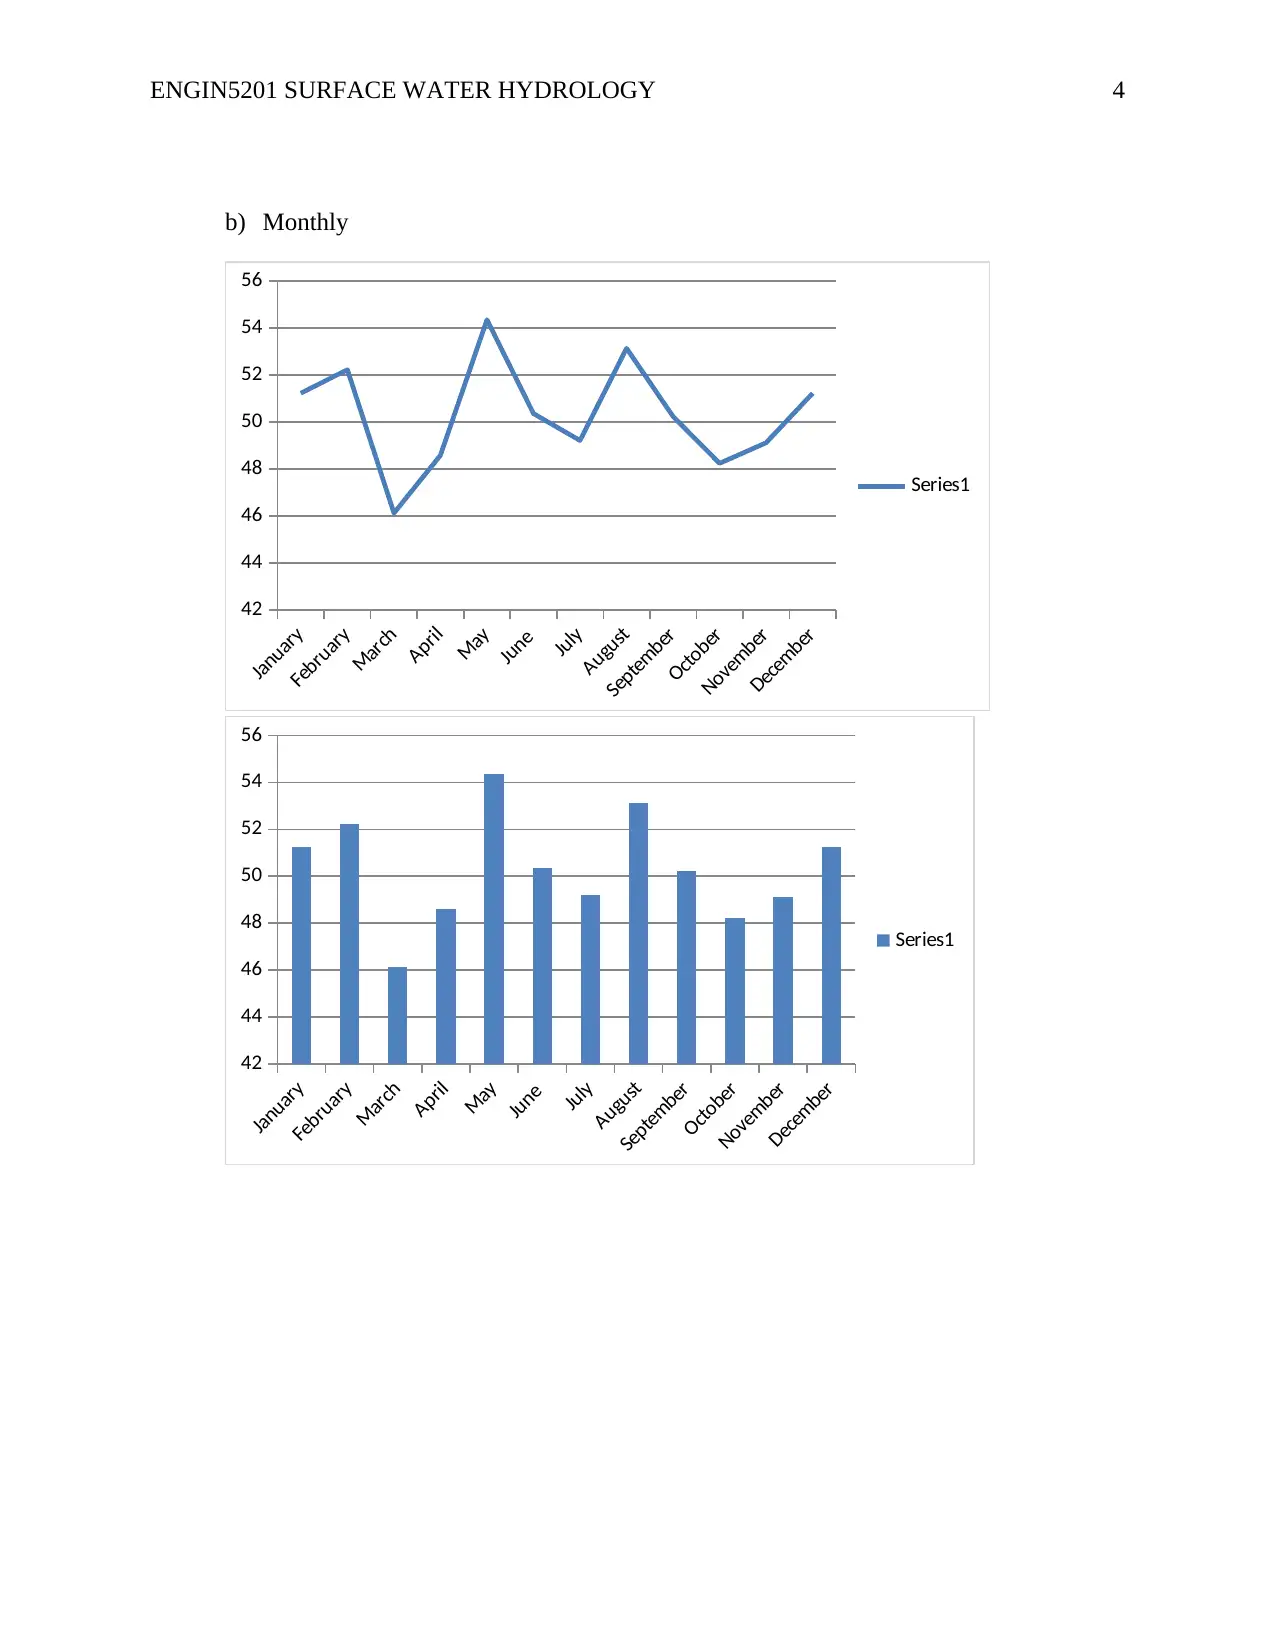
b) Monthly
January
February
March
April
May
June
July
August
September
October
November
December
42
44
46
48
50
52
54
56
Series1
January
February
March
April
May
June
July
August
September
October
November
December
42
44
46
48
50
52
54
56
Series1
b) Monthly
January
February
March
April
May
June
July
August
September
October
November
December
42
44
46
48
50
52
54
56
Series1
January
February
March
April
May
June
July
August
September
October
November
December
42
44
46
48
50
52
54
56
Series1
Paraphrase This Document
Need a fresh take? Get an instant paraphrase of this document with our AI Paraphraser
ENGIN5201 SURFACE WATER HYDROLOGY 5
c) Seasonal
Winter Spring Summer Fall
0
10
20
30
40
50
60
Discharge
Discharge
Winter Spring Summer Fall
0
10
20
30
40
50
60
Discharge
Discharge
c) Seasonal
Winter Spring Summer Fall
0
10
20
30
40
50
60
Discharge
Discharge
Winter Spring Summer Fall
0
10
20
30
40
50
60
Discharge
Discharge
ENGIN5201 SURFACE WATER HYDROLOGY 6
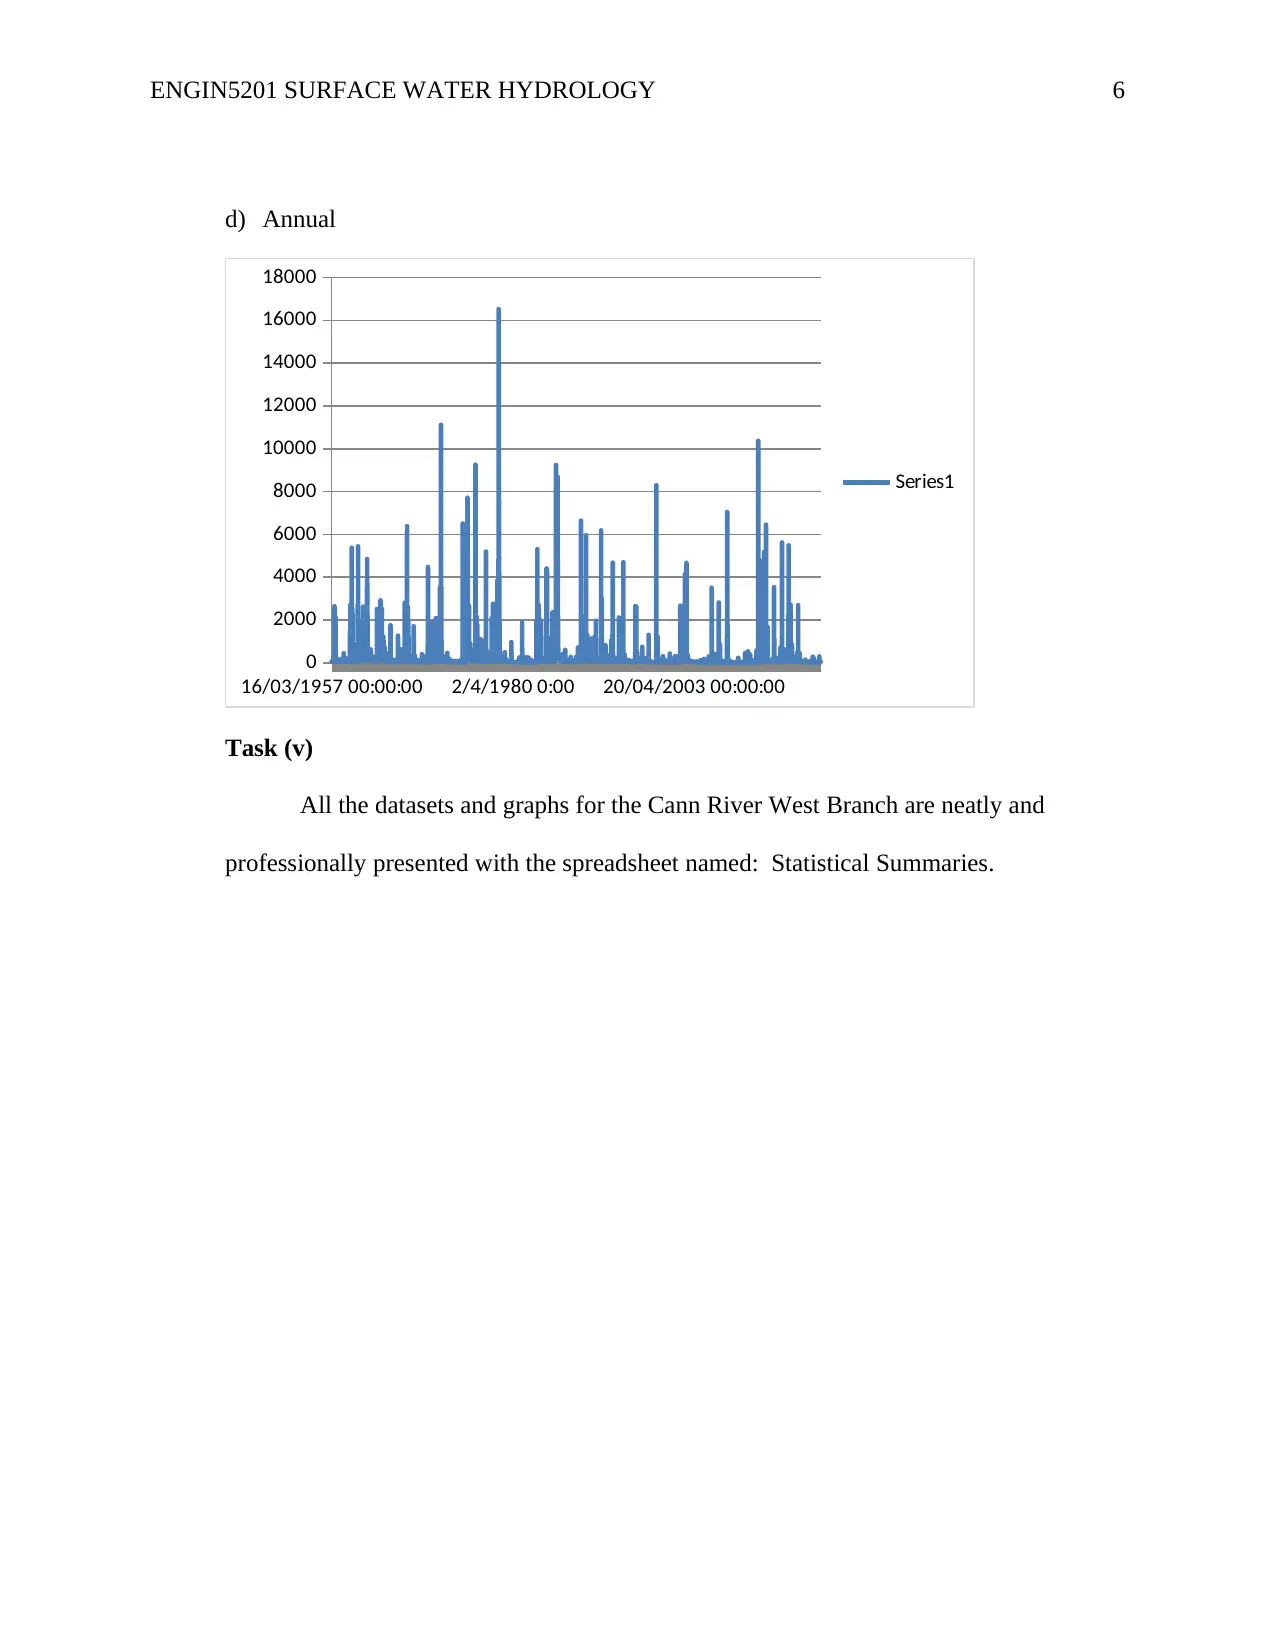
d) Annual
16/03/1957 00:00:00 2/4/1980 0:00 20/04/2003 00:00:00
0
2000
4000
6000
8000
10000
12000
14000
16000
18000
Series1
Task (v)
All the datasets and graphs for the Cann River West Branch are neatly and
professionally presented with the spreadsheet named: Statistical Summaries.
d) Annual
16/03/1957 00:00:00 2/4/1980 0:00 20/04/2003 00:00:00
0
2000
4000
6000
8000
10000
12000
14000
16000
18000
Series1
Task (v)
All the datasets and graphs for the Cann River West Branch are neatly and
professionally presented with the spreadsheet named: Statistical Summaries.
⊘ This is a preview!⊘
Do you want full access?
Subscribe today to unlock all pages.

Trusted by 1+ million students worldwide
ENGIN5201 SURFACE WATER HYDROLOGY 7
Problem 2
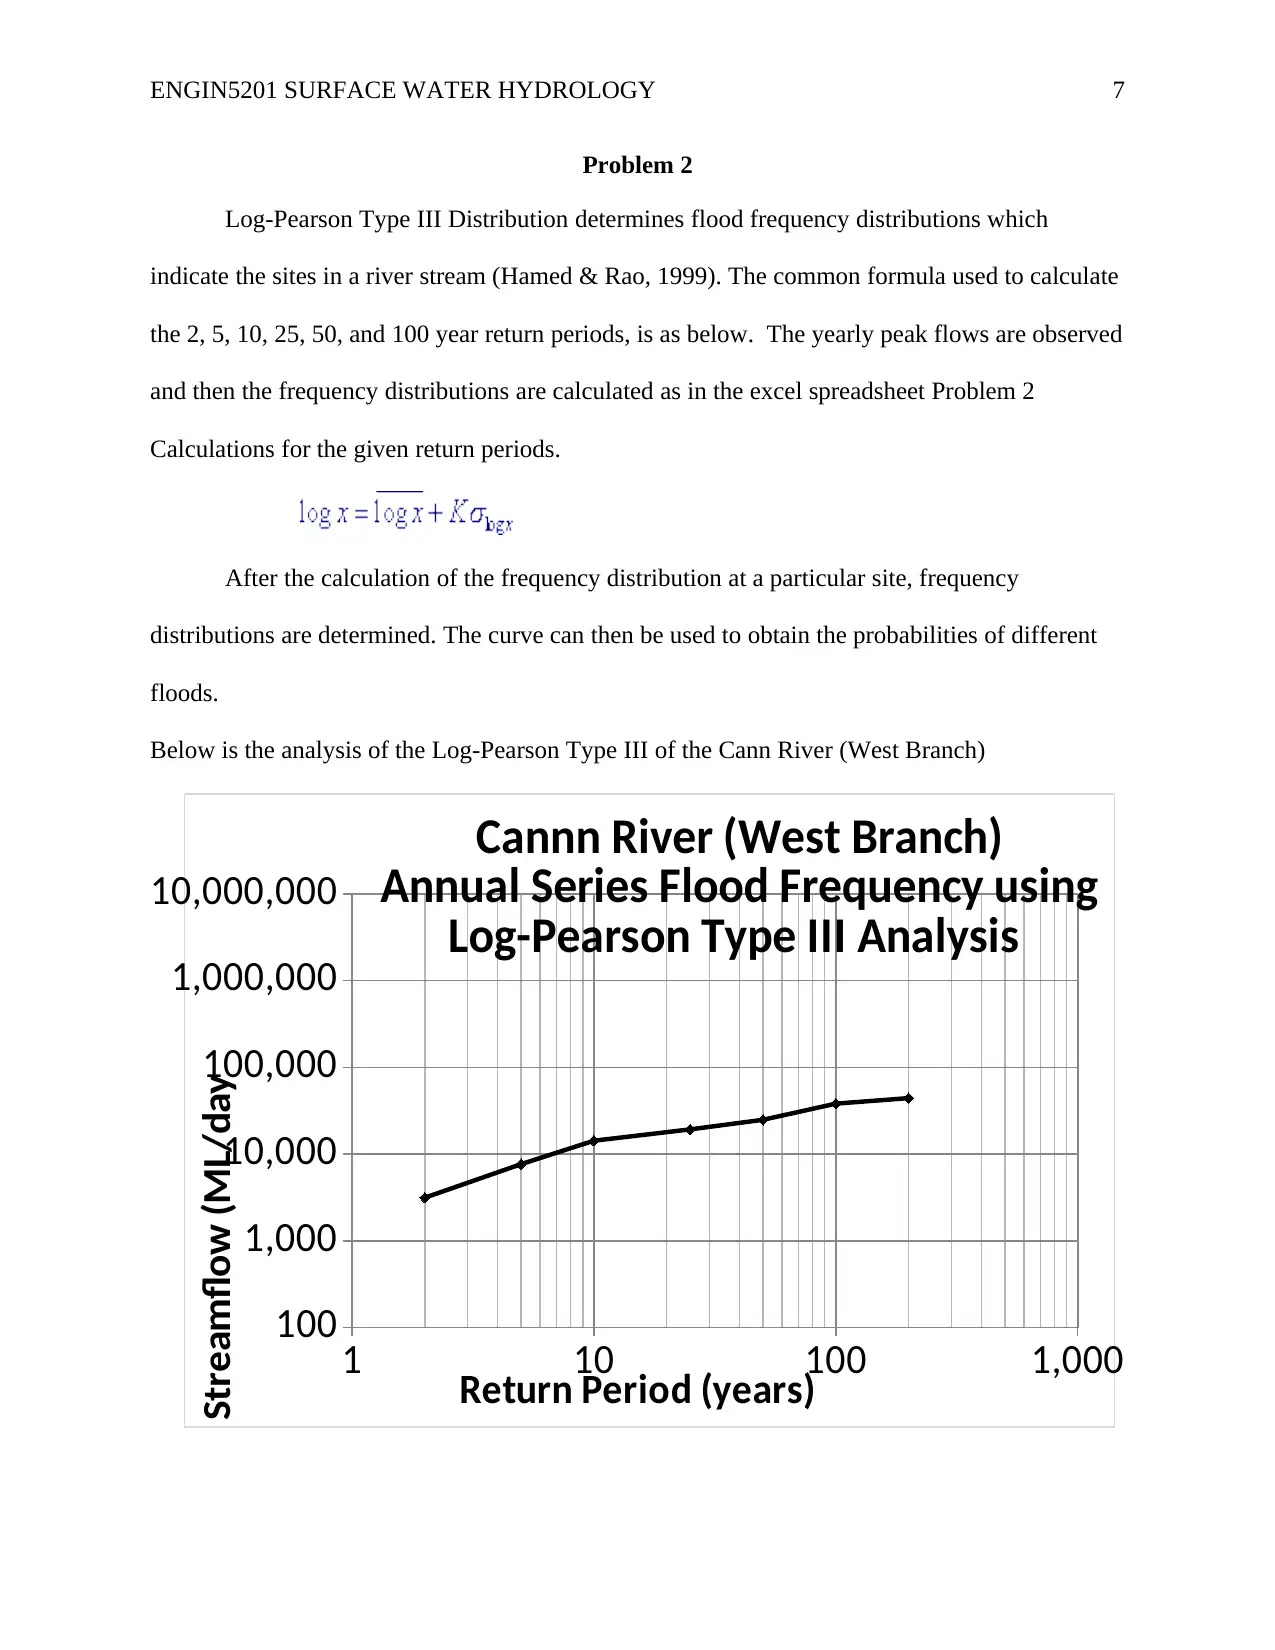
Log-Pearson Type III Distribution determines flood frequency distributions which
indicate the sites in a river stream (Hamed & Rao, 1999). The common formula used to calculate
the 2, 5, 10, 25, 50, and 100 year return periods, is as below. The yearly peak flows are observed
and then the frequency distributions are calculated as in the excel spreadsheet Problem 2
Calculations for the given return periods.
After the calculation of the frequency distribution at a particular site, frequency
distributions are determined. The curve can then be used to obtain the probabilities of different
floods.
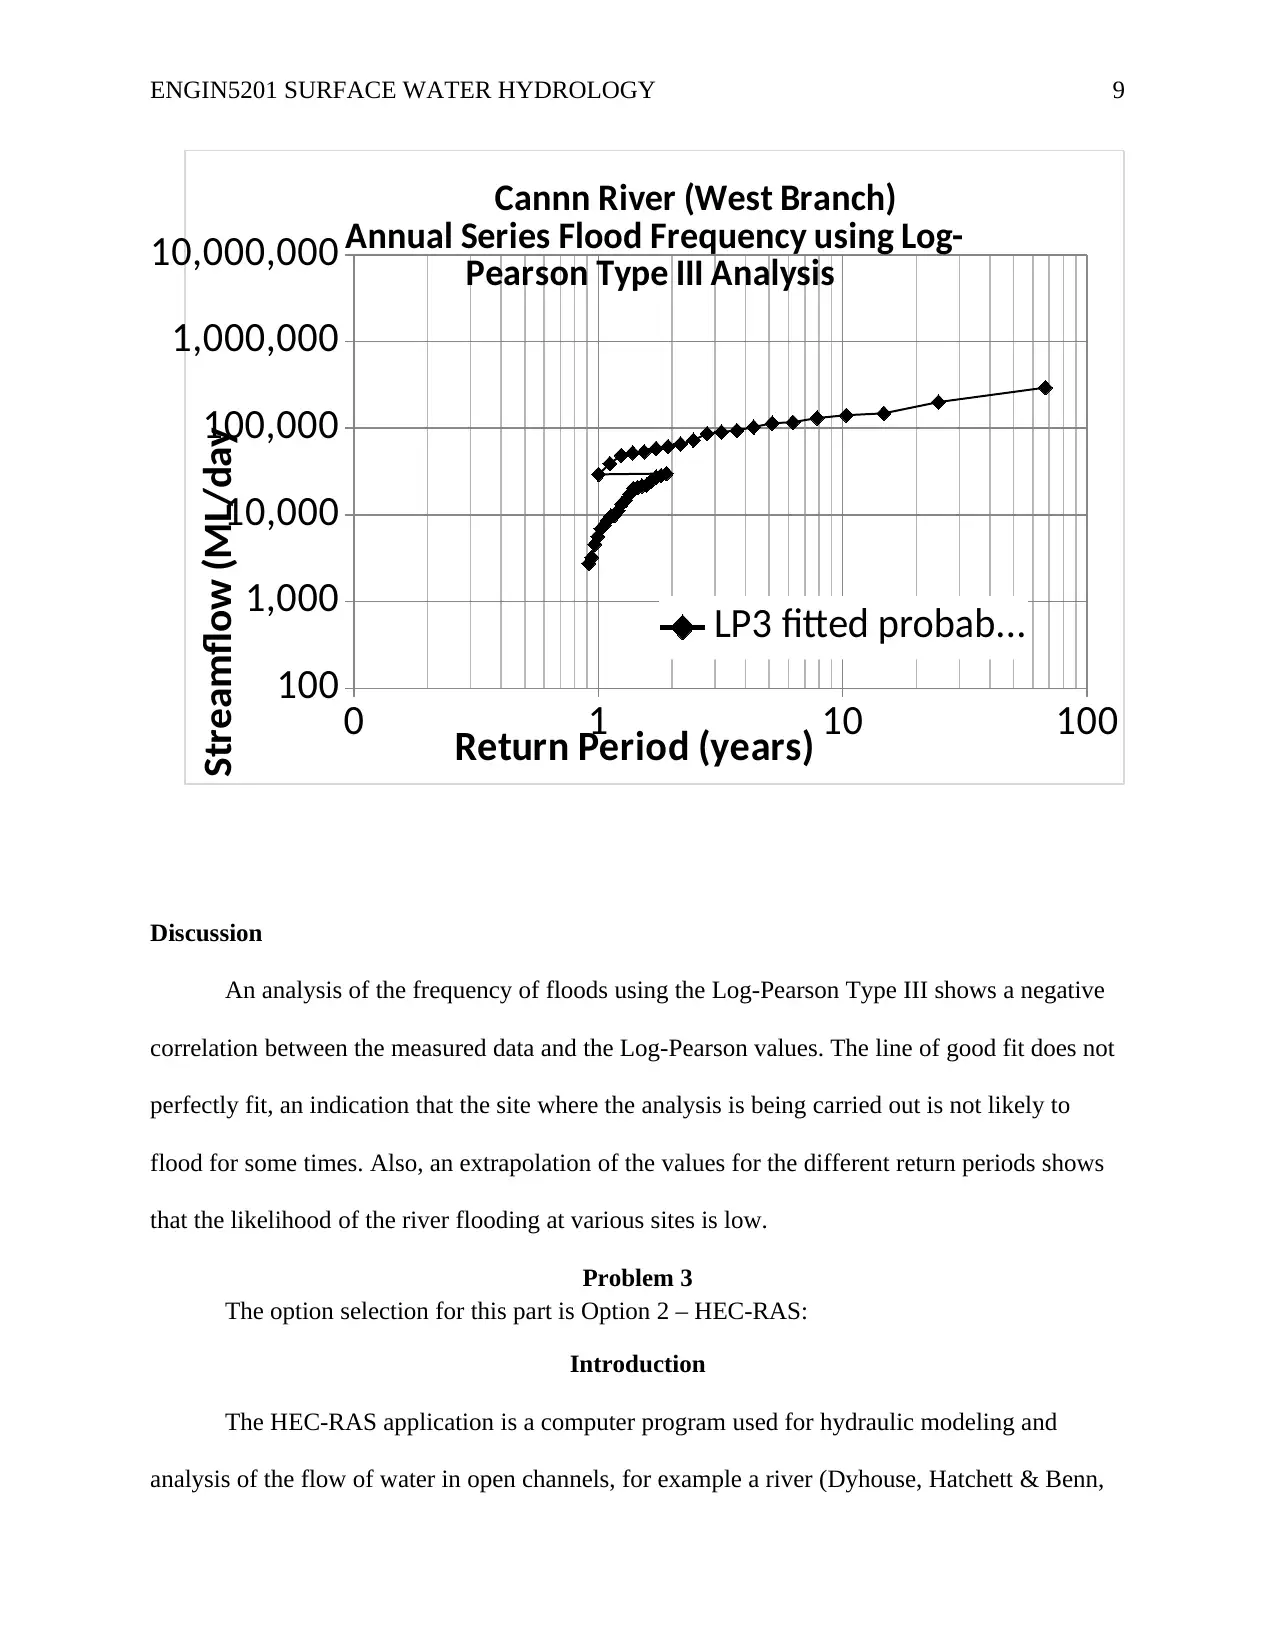
Below is the analysis of the Log-Pearson Type III of the Cann River (West Branch)
1 10 100 1,000
100
1,000
10,000
100,000
1,000,000
10,000,000
Cannn River (West Branch)
Annual Series Flood Frequency using
Log-Pearson Type III Analysis
Return Period (years)
Streamflow (ML/day
Paraphrase This Document
Need a fresh take? Get an instant paraphrase of this document with our AI Paraphraser
ENGIN5201 SURFACE WATER HYDROLOGY 8
0 1 10 100 1,000
100
1,000
10,000
100,000
1,000,000
10,000,000
Cannn River (West Branch)
Annual Series Flood Frequency using Log-
Pearson Type III Analysis
Actual measured s...
Return Period (years)
Streamflow (ML/day
0 1 10 100 1,000
100
1,000
10,000
100,000
1,000,000
10,000,000
Cannn River (West Branch)
Annual Series Flood Frequency using Log-
Pearson Type III Analysis
Actual measured s...
Return Period (years)
Streamflow (ML/day
ENGIN5201 SURFACE WATER HYDROLOGY 9
0 1 10 100
100
1,000
10,000
100,000
1,000,000
10,000,000
Cannn River (West Branch)
Annual Series Flood Frequency using Log-
Pearson Type III Analysis
LP3 fitted probab...
Return Period (years)
Streamflow (ML/day
Discussion
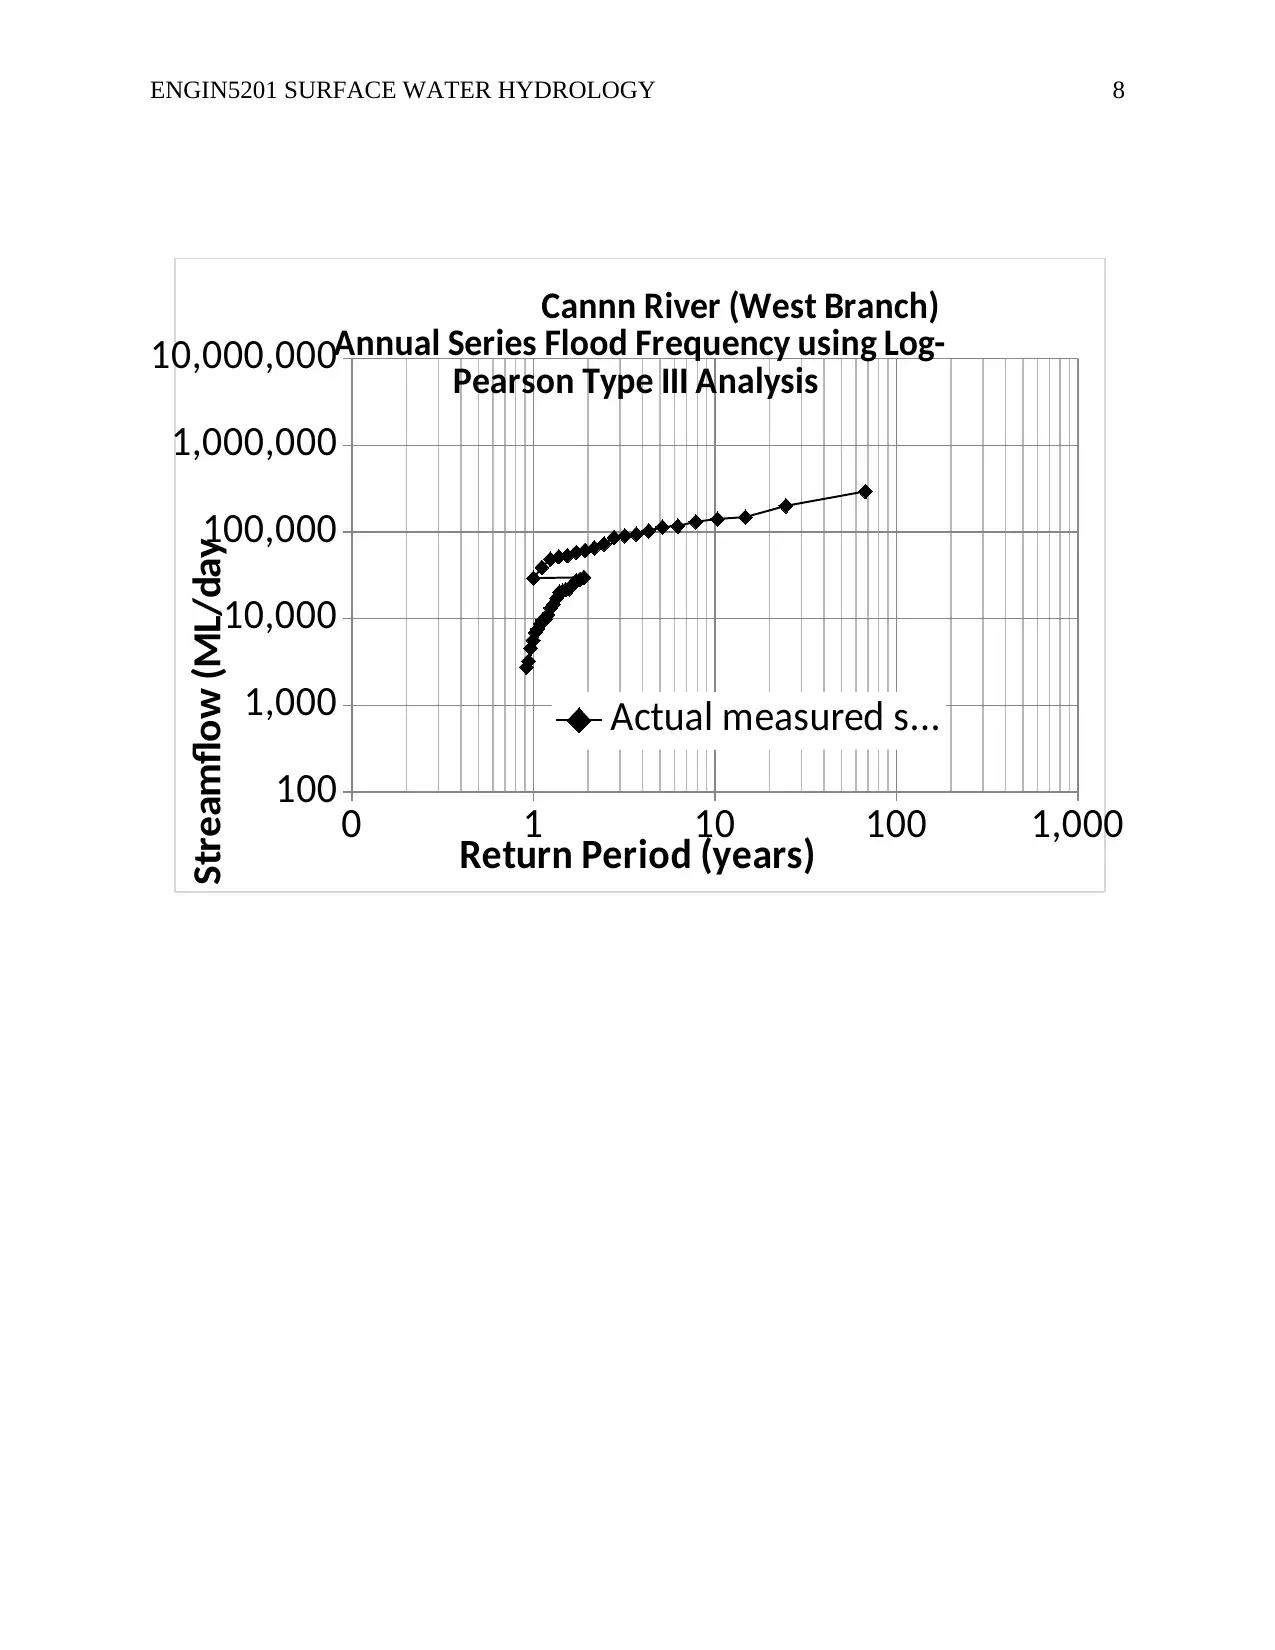
An analysis of the frequency of floods using the Log-Pearson Type III shows a negative
correlation between the measured data and the Log-Pearson values. The line of good fit does not
perfectly fit, an indication that the site where the analysis is being carried out is not likely to
flood for some times. Also, an extrapolation of the values for the different return periods shows
that the likelihood of the river flooding at various sites is low.
Problem 3
The option selection for this part is Option 2 – HEC-RAS:
Introduction
The HEC-RAS application is a computer program used for hydraulic modeling and
analysis of the flow of water in open channels, for example a river (Dyhouse, Hatchett & Benn,
⊘ This is a preview!⊘
Do you want full access?
Subscribe today to unlock all pages.

Trusted by 1+ million students worldwide
ENGIN5201 SURFACE WATER HYDROLOGY 10
2003; Bayareddy, 2016; Chia, 2005; Goodell, 2014). The software has undergone different
upgrades to version 5.0.7. There was no direct hydraulic effect modeling of the cross sections,
bends, and other elements of flow that need to be represented in two to three dimensions. In the
done example from the user manual, the version 5.0.7 has been used that allows a two
dimensional modeling of flow, besides other aspects of flow such as sediment transfer modeling
capabilities. HEC – RAS is a development of the US Department of Defense, Army Corps of
Engineers for purposes of river management, harbor management, and any other water related
public works that fall under the jurisdiction of the department (US Army Corps of Engineers,
2016; Information Resources Management Association, 2016; Hadzikadic & Avdakovic, 2018).
The application is integrated and its design is such that it is interactive and allows a
multitasking user interface. The primary features of the software are a graphical user interface
(GUI), analysis features, data storage features, management of data elements and image
components (Brunner, 1997; Parr & Smith, 2000).
The river analysis features include: (1) water quality analysis. (2) unsteady flow
simulations (both in one dimensional and two dimensional), (3) steady flow water surface profile
computations and (4) Quasi unsteady or fully unsteady flow movable boundary sediment
transport computations.
In the example done from Chapter four of the user manual, the following are the process
were done:
i. Staring a New project,
ii. Data entry
iii. Steady flow data entry
iv. Hydraulic calculations
Paraphrase This Document
Need a fresh take? Get an instant paraphrase of this document with our AI Paraphraser
ENGIN5201 SURFACE WATER HYDROLOGY 11
v. Results analysis
vi. Closing the application.
Summary of the Assumptions Made
After starting a new project, various assumptions were made during project processing
and execution. The example done in the application is an imaginary example, and that no
data was obtained from any field for analysis.
The first assumption made is that the river to be analyzed exists and it is a two river
hydraulic system, i.e. a three hydraulic reaches system as it is depicted in the project files. In
development of this model, the next major assumption made is that the river profile has
georeferences. However, these georeferences are not real, they do not exist. As such, an
imaginary georeferenced background map was selected, or was brought into the application.
Another major assumption made during project execution is the cross sections for the
river system actually exists and the parameters given for the river system are actual
parameters. The cross sections were also assumed to be uniform throughout the river
profiles, and because of that, they were copied, one to the next. However, different but
almost similar parameters were utilized to create some arbitrary differences for the river
profile.
The river system contained three reaches separated by a junction. The junction
separated the upper reach and the lower reach for the Fall River, and also the reach for the
Butter Cr. River (the tributary). The junction data is ideal – a major assumption for
computation and analysis of the river in subject. Junction data for the river was assumed to
accurately contain the precise figures for river description, and the lengths of the reaches
ENGIN5201 SURFACE WATER HYDROLOGY 12
across the junction. The geometry data for the project was saved and the analysis done step
by step as from the example in the user manual.
Selection of Graphs
Before the selection and generation of the various graphs from the software, different
analyses and data entries were done to form the basis for graph generation. Steady flow data was
entered into the software to compute the profiles. Three river profiles were calculated. For the
three profiles, flow data was entered starting the upstream side to the downstream of the river. It
this step of the analysis, another assumption was made – “the flow is constant until another flow
value is encountered within the reach.” Other flows were added at the river sections within the
reaches.
The graphs generated and selected for the example as shown in the next section of the
report were also defined by the river profile under analysis, boundary conditions. The boundary
conditions serve as the parameters for the establishment of the point where the river starts and
the end of the river system under analysis. The beginning of a river is essential in the analysis
because in helped the application to start making calculations. The selected regime for the river
was a subcritical flow regime. Subcritical flow regimes require only downstream boundary
conditions (Sturm, 2010; Vojinovic & Abbott, 2012). For supercritical flow regimes, the
boundary conditions are only set at the upper end of the river. There are cases where the flow is
of a mixed regime. In such cases, the calculations for the river are done with the Boundary
conditions entered both at the upstream and downstream ends of the river (Institute of Engineers
Australia, 1995).
Discussion
⊘ This is a preview!⊘
Do you want full access?
Subscribe today to unlock all pages.

Trusted by 1+ million students worldwide
1 out of 20
Your All-in-One AI-Powered Toolkit for Academic Success.
+13062052269
info@desklib.com
Available 24*7 on WhatsApp / Email
![[object Object]](/_next/static/media/star-bottom.7253800d.svg)
Unlock your academic potential
Copyright © 2020–2025 A2Z Services. All Rights Reserved. Developed and managed by ZUCOL.
