ENM2104 Project Report: Monitoring Motor Vehicle Engine Temperature
VerifiedAdded on 2023/06/11
|17
|4213
|205
Report
AI Summary
This report presents a project focused on monitoring and controlling engine temperature in motor vehicles to prevent overheating and potential engine damage. The system utilizes a thermistor to measure engine temperature (EGT) and an Arduino microcontroller to process the data and trigger an alarm if the temperature exceeds safe limits. The report details the problem statement, implementation challenges, sensor selection, hardware and software configurations, and testing procedures. The project aims to provide a reliable and cost-effective solution for vehicle owners to proactively manage engine temperature and prevent catastrophic failures. The design incorporates signal conditioning circuits, a microprocessor controller board, and an alarm system to alert the driver of potential overheating issues. The document also discusses the challenges faced during development, such as thermistor inaccuracies and noise interference, and the solutions implemented to overcome these issues.

MONITOR AND CONTROL ENGINE TEMPERATURE IN A MOTOR VEHICLE
Student name
Course
Affiliation
Date
Student name
Course
Affiliation
Date
Paraphrase This Document
Need a fresh take? Get an instant paraphrase of this document with our AI Paraphraser
Executive summary
Most of the motor vehicles always overheat to the extend of the engine pistons burning
up without the notice of the motor vehicle consent. For this reason , most of the overheating
incidences always happen and leads to even death when the whole vehicle bursts into flames.
The development of the temperature monitoring device that could detect the temperature of the
vehicle and then creates an alarming system which shows if the temperature is too high so that
the same can be corrected promptly without causing any problem.
Table of Contents
Executive summary.........................................................................................................................2
Introduction......................................................................................................................................3
Objective......................................................................................................................................4
Project description........................................................................................................................4
Implementation................................................................................................................................5
Statement of the problem.............................................................................................................5
Task Division...............................................................................................................................7
The problem faced during development......................................................................................7
Sensor selection...............................................................................................................................9
Identification of the types of sensor.............................................................................................9
The performance test of the sensor............................................................................................10
System Implementation.................................................................................................................11
The hardware requirement and configuration............................................................................11
The software configuration........................................................................................................11
Timing....................................................................................................................................12
Calculations............................................................................................................................12
Display of data........................................................................................................................13
Conclusion.....................................................................................................................................13
⊘ This is a preview!⊘
Do you want full access?
Subscribe today to unlock all pages.
Trusted by 1+ million students worldwide
Table of Figures
Figure 1 The block Diagram---------------------------------------------------------------------------------7
Figure 2 How thermistor works-----------------------------------------------------------------------------8
Figure 3 Graph of the thermistor----------------------------------------------------------------------------8
Figure 4 The Mega 2560 application-----------------------------------------------------------------------9
Figure 5 The virtual ground--------------------------------------------------------------------------------10
Figure 6 Low pass filter-------------------------------------------------------------------------------------10
Figure 7 Mega 2560 schematic---------------------------------------------------------------------------12
Paraphrase This Document
Need a fresh take? Get an instant paraphrase of this document with our AI Paraphraser
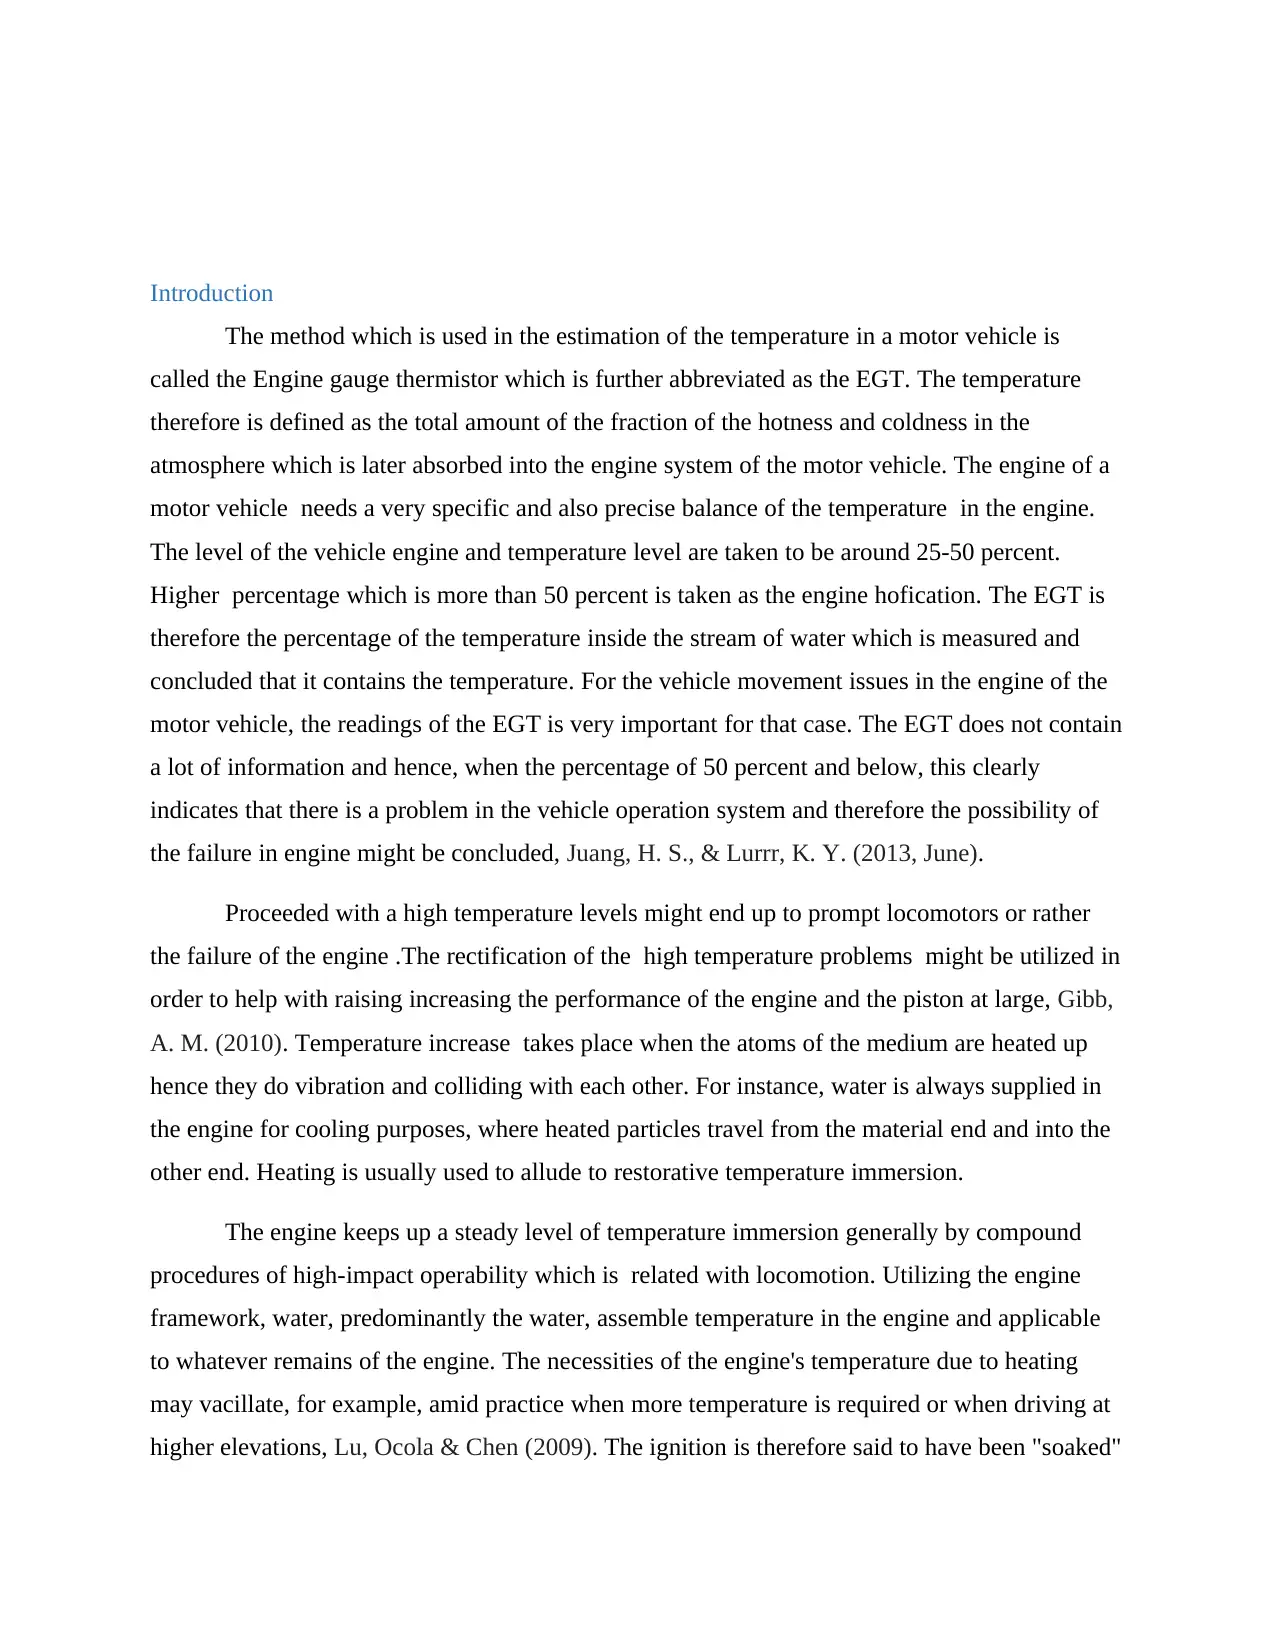
Introduction
The method which is used in the estimation of the temperature in a motor vehicle is
called the Engine gauge thermistor which is further abbreviated as the EGT. The temperature
therefore is defined as the total amount of the fraction of the hotness and coldness in the
atmosphere which is later absorbed into the engine system of the motor vehicle. The engine of a
motor vehicle needs a very specific and also precise balance of the temperature in the engine.
The level of the vehicle engine and temperature level are taken to be around 25-50 percent.
Higher percentage which is more than 50 percent is taken as the engine hofication. The EGT is
therefore the percentage of the temperature inside the stream of water which is measured and
concluded that it contains the temperature. For the vehicle movement issues in the engine of the
motor vehicle, the readings of the EGT is very important for that case. The EGT does not contain
a lot of information and hence, when the percentage of 50 percent and below, this clearly
indicates that there is a problem in the vehicle operation system and therefore the possibility of
the failure in engine might be concluded, Juang, H. S., & Lurrr, K. Y. (2013, June).
Proceeded with a high temperature levels might end up to prompt locomotors or rather
the failure of the engine .The rectification of the high temperature problems might be utilized in
order to help with raising increasing the performance of the engine and the piston at large, Gibb,
A. M. (2010). Temperature increase takes place when the atoms of the medium are heated up
hence they do vibration and colliding with each other. For instance, water is always supplied in
the engine for cooling purposes, where heated particles travel from the material end and into the
other end. Heating is usually used to allude to restorative temperature immersion.
The engine keeps up a steady level of temperature immersion generally by compound
procedures of high-impact operability which is related with locomotion. Utilizing the engine
framework, water, predominantly the water, assemble temperature in the engine and applicable
to whatever remains of the engine. The necessities of the engine's temperature due to heating
may vacillate, for example, amid practice when more temperature is required or when driving at
higher elevations, Lu, Ocola & Chen (2009). The ignition is therefore said to have been "soaked"
whereas conveying a distinctive quantity of temperature. Equally too high and too low levels
might impiously affect the engine.
Objective
The main objective of the project therefore is to give satisfactory evidence of the field
work study of a system which can be implemented in to car owners by the use of the thermistor
and off items which are needed.
Project description
The project developed in order to measure the amount of the temperature in the motor
engine will be a non inversely do the monitoring of the EGT in the engine a vehicle. In order to
give a human interface interaction to the system, system was developed by the employment of
the atmospheric air temperature detection which is available for commercial purposes. In this
case, the atmospheric air temperature detection will produce a signal which will be later undergo
filtration and also amplification. The amplification is done so that the signal can be easily
processed using the Microprocessor controller board. The calculations of the EGT are all done
by the microprocessor controller board since the controller board is programmed with the codes
which are used to calculated the EGT, Robinson et al (2008). Once the calculations have been
done by the Arduino, then it outputs the results which is the percentage of the EGT . This is done
in the serial port. The board is designed in such a way that once the EGT of the patient is
detected to be below 50 percent, then an alarm is triggered using a command from the
microprocessor controller. By so doing, the driver can be able to know the level of the
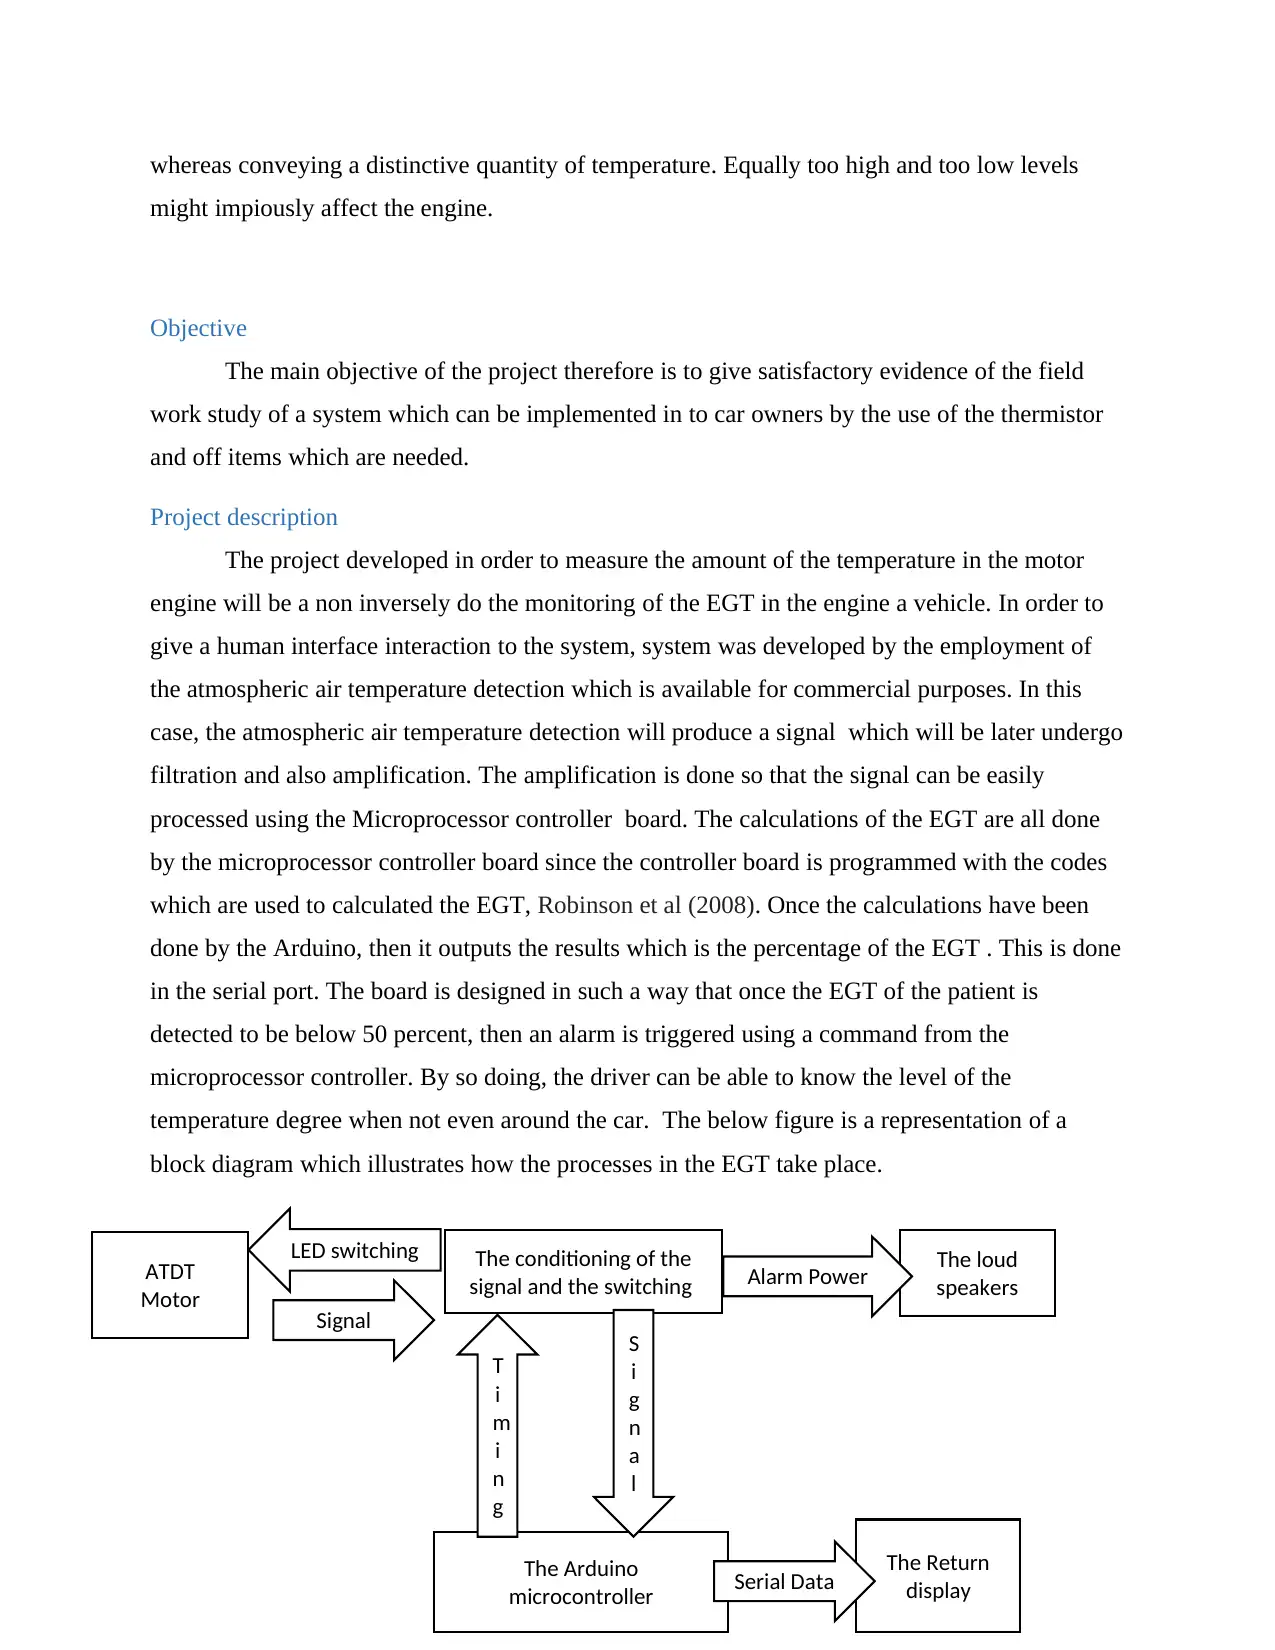
temperature degree when not even around the car. The below figure is a representation of a
block diagram which illustrates how the processes in the EGT take place.
ATDT
Motor
The conditioning of the
signal and the switching
The loud
speakers
The Arduino
microcontroller
The Return
display
LED switching
Signal
T
i
m
i
n
g
S
i
g
n
a
l
Alarm Power
Serial Data
might impiously affect the engine.
Objective
The main objective of the project therefore is to give satisfactory evidence of the field
work study of a system which can be implemented in to car owners by the use of the thermistor
and off items which are needed.
Project description
The project developed in order to measure the amount of the temperature in the motor
engine will be a non inversely do the monitoring of the EGT in the engine a vehicle. In order to
give a human interface interaction to the system, system was developed by the employment of
the atmospheric air temperature detection which is available for commercial purposes. In this
case, the atmospheric air temperature detection will produce a signal which will be later undergo
filtration and also amplification. The amplification is done so that the signal can be easily
processed using the Microprocessor controller board. The calculations of the EGT are all done
by the microprocessor controller board since the controller board is programmed with the codes
which are used to calculated the EGT, Robinson et al (2008). Once the calculations have been
done by the Arduino, then it outputs the results which is the percentage of the EGT . This is done
in the serial port. The board is designed in such a way that once the EGT of the patient is
detected to be below 50 percent, then an alarm is triggered using a command from the
microprocessor controller. By so doing, the driver can be able to know the level of the
temperature degree when not even around the car. The below figure is a representation of a
block diagram which illustrates how the processes in the EGT take place.
ATDT
Motor
The conditioning of the
signal and the switching
The loud
speakers
The Arduino
microcontroller
The Return
display
LED switching
Signal
T
i
m
i
n
g
S
i
g
n
a
l
Alarm Power
Serial Data
⊘ This is a preview!⊘
Do you want full access?
Subscribe today to unlock all pages.
Trusted by 1+ million students worldwide
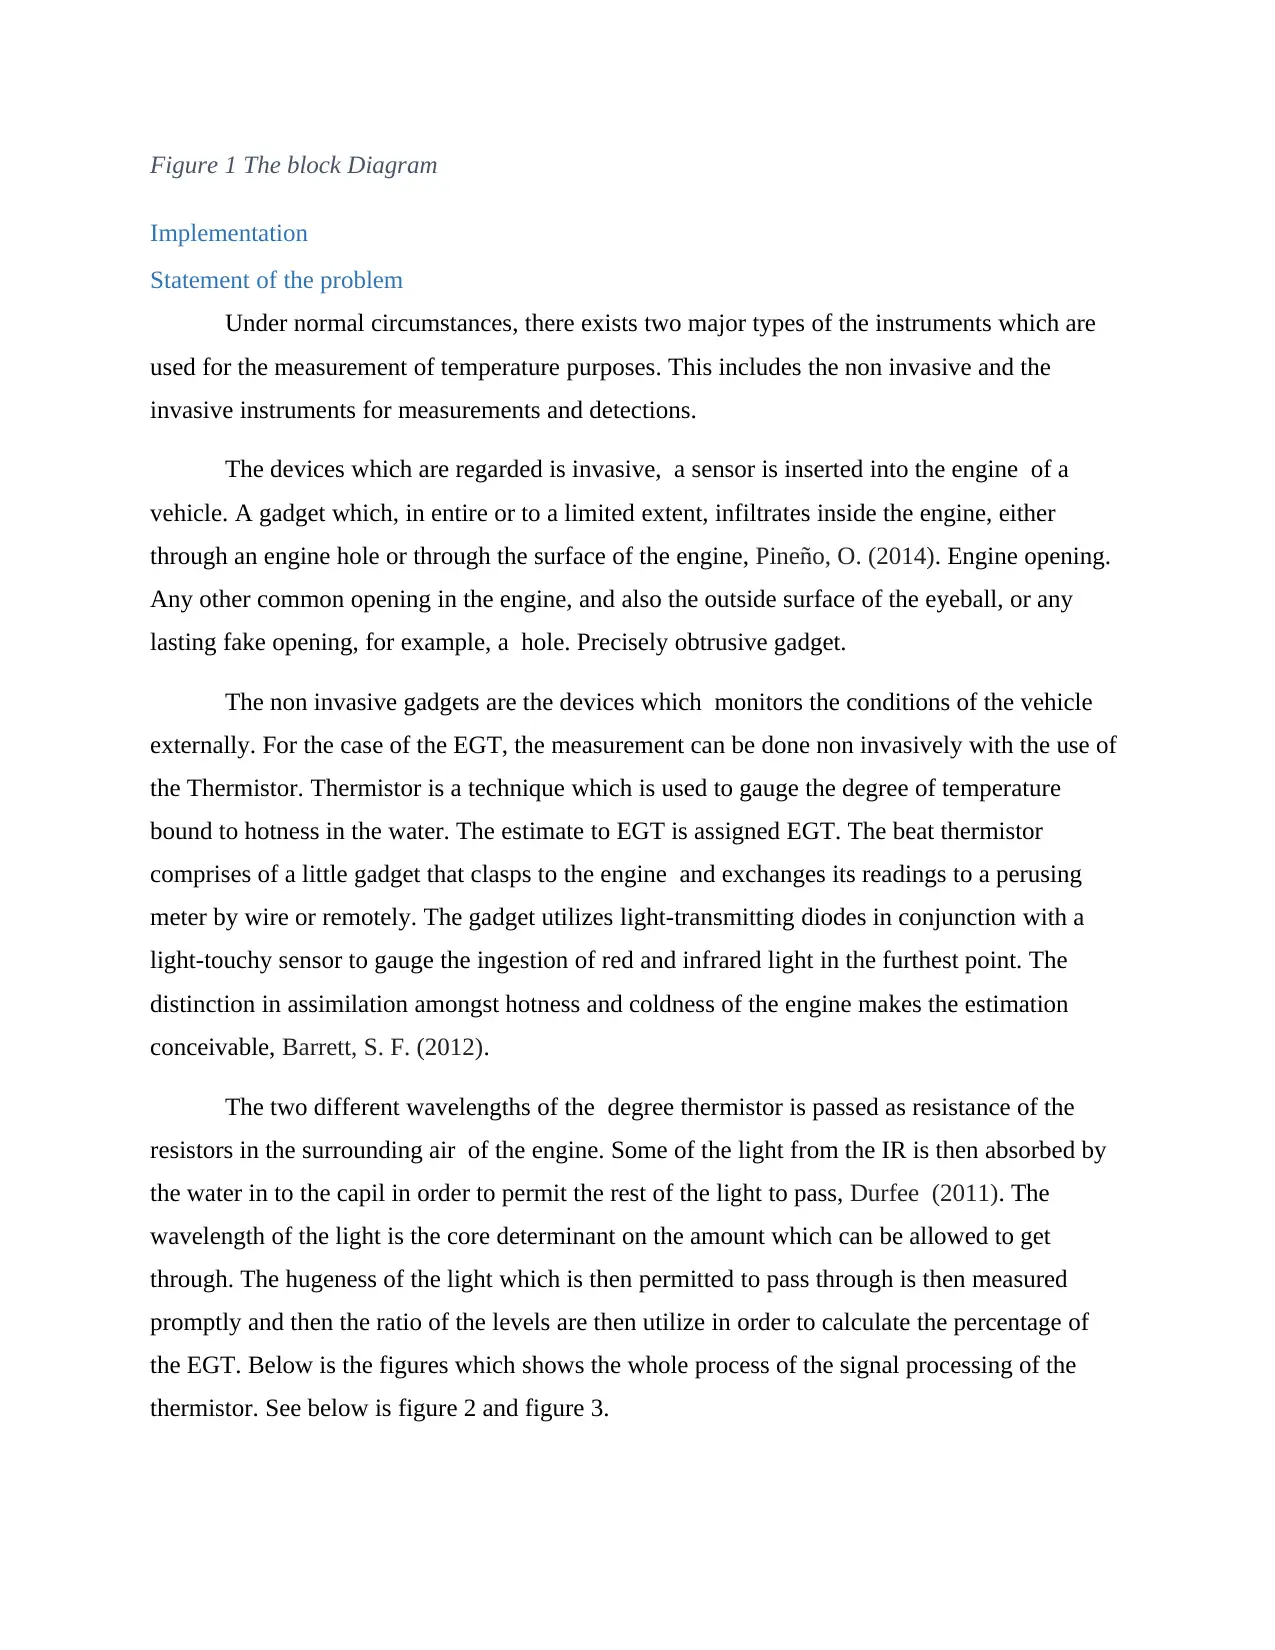
Figure 1 The block Diagram
Implementation
Statement of the problem
Under normal circumstances, there exists two major types of the instruments which are
used for the measurement of temperature purposes. This includes the non invasive and the
invasive instruments for measurements and detections.
The devices which are regarded is invasive, a sensor is inserted into the engine of a
vehicle. A gadget which, in entire or to a limited extent, infiltrates inside the engine, either
through an engine hole or through the surface of the engine, Pineño, O. (2014). Engine opening.
Any other common opening in the engine, and also the outside surface of the eyeball, or any
lasting fake opening, for example, a hole. Precisely obtrusive gadget.
The non invasive gadgets are the devices which monitors the conditions of the vehicle
externally. For the case of the EGT, the measurement can be done non invasively with the use of
the Thermistor. Thermistor is a technique which is used to gauge the degree of temperature
bound to hotness in the water. The estimate to EGT is assigned EGT. The beat thermistor
comprises of a little gadget that clasps to the engine and exchanges its readings to a perusing
meter by wire or remotely. The gadget utilizes light-transmitting diodes in conjunction with a
light-touchy sensor to gauge the ingestion of red and infrared light in the furthest point. The
distinction in assimilation amongst hotness and coldness of the engine makes the estimation
conceivable, Barrett, S. F. (2012).
The two different wavelengths of the degree thermistor is passed as resistance of the
resistors in the surrounding air of the engine. Some of the light from the IR is then absorbed by
the water in to the capil in order to permit the rest of the light to pass, Durfee (2011). The
wavelength of the light is the core determinant on the amount which can be allowed to get
through. The hugeness of the light which is then permitted to pass through is then measured
promptly and then the ratio of the levels are then utilize in order to calculate the percentage of
the EGT. Below is the figures which shows the whole process of the signal processing of the
thermistor. See below is figure 2 and figure 3.
Paraphrase This Document
Need a fresh take? Get an instant paraphrase of this document with our AI Paraphraser
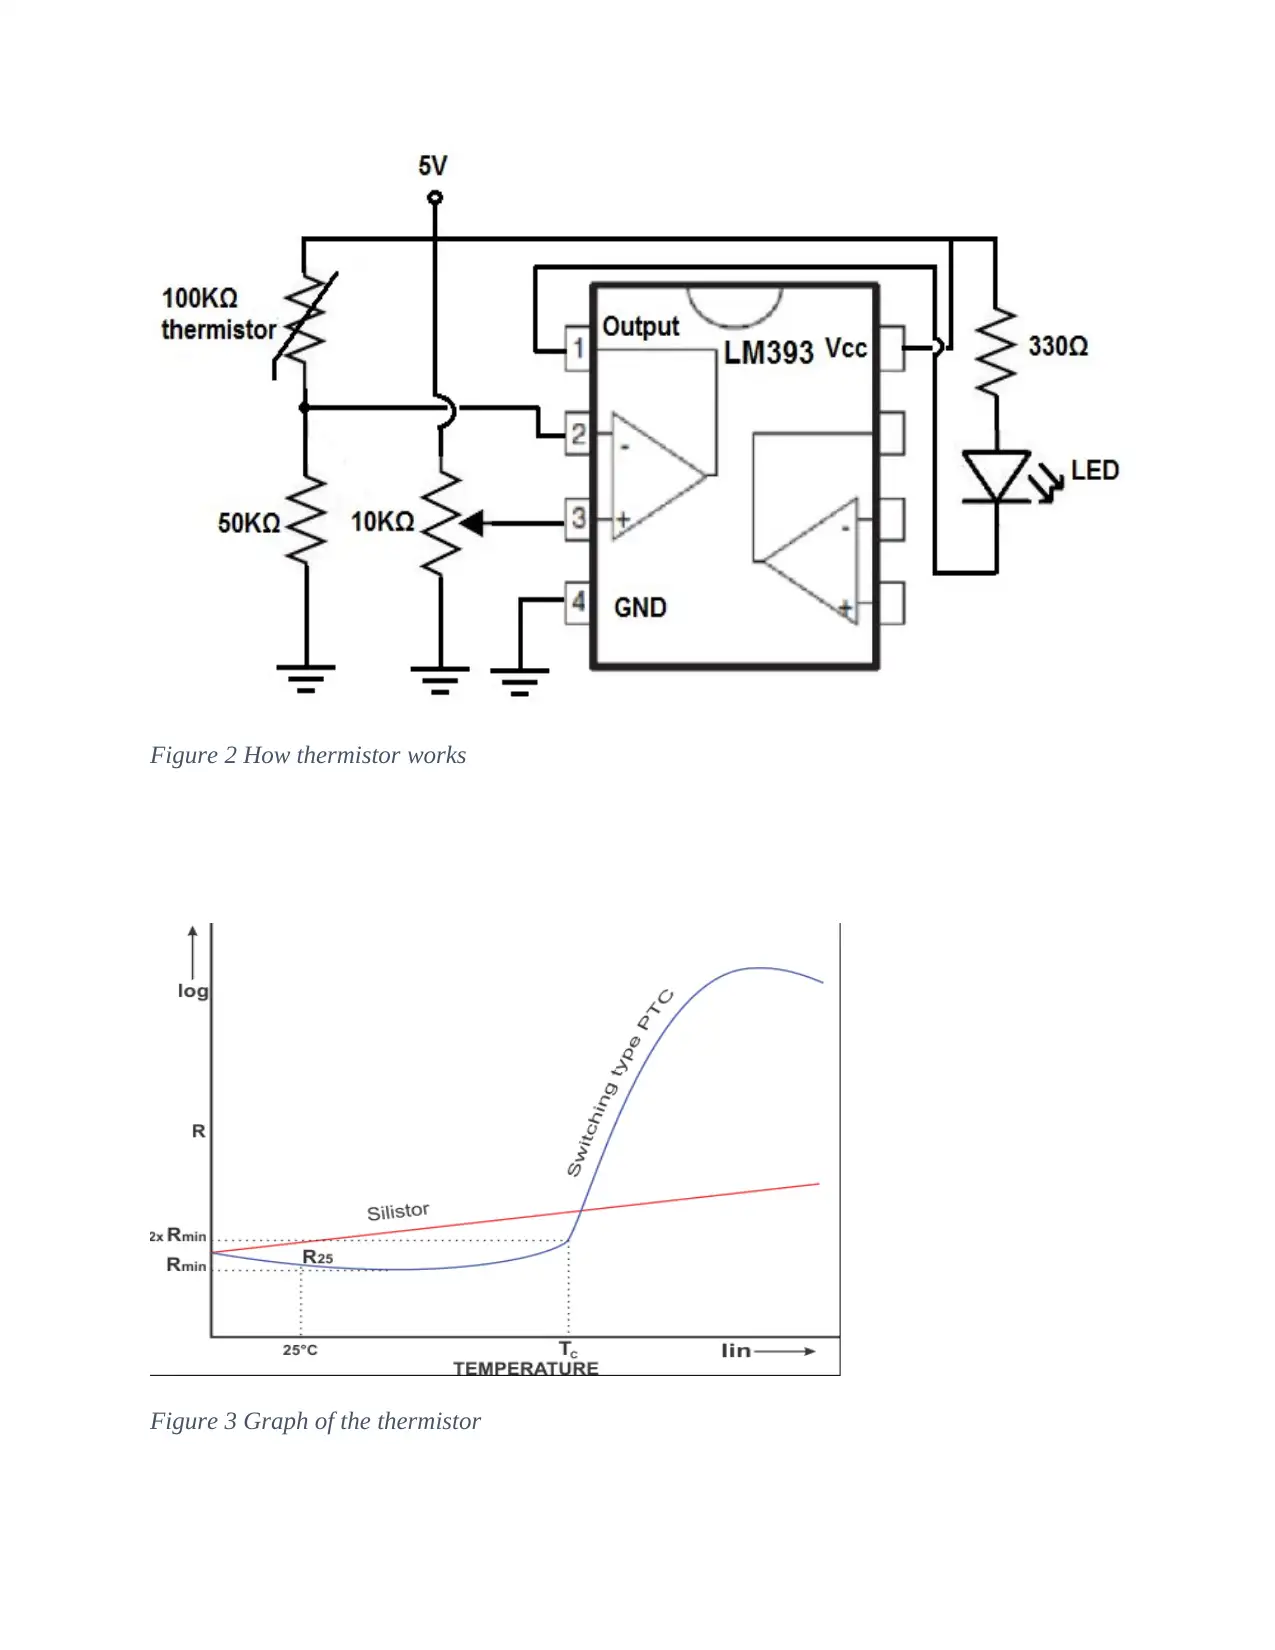
Figure 2 How thermistor works
Figure 3 Graph of the thermistor
Figure 3 Graph of the thermistor
Task Division
In order to make the development of the project more shift and easy, the development of the
project was then broken down into smaller tasks which are called modules. The modules helps
much in the management of the project and also makes it possible for the multiple tasks to be
done at the same time. This includes the following modules;
i. The selection and designing of the sensor
ii. The designing of the conditioning circuits of the signal
iii. The designing of the device for the output
iv. Writing the codes, programming the software using Arduino programming language.
v. Testing and adjusting the program to fit the minimum requirement of the software
vi. Writing the documentation of the software stating the functionality of the software.
The problem faced during development
During the development of the project, the thermistor which was utilized as the first
detector was constructed basing on the shape of the original thermistor the two LEDs together
with the diode of the photo. The design of the thermistor was then unreliable and also inaccurate
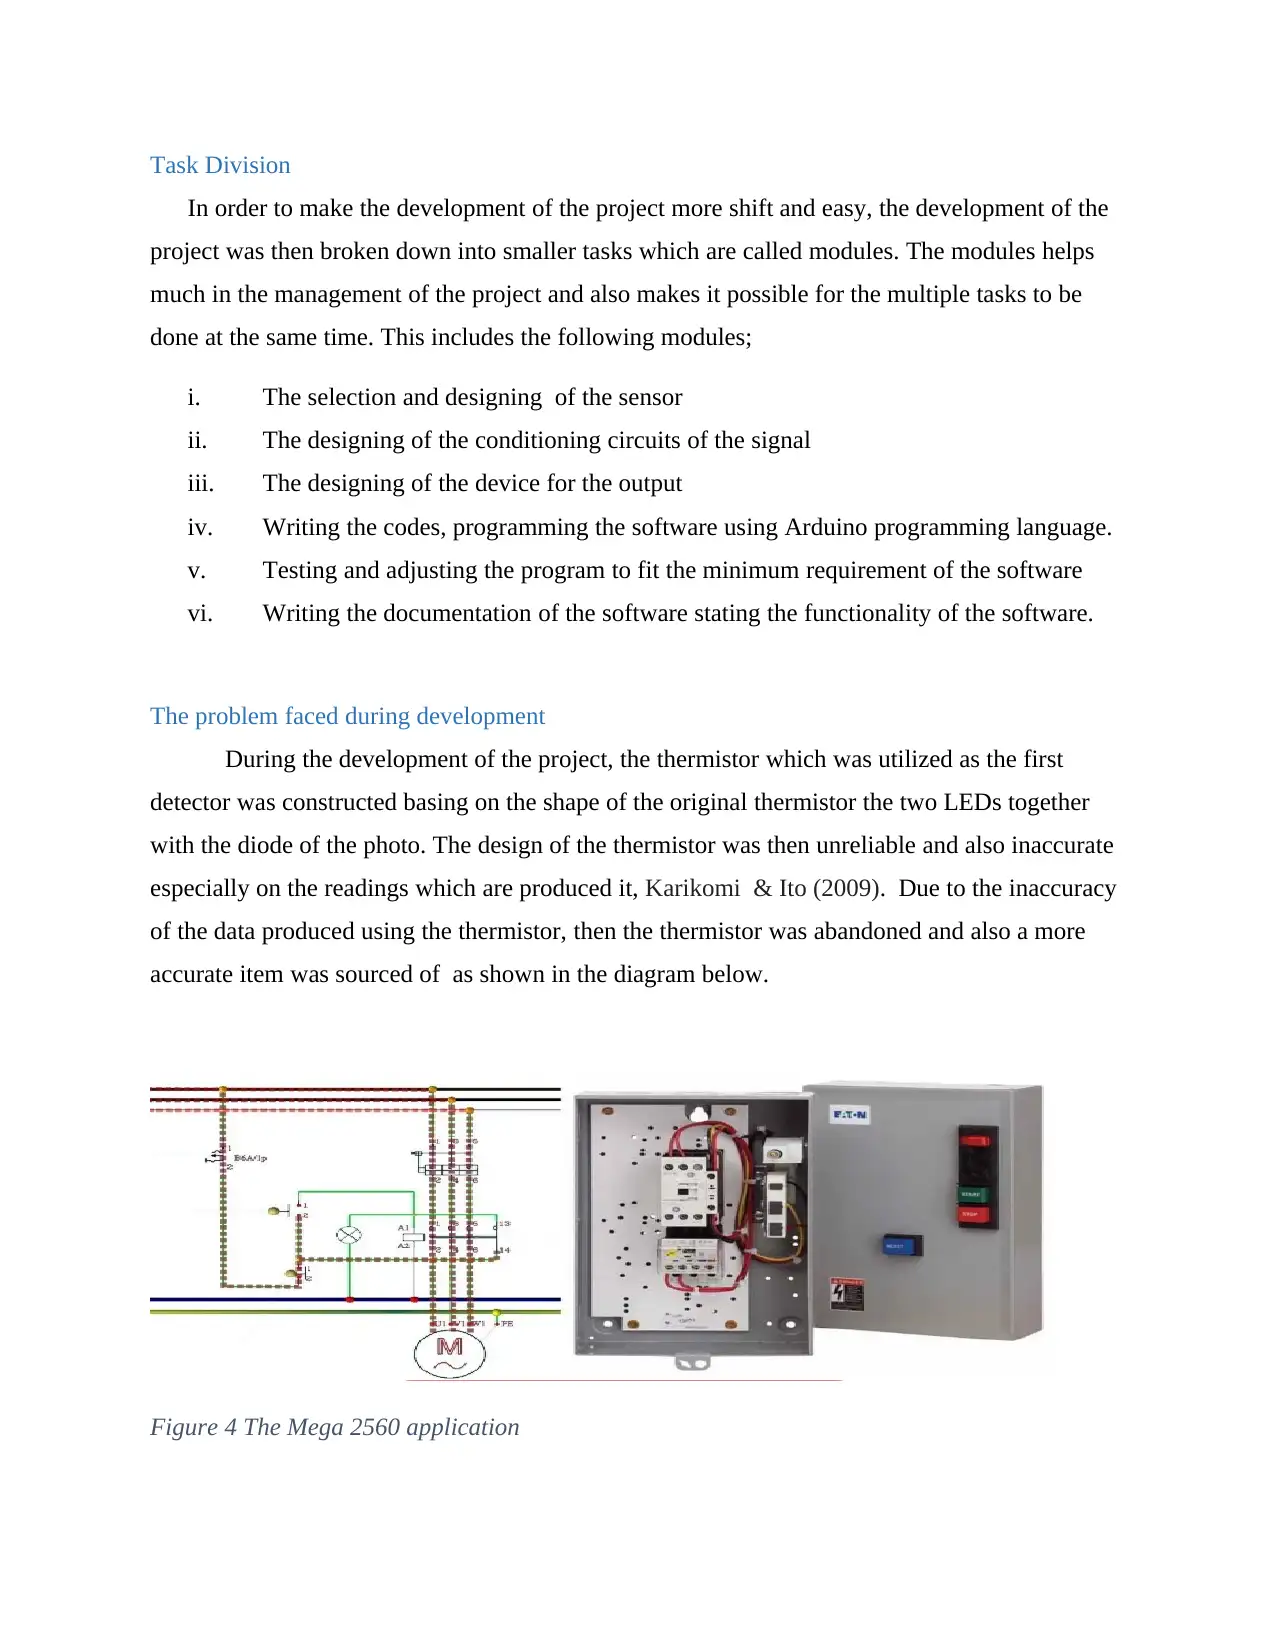
especially on the readings which are produced it, Karikomi & Ito (2009). Due to the inaccuracy
of the data produced using the thermistor, then the thermistor was abandoned and also a more
accurate item was sourced of as shown in the diagram below.
Figure 4 The Mega 2560 application
In order to make the development of the project more shift and easy, the development of the
project was then broken down into smaller tasks which are called modules. The modules helps
much in the management of the project and also makes it possible for the multiple tasks to be
done at the same time. This includes the following modules;
i. The selection and designing of the sensor
ii. The designing of the conditioning circuits of the signal
iii. The designing of the device for the output
iv. Writing the codes, programming the software using Arduino programming language.
v. Testing and adjusting the program to fit the minimum requirement of the software
vi. Writing the documentation of the software stating the functionality of the software.
The problem faced during development
During the development of the project, the thermistor which was utilized as the first
detector was constructed basing on the shape of the original thermistor the two LEDs together
with the diode of the photo. The design of the thermistor was then unreliable and also inaccurate
especially on the readings which are produced it, Karikomi & Ito (2009). Due to the inaccuracy
of the data produced using the thermistor, then the thermistor was abandoned and also a more
accurate item was sourced of as shown in the diagram below.
Figure 4 The Mega 2560 application
⊘ This is a preview!⊘
Do you want full access?
Subscribe today to unlock all pages.
Trusted by 1+ million students worldwide
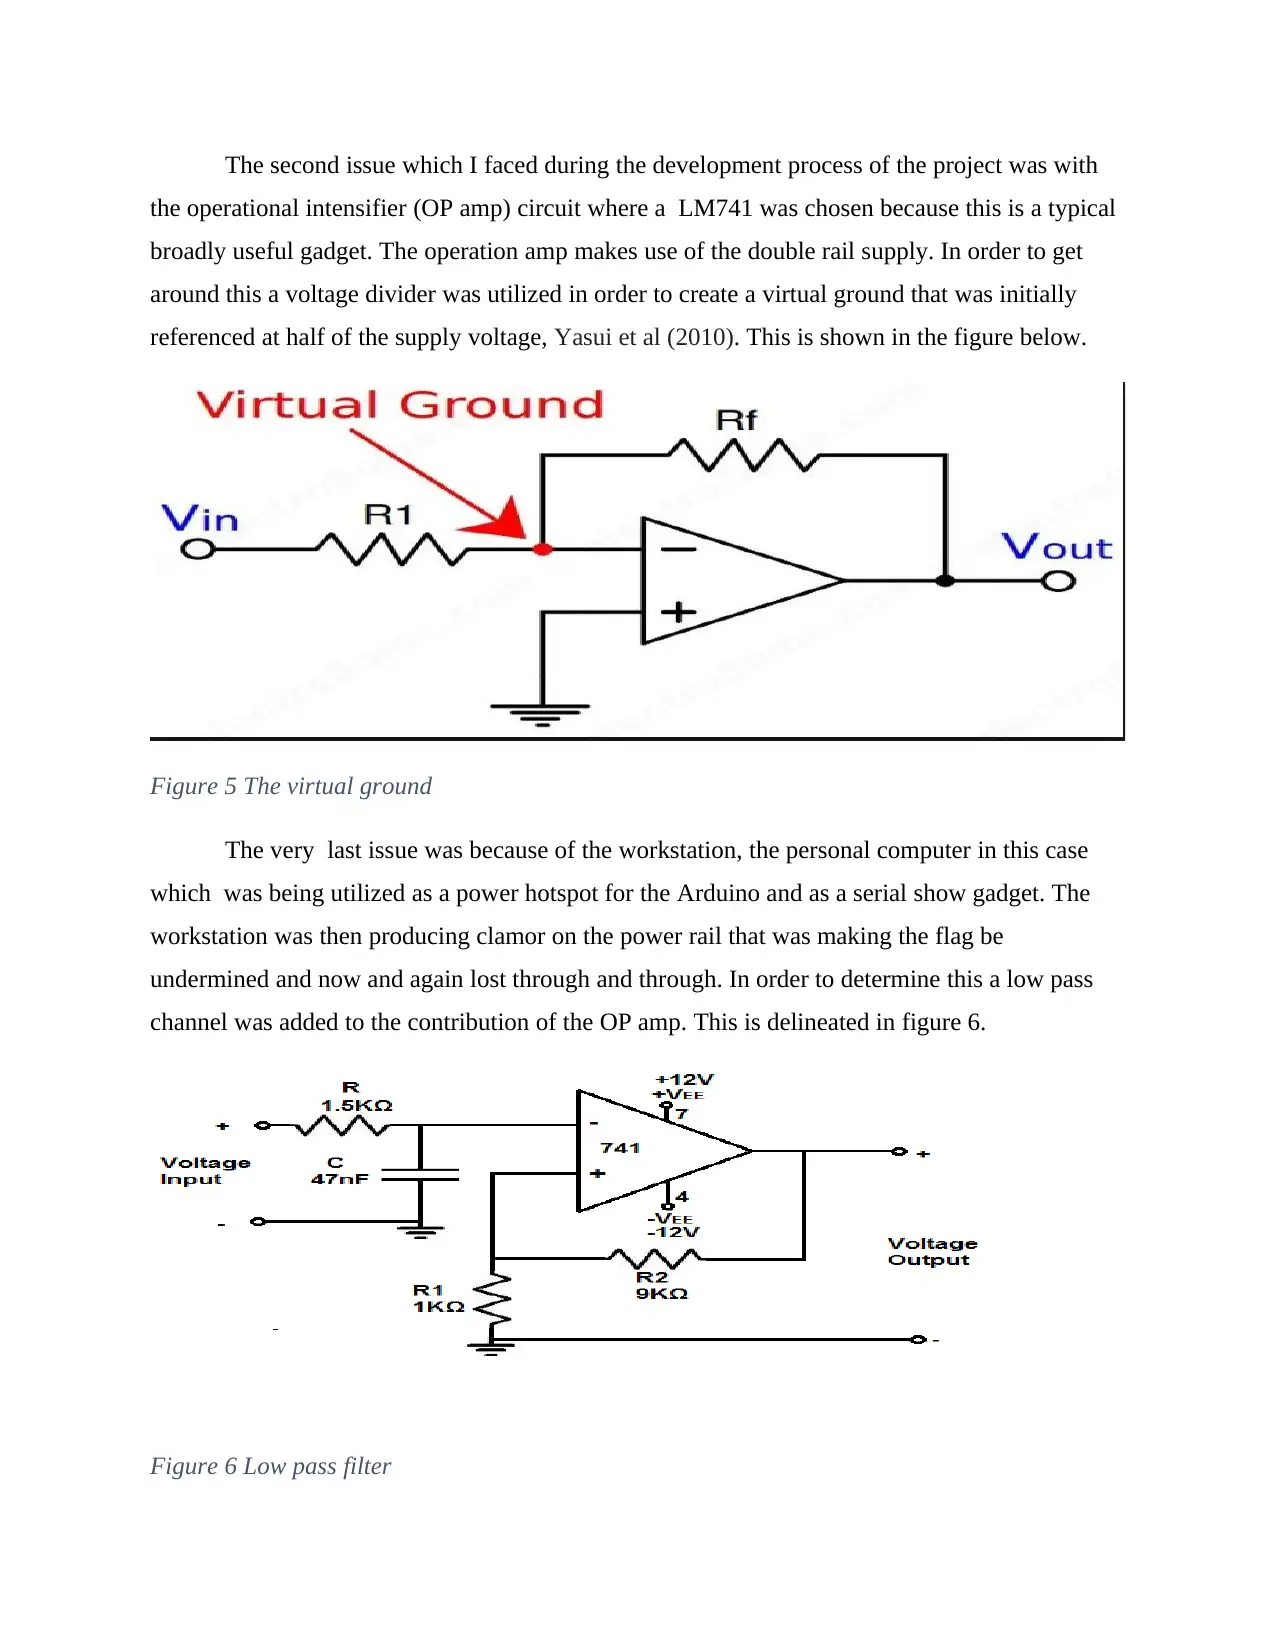
The second issue which I faced during the development process of the project was with
the operational intensifier (OP amp) circuit where a LM741 was chosen because this is a typical
broadly useful gadget. The operation amp makes use of the double rail supply. In order to get
around this a voltage divider was utilized in order to create a virtual ground that was initially
referenced at half of the supply voltage, Yasui et al (2010). This is shown in the figure below.
Figure 5 The virtual ground
The very last issue was because of the workstation, the personal computer in this case
which was being utilized as a power hotspot for the Arduino and as a serial show gadget. The
workstation was then producing clamor on the power rail that was making the flag be
undermined and now and again lost through and through. In order to determine this a low pass
channel was added to the contribution of the OP amp. This is delineated in figure 6.
Figure 6 Low pass filter
Paraphrase This Document
Need a fresh take? Get an instant paraphrase of this document with our AI Paraphraser

Sensor selection
Identification of the types of sensor
During the process of the selection of the sensor which was used in the development of the
project, the sensor which was selected was the Mega 2560, this type of sensor is very much
cheap in price, it is also available readily hence the main reason as to why this was selected apart
from it serving the purposes very well. The connector which was chosen during the identification
process was the CF2 connector, Badamasi, Y. A. (2014, September). The following components
are the composition of the sensor.
a. The CF2 connector which is used to connect the pulse oximeter of the sensor device.
b. The resistor which is rated at 4500 Ohms is utilized in the hospital equipment grade in
order to determine the sensor type.
c. The diode which is red in colour named D1, this is utilize in I order to generate the light
with the wavelength of around 660nm.
d. The diode for the infrared which is name D2 , this is used in order to generate the light of
the wavelength of around 940 nm.
e. The diode of the photo, named as the D3, this is utilized in the measurement of the light
which is then transmitted through the finger.
f. The spring which is made from the plastic material used as the loading clip in order
clamp the patient finger into the sensor.
Accordign to Cai et al (2014), Apart from the above stated components which are the
composition of the sensor, the shielding of the cable was also done in order to reduce the
interference due to electromagnetic. The detector was producing the low level current which is
varying and it is dependent to the quantity of the light which is then cast onto the photo diode.
By so doing, the same makes the device analogue, for the purpose of data collection process ,
Barrett, S. F. (2013), the Arduino microcontroller board which will be utilized needs the voltage
and for that reason an amplifier called the trans impedance was then utilized for the purpose of
converting the current to the voltage state, this also provides the necessary gain and making it
possible for the voltage to be read easily. The below is the diagram of the sensor and indicated in
the figure 7 below.
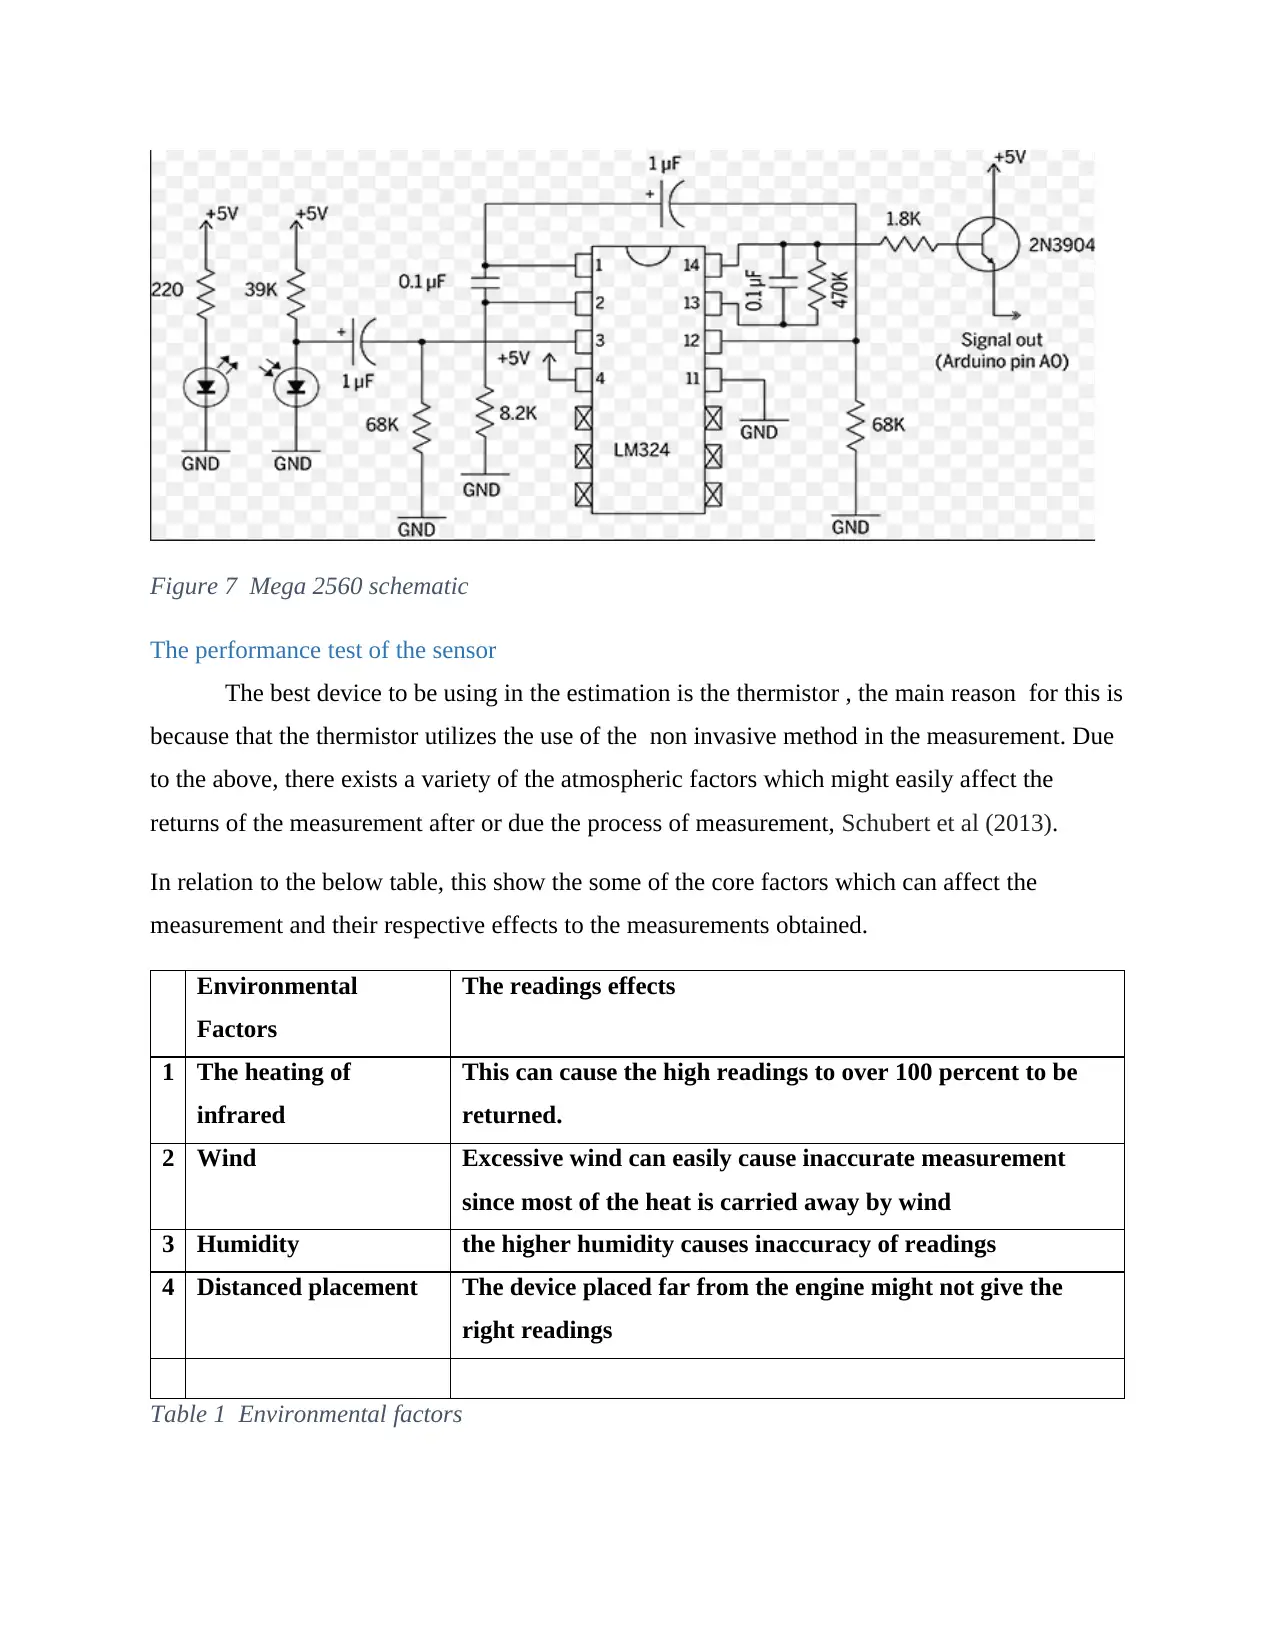
Figure 7 Mega 2560 schematic
The performance test of the sensor
The best device to be using in the estimation is the thermistor , the main reason for this is
because that the thermistor utilizes the use of the non invasive method in the measurement. Due
to the above, there exists a variety of the atmospheric factors which might easily affect the
returns of the measurement after or due the process of measurement, Schubert et al (2013).
In relation to the below table, this show the some of the core factors which can affect the
measurement and their respective effects to the measurements obtained.
Environmental
Factors
The readings effects
1 The heating of
infrared
This can cause the high readings to over 100 percent to be
returned.
2 Wind Excessive wind can easily cause inaccurate measurement
since most of the heat is carried away by wind
3 Humidity the higher humidity causes inaccuracy of readings
4 Distanced placement The device placed far from the engine might not give the
right readings
Table 1 Environmental factors
⊘ This is a preview!⊘
Do you want full access?
Subscribe today to unlock all pages.
Trusted by 1+ million students worldwide
1 out of 17
Your All-in-One AI-Powered Toolkit for Academic Success.
+13062052269
info@desklib.com
Available 24*7 on WhatsApp / Email
![[object Object]](/_next/static/media/star-bottom.7253800d.svg)
Unlock your academic potential
Copyright © 2020–2026 A2Z Services. All Rights Reserved. Developed and managed by ZUCOL.