Determining Engineering Properties of Soil Using Sieve Analysis
VerifiedAdded on 2023/06/10
|7
|869
|379
AI Summary
This lab report details the process of determining the engineering properties of soil through sieve analysis. The report includes a complete data set, a particle size distribution curve, and the determination of effective and mean particle diameters. Permeability is calculated using Henzan's equati...
1
LAB REPORT: FINDING OUT THE ENGINEERING PROPERTIES OF THE SOILS USING STANDARD PRINCIPLES
(SIEVE ANALYSIS TEST)
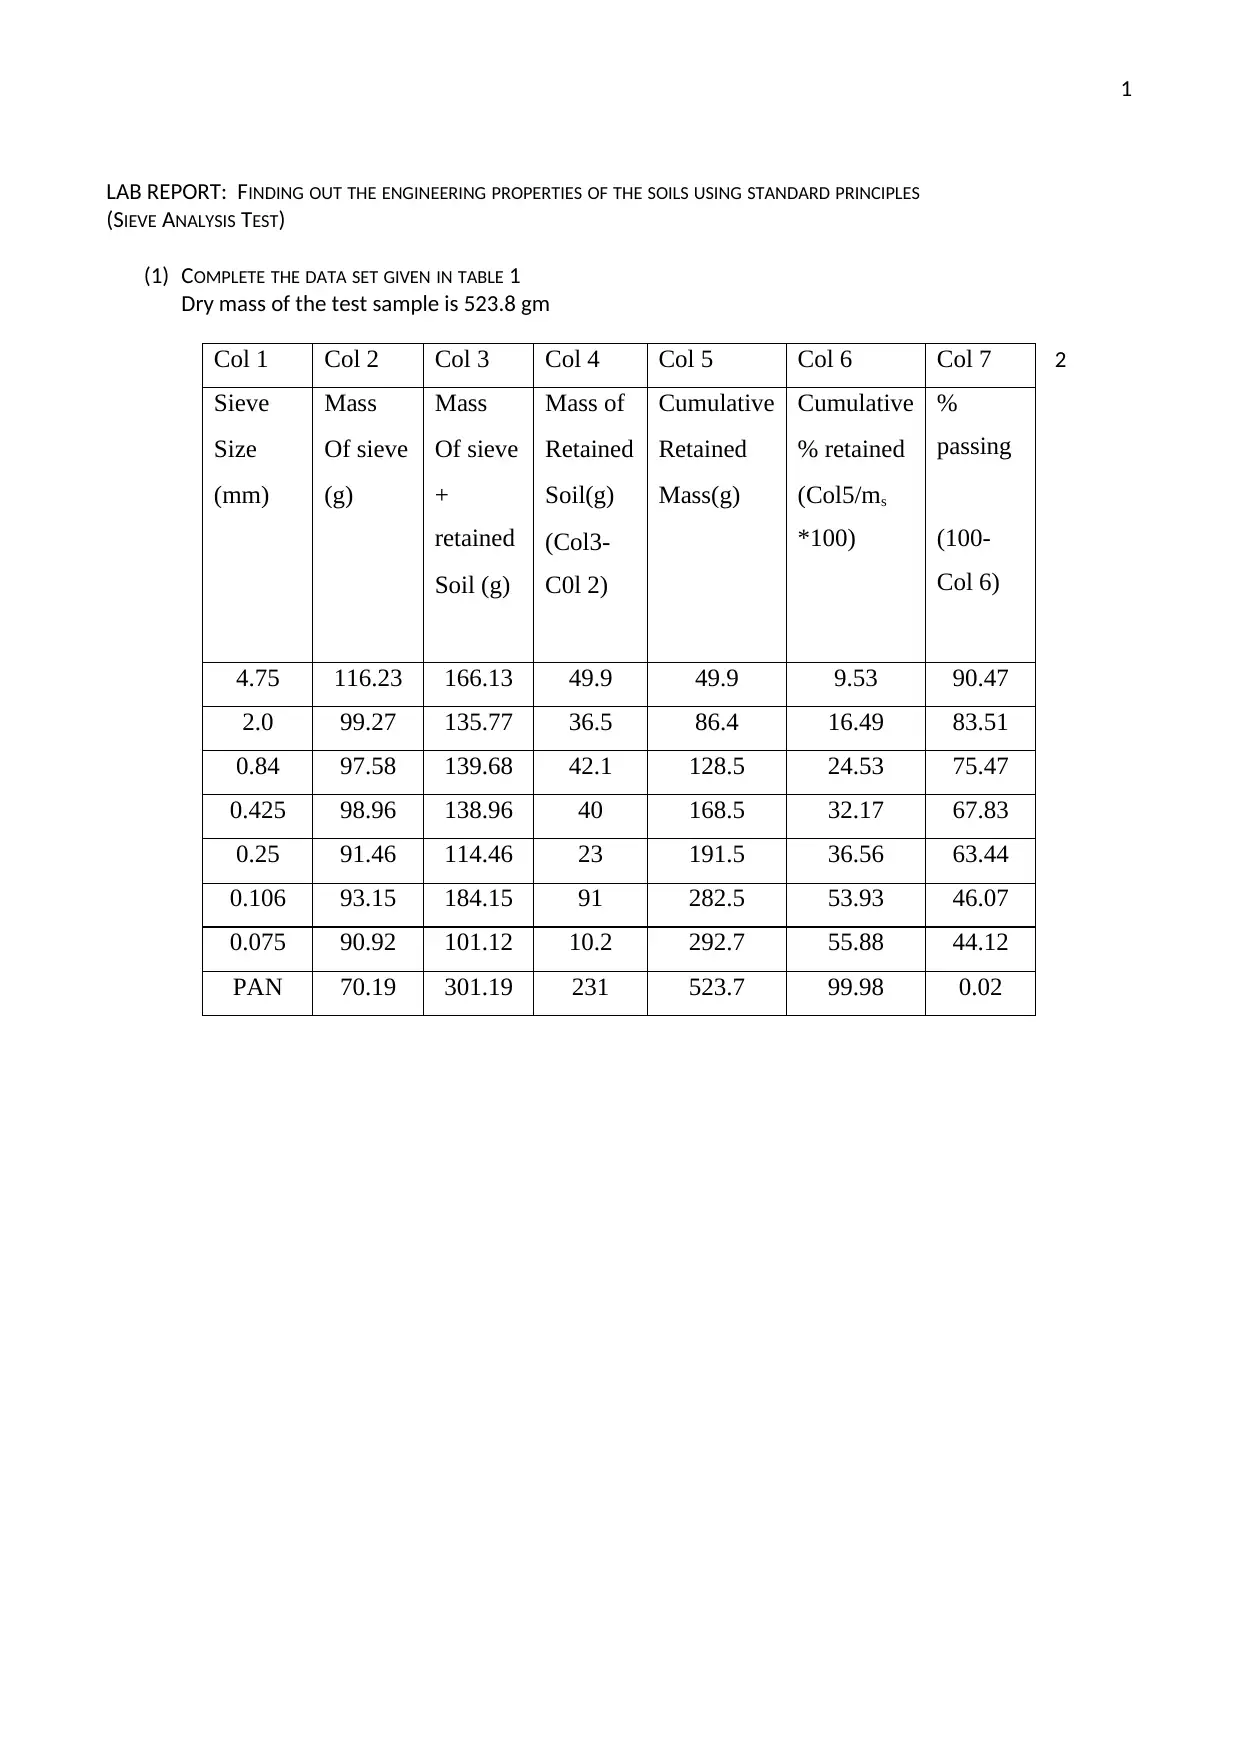
(1) COMPLETE THE DATA SET GIVEN IN TABLE 1
Dry mass of the test sample is 523.8 gm
2Col 1 Col 2 Col 3 Col 4 Col 5 Col 6 Col 7
Sieve
Size
(mm)
Mass
Of sieve
(g)
Mass
Of sieve
+
retained
Soil (g)
Mass of
Retained
Soil(g)
(Col3-
C0l 2)
Cumulative
Retained
Mass(g)
Cumulative
% retained
(Col5/ms
*100)
%
passing
(100-
Col 6)
4.75 116.23 166.13 49.9 49.9 9.53 90.47
2.0 99.27 135.77 36.5 86.4 16.49 83.51
0.84 97.58 139.68 42.1 128.5 24.53 75.47
0.425 98.96 138.96 40 168.5 32.17 67.83
0.25 91.46 114.46 23 191.5 36.56 63.44
0.106 93.15 184.15 91 282.5 53.93 46.07
0.075 90.92 101.12 10.2 292.7 55.88 44.12
PAN 70.19 301.19 231 523.7 99.98 0.02
LAB REPORT: FINDING OUT THE ENGINEERING PROPERTIES OF THE SOILS USING STANDARD PRINCIPLES
(SIEVE ANALYSIS TEST)
(1) COMPLETE THE DATA SET GIVEN IN TABLE 1
Dry mass of the test sample is 523.8 gm
2Col 1 Col 2 Col 3 Col 4 Col 5 Col 6 Col 7
Sieve
Size
(mm)
Mass
Of sieve
(g)
Mass
Of sieve
+
retained
Soil (g)
Mass of
Retained
Soil(g)
(Col3-
C0l 2)
Cumulative
Retained
Mass(g)
Cumulative
% retained
(Col5/ms
*100)
%
passing
(100-
Col 6)
4.75 116.23 166.13 49.9 49.9 9.53 90.47
2.0 99.27 135.77 36.5 86.4 16.49 83.51
0.84 97.58 139.68 42.1 128.5 24.53 75.47
0.425 98.96 138.96 40 168.5 32.17 67.83
0.25 91.46 114.46 23 191.5 36.56 63.44
0.106 93.15 184.15 91 282.5 53.93 46.07
0.075 90.92 101.12 10.2 292.7 55.88 44.12
PAN 70.19 301.19 231 523.7 99.98 0.02
Paraphrase This Document
Need a fresh take? Get an instant paraphrase of this document with our AI Paraphraser
2
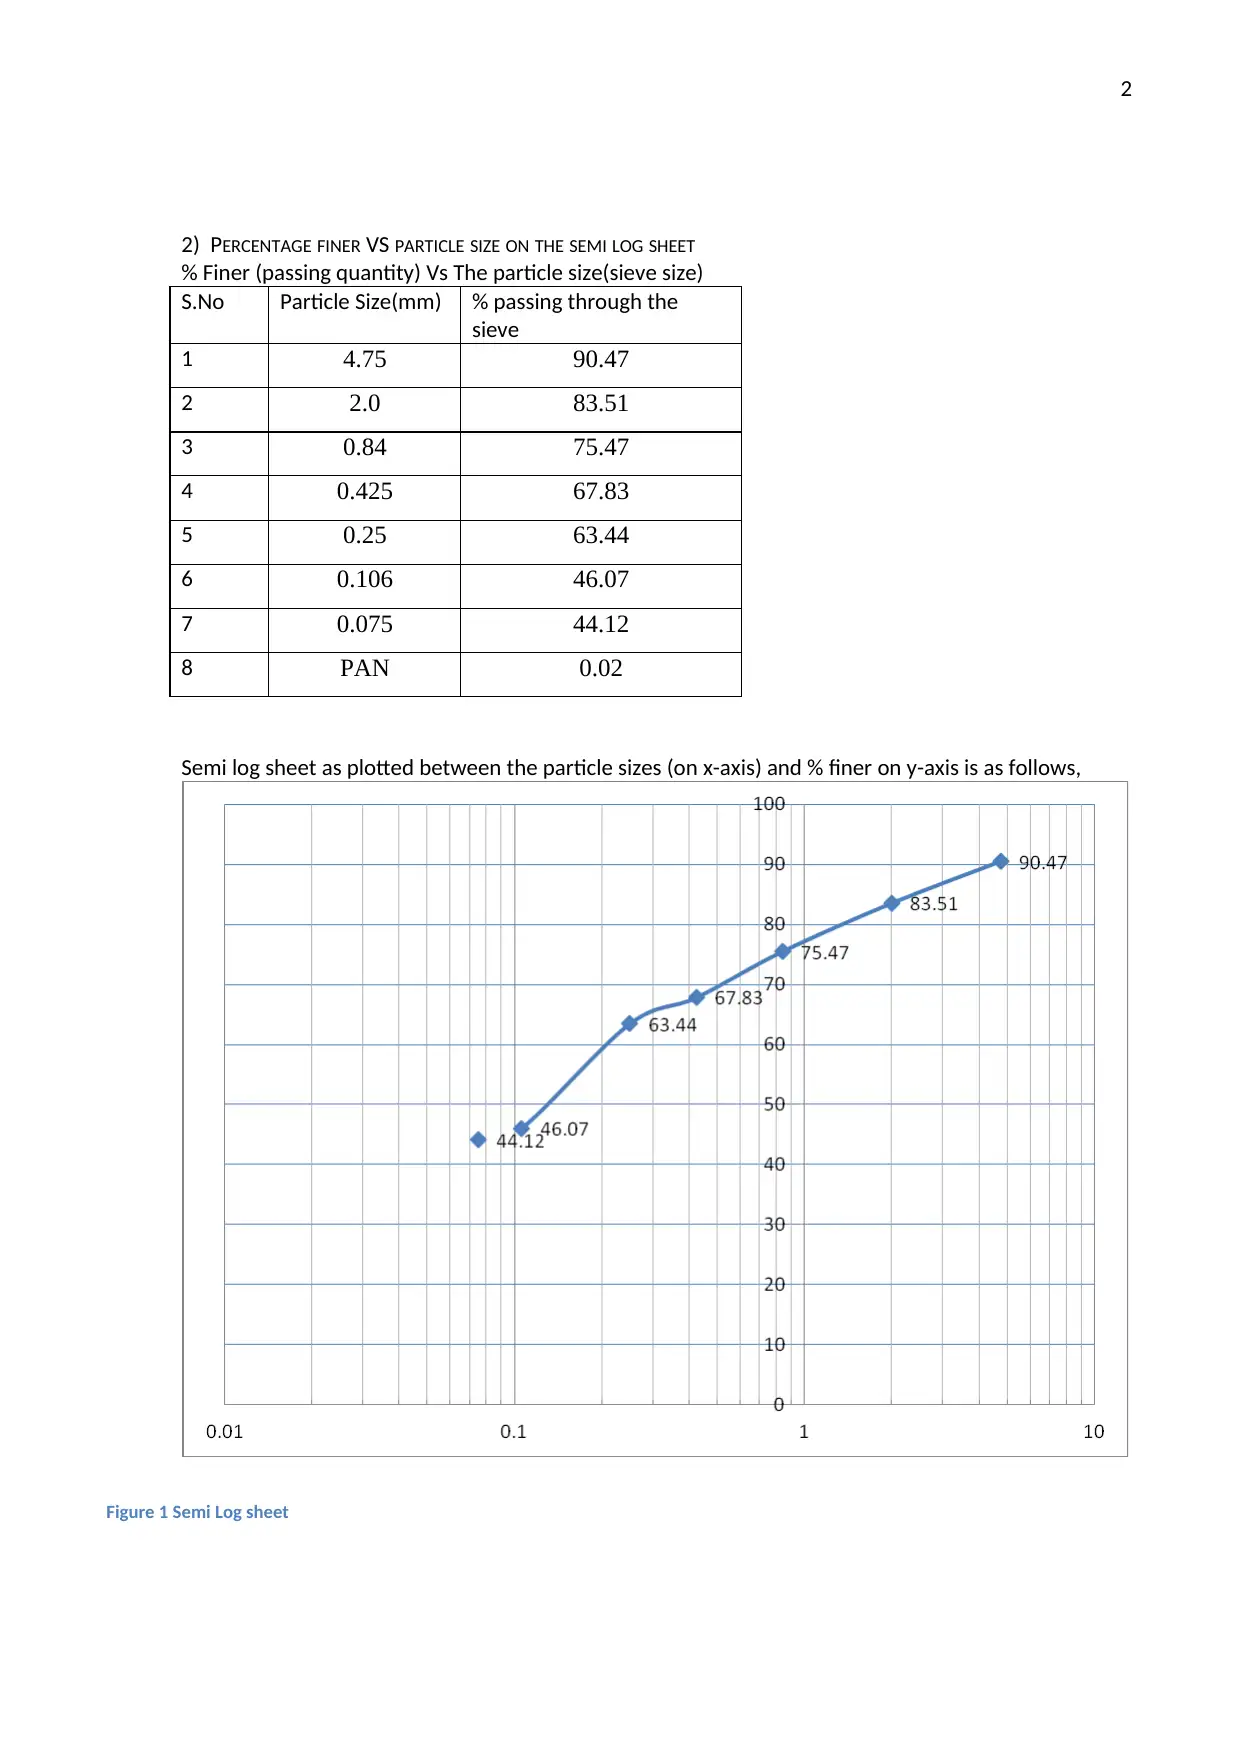
2) PERCENTAGE FINER VS PARTICLE SIZE ON THE SEMI LOG SHEET
% Finer (passing quantity) Vs The particle size(sieve size)
S.No Particle Size(mm) % passing through the
sieve
1 4.75 90.47
2 2.0 83.51
3 0.84 75.47
4 0.425 67.83
5 0.25 63.44
6 0.106 46.07
7 0.075 44.12
8 PAN 0.02
Semi log sheet as plotted between the particle sizes (on x-axis) and % finer on y-axis is as follows,
Figure 1 Semi Log sheet
3
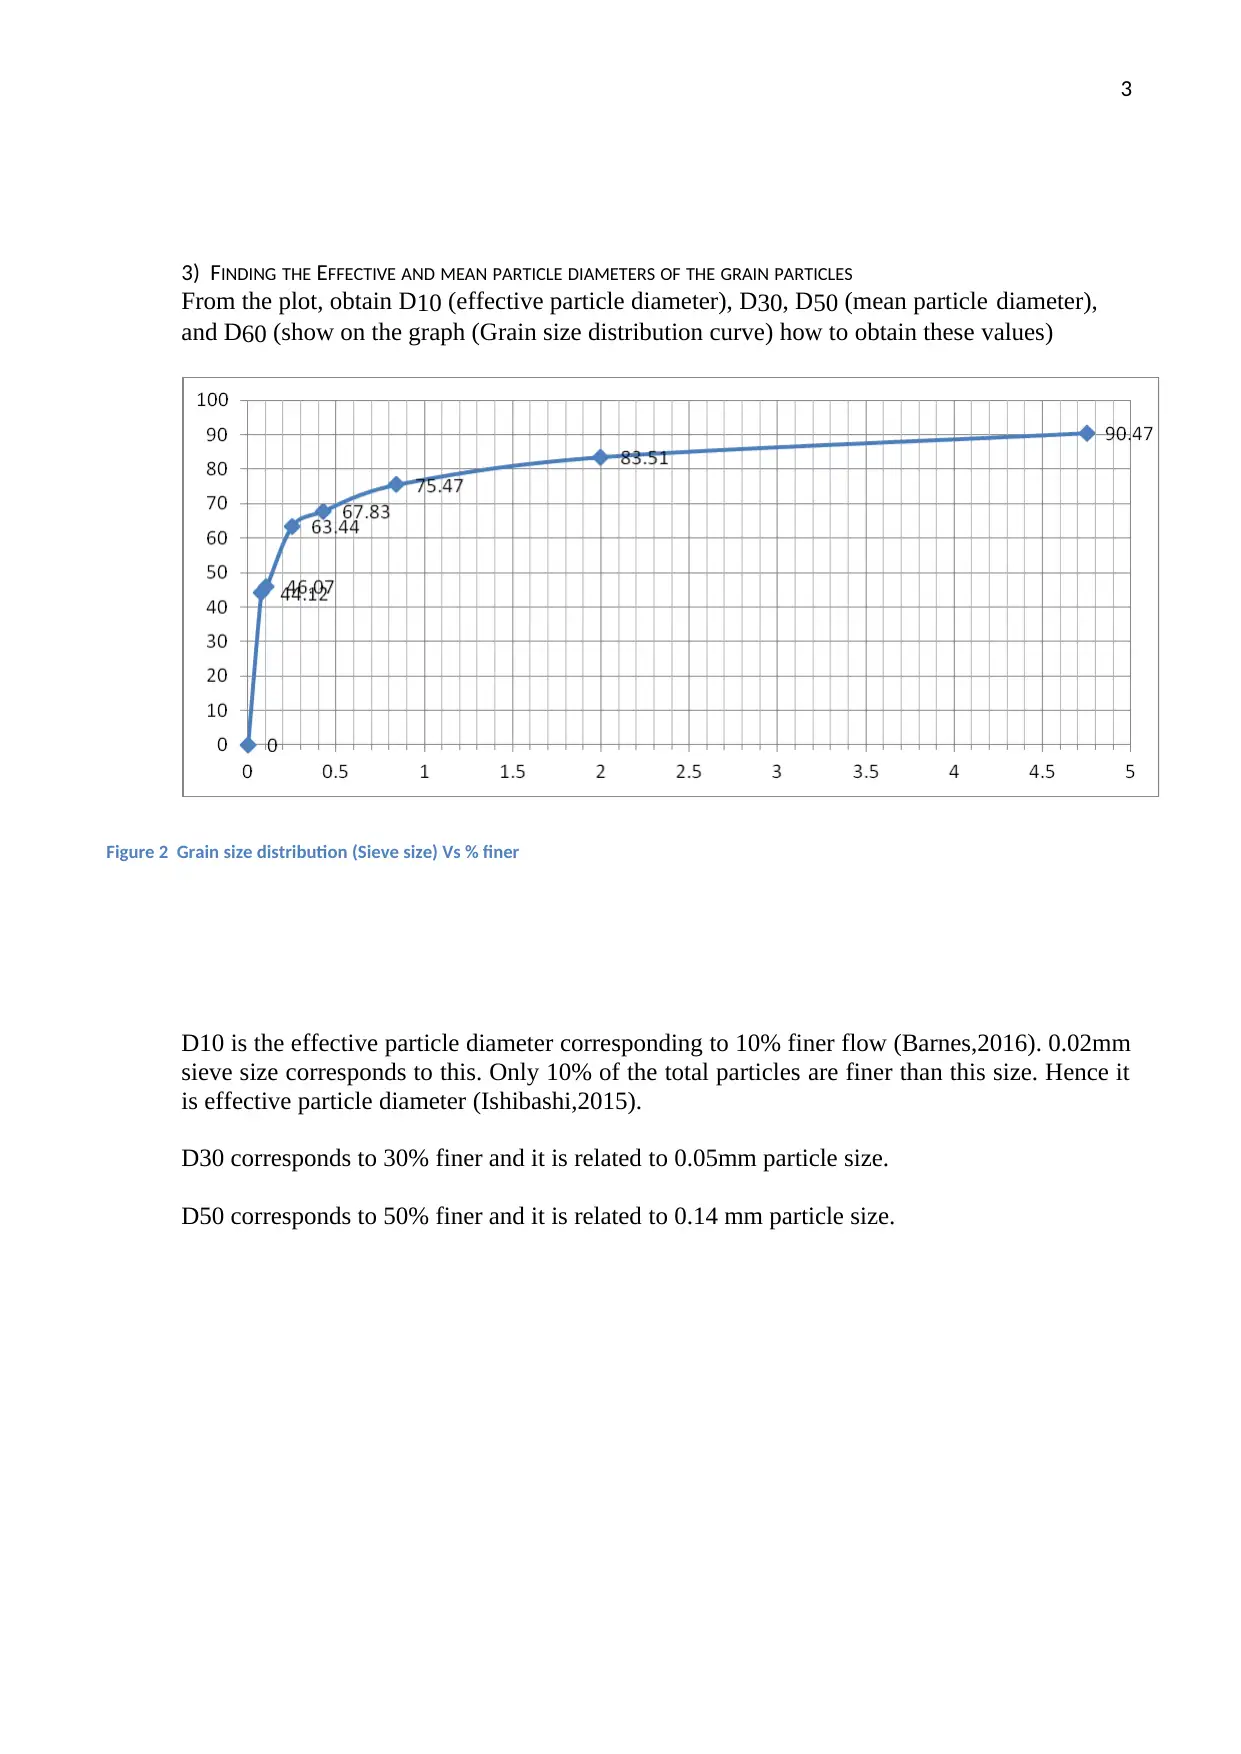
3) FINDING THE EFFECTIVE AND MEAN PARTICLE DIAMETERS OF THE GRAIN PARTICLES
From the plot, obtain D10 (effective particle diameter), D30, D50 (mean particle diameter),
and D60 (show on the graph (Grain size distribution curve) how to obtain these values)
Figure 2 Grain size distribution (Sieve size) Vs % finer
D10 is the effective particle diameter corresponding to 10% finer flow (Barnes,2016). 0.02mm
sieve size corresponds to this. Only 10% of the total particles are finer than this size. Hence it
is effective particle diameter (Ishibashi,2015).
D30 corresponds to 30% finer and it is related to 0.05mm particle size.
D50 corresponds to 50% finer and it is related to 0.14 mm particle size.
⊘ This is a preview!⊘
Do you want full access?
Subscribe today to unlock all pages.
Trusted by 1+ million students worldwide

4
4) DETERMINATION OF PERMEABILITY
Permeability of the soil using Henzan’s equation
K = 10-2 * (D10)2 = 10-2 * (0.02)2 = 4*10-6m/s
Hence the permeability of the given soil sample is 4* 10-6m/s
4) DETERMINATION OF PERMEABILITY
Permeability of the soil using Henzan’s equation
K = 10-2 * (D10)2 = 10-2 * (0.02)2 = 4*10-6m/s
Hence the permeability of the given soil sample is 4* 10-6m/s
Paraphrase This Document
Need a fresh take? Get an instant paraphrase of this document with our AI Paraphraser

5
5) DETERMINATION OF THE COEFFICIENT OF UNIFORMITY AND THE COEFFICIENT OF CURVATURE
Calculate the coefficient of uniformity (CU) and the coefficient of curvature (CZ) for this soil
Cu is the coefficient of uniformity and can be computed from the values of D60 and D10.
From Fig-2, D60 can be computed as 0.21mm.
Hence coefficient of uniformity (CU) = D60/D10 = 0.21/0.02 = 10.5
Coefficient of curvature (CZ) = D302/ (D10*D60) = 0.052/0.02*0.21 = 0.595
6
6) ENGINEERING APPLICATIONS OF THE SIEVE ANALYSIS:
Applications of sieve analysis are vast in civil engineering. Sieve analysis is very popular due
to the fact that it is quite easy to employ, further it will not cost much investment as well.
Gradation of the particles will impact the appropriate aggregate selection for engineering
applications (Pino et al, 2015). Sieve analysis can be employed to find the effective particle
diameters as well can be employed to decide the appropriateness of given soil for the
engineering applications being met with (Jury, 2018). The key outcome of the sieve analysis is
the particle distribution curve and this will be of use of plenty of applications ranging from
finding the particle size distribution trends, coefficient of uniformity as well as coefficient of
curvature. These factors will of great usage for deciding the ultimate soil properties and
deciding the applicability of the soil for the selected application. Though there are several
other alternative applications to the sieve analysis, it is the most cheapest and easy to apply
process (Rowell, 2014).
⊘ This is a preview!⊘
Do you want full access?
Subscribe today to unlock all pages.
Trusted by 1+ million students worldwide

7
REFERENCES
Barnes, G. (2016). Soil mechanics: principles and practice. Macmillan International Higher
Education.
Ishibashi, I., & Hazarika, H. (2015). Soil Mechanics Fundamentals and Applications. CRC
Press.
Jury, W. A., & Stolzy, L. H. (2018). Soil physics. In Handbook of Soils and Climate in
Agriculture (pp. 131-158). CRC Press.
Pino, L. F. M., & Baudet, B. A. (2015). The effect of the particle size distribution on the
mechanics of fibre-reinforced sands under one-dimensional compression. Geotextiles and
Geomembranes, 43(3), 250-258.
Rowell, D. L. (2014). Soil science: Methods & applications. Routledge.
1 out of 7

Your All-in-One AI-Powered Toolkit for Academic Success.
+13062052269
info@desklib.com
Available 24*7 on WhatsApp / Email
![[object Object]](/_next/static/media/star-bottom.7253800d.svg)
Unlock your academic potential
© 2024 | Zucol Services PVT LTD | All rights reserved.