Statistics: Environmental Data Analysis - Assignment 11, HW 11
VerifiedAdded on 2022/09/01
|5
|1407
|16
Homework Assignment
AI Summary
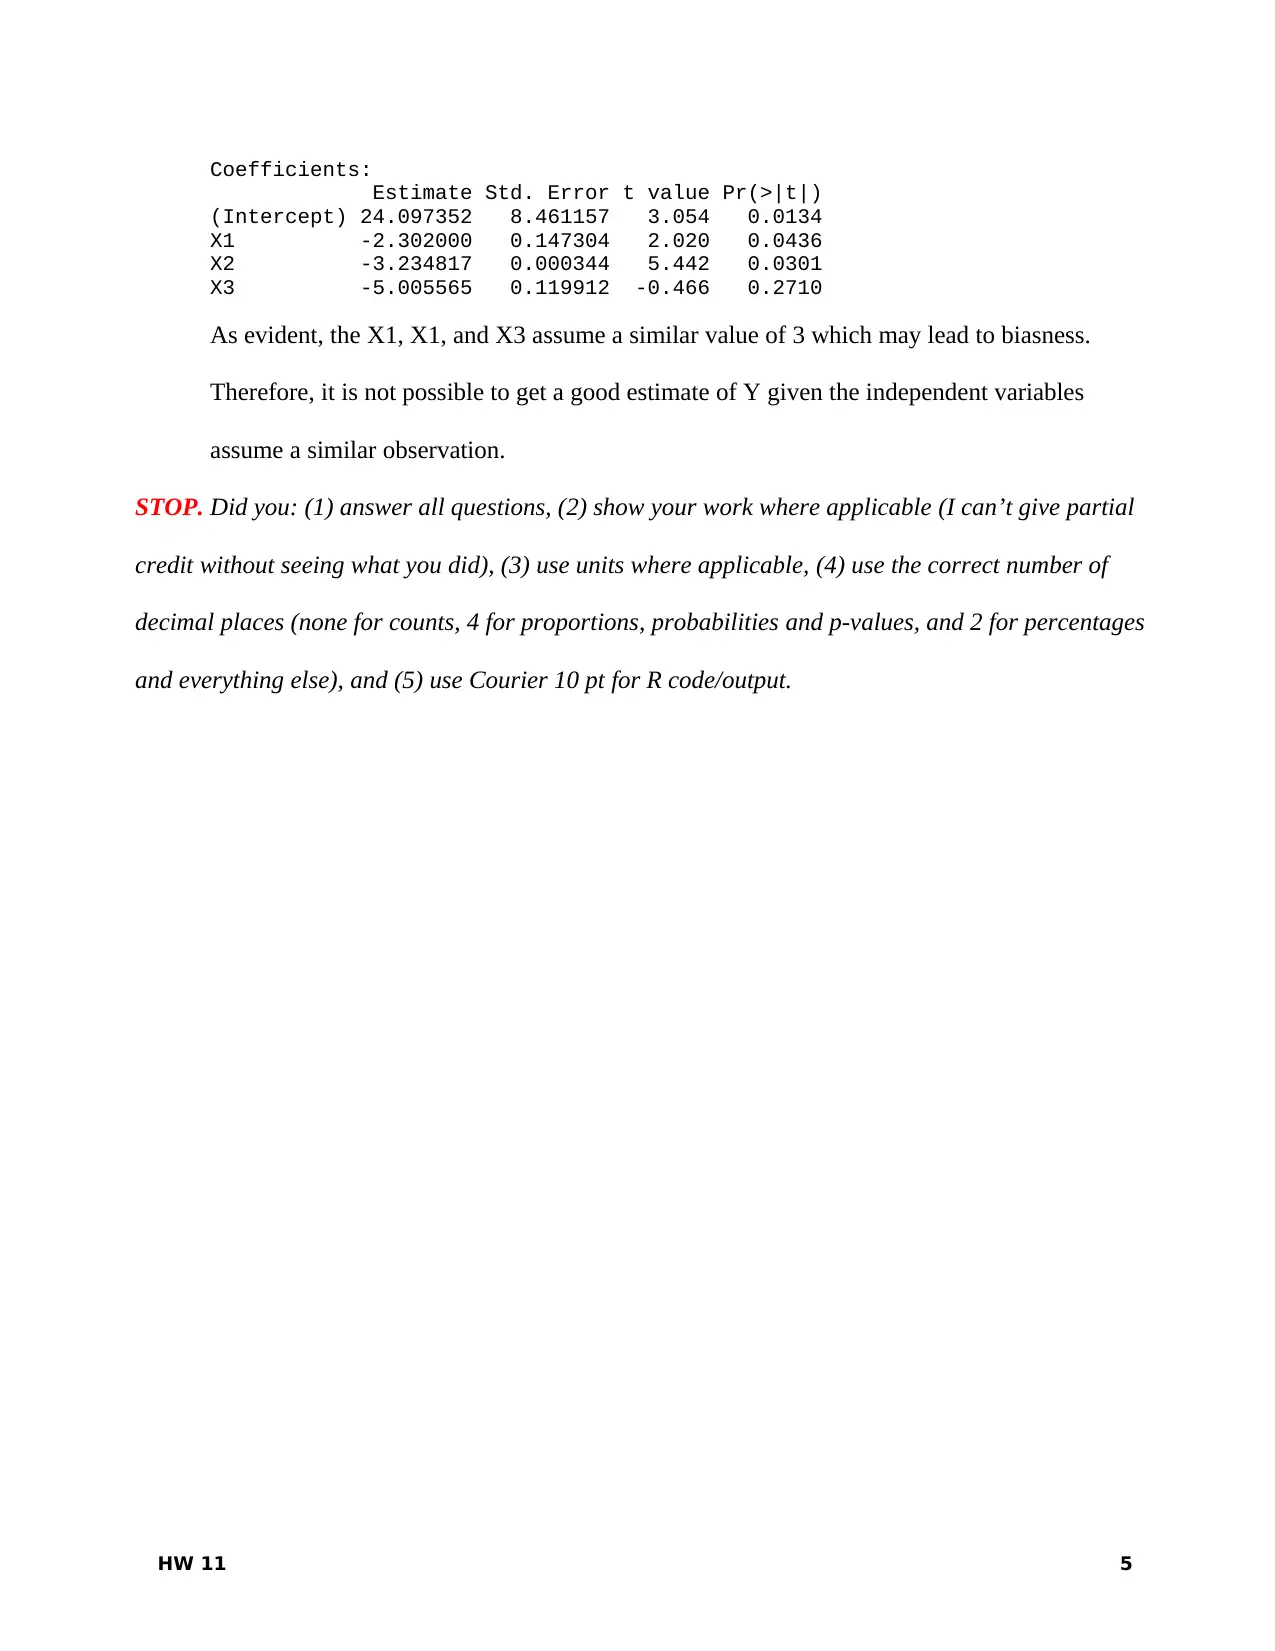
This assignment analyzes environmental data using statistical methods, focusing on regression analysis and model fitting. The student examines the relationship between children's heights and their parents' heights using Galton's data, employing R for model creation and diagnostic plot interpretation. The assignment explores multiple linear models, AIC, and the impact of variables on model performance. It involves fitting various models (father and mother, father only, mother only) and comparing their AIC values to determine the best fit. The student also investigates the impact of gender on the relationship between parent and child heights, along with identifying multiple linear models and interpreting model summaries. The assignment concludes by calculating estimates based on model coefficients and identifying potential issues in model interpretation.
1 out of 5
Your All-in-One AI-Powered Toolkit for Academic Success.
+13062052269
info@desklib.com
Available 24*7 on WhatsApp / Email
![[object Object]](/_next/static/media/star-bottom.7253800d.svg)
Copyright © 2020–2026 A2Z Services. All Rights Reserved. Developed and managed by ZUCOL.