Calculating Prevalence, Incidence, and Mortality Rate in Epidemiology
VerifiedAdded on 2023/06/07
|6
|1289
|496
AI Summary
This article explains how to calculate prevalence, incidence, and mortality rate in epidemiology with examples. It also discusses the difference between descriptive and analytic epidemiology and the concepts of person, place, and time. Real-life scenarios are used to illustrate the calculations and concepts. References are provided for further reading.
Contribute Materials
Your contribution can guide someone’s learning journey. Share your
documents today.
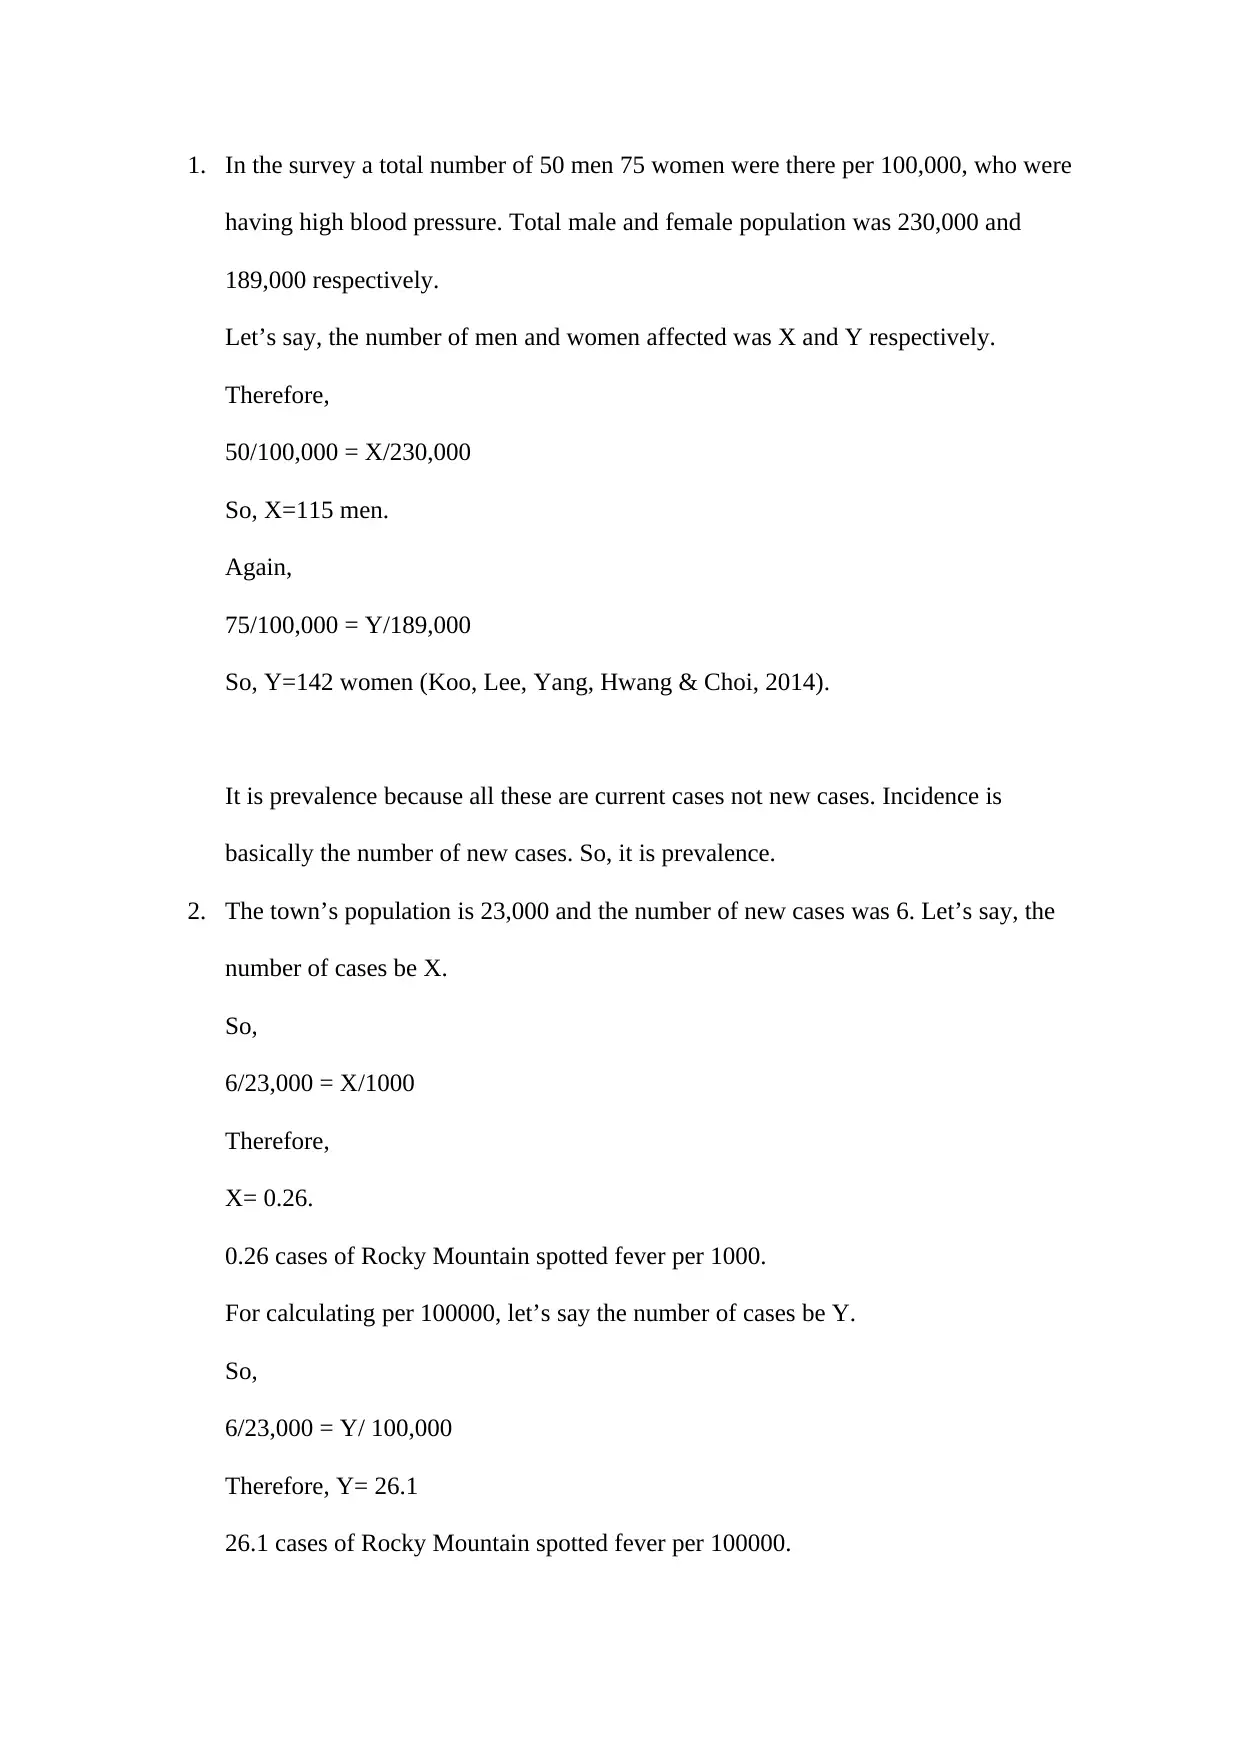
1. In the survey a total number of 50 men 75 women were there per 100,000, who were
having high blood pressure. Total male and female population was 230,000 and
189,000 respectively.
Let’s say, the number of men and women affected was X and Y respectively.
Therefore,
50/100,000 = X/230,000
So, X=115 men.
Again,
75/100,000 = Y/189,000
So, Y=142 women (Koo, Lee, Yang, Hwang & Choi, 2014).
It is prevalence because all these are current cases not new cases. Incidence is
basically the number of new cases. So, it is prevalence.
2. The town’s population is 23,000 and the number of new cases was 6. Let’s say, the
number of cases be X.
So,
6/23,000 = X/1000
Therefore,
X= 0.26.
0.26 cases of Rocky Mountain spotted fever per 1000.
For calculating per 100000, let’s say the number of cases be Y.
So,
6/23,000 = Y/ 100,000
Therefore, Y= 26.1
26.1 cases of Rocky Mountain spotted fever per 100000.
Secure Best Marks with AI Grader
Need help grading? Try our AI Grader for instant feedback on your assignments.
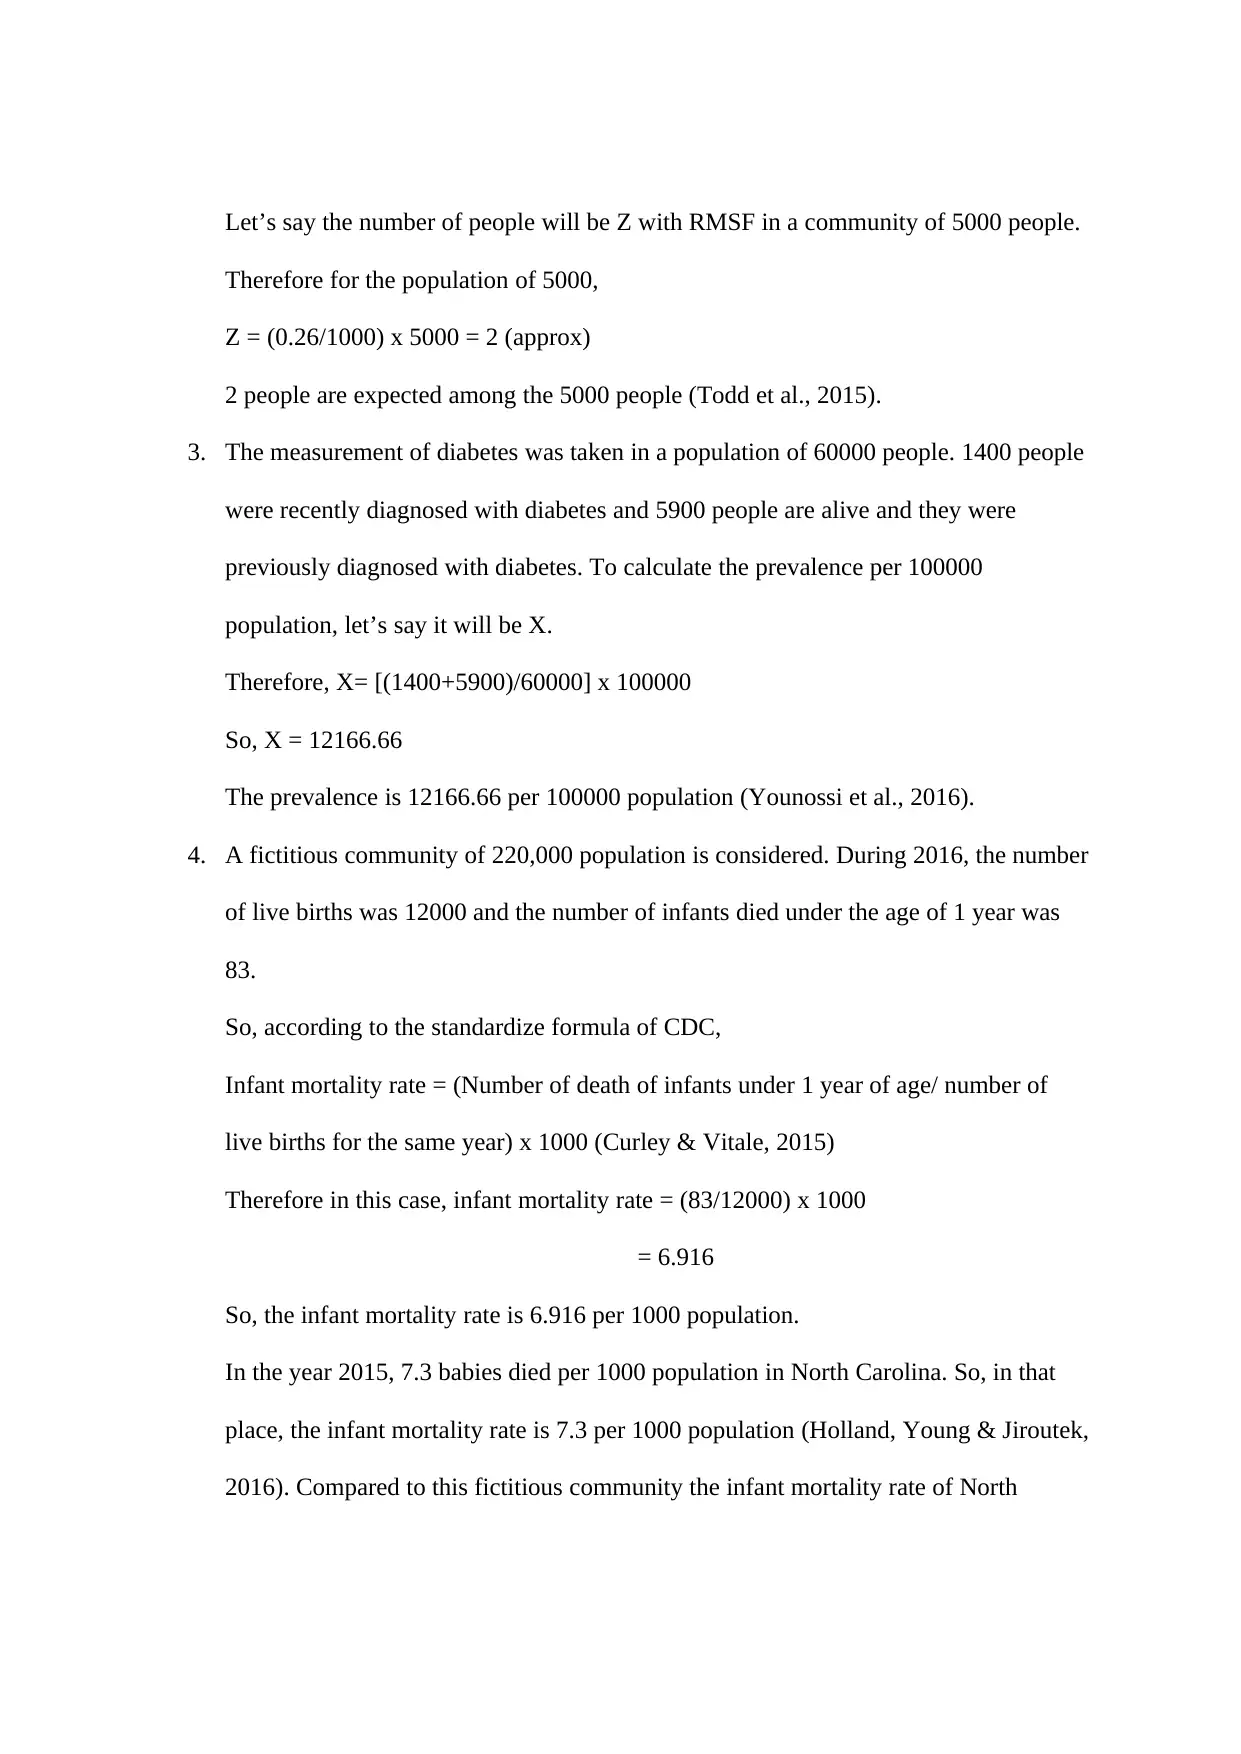
Let’s say the number of people will be Z with RMSF in a community of 5000 people.
Therefore for the population of 5000,
Z = (0.26/1000) x 5000 = 2 (approx)
2 people are expected among the 5000 people (Todd et al., 2015).
3. The measurement of diabetes was taken in a population of 60000 people. 1400 people
were recently diagnosed with diabetes and 5900 people are alive and they were
previously diagnosed with diabetes. To calculate the prevalence per 100000
population, let’s say it will be X.
Therefore, X= [(1400+5900)/60000] x 100000
So, X = 12166.66
The prevalence is 12166.66 per 100000 population (Younossi et al., 2016).
4. A fictitious community of 220,000 population is considered. During 2016, the number
of live births was 12000 and the number of infants died under the age of 1 year was
83.
So, according to the standardize formula of CDC,
Infant mortality rate = (Number of death of infants under 1 year of age/ number of
live births for the same year) x 1000 (Curley & Vitale, 2015)
Therefore in this case, infant mortality rate = (83/12000) x 1000
= 6.916
So, the infant mortality rate is 6.916 per 1000 population.
In the year 2015, 7.3 babies died per 1000 population in North Carolina. So, in that
place, the infant mortality rate is 7.3 per 1000 population (Holland, Young & Jiroutek,
2016). Compared to this fictitious community the infant mortality rate of North
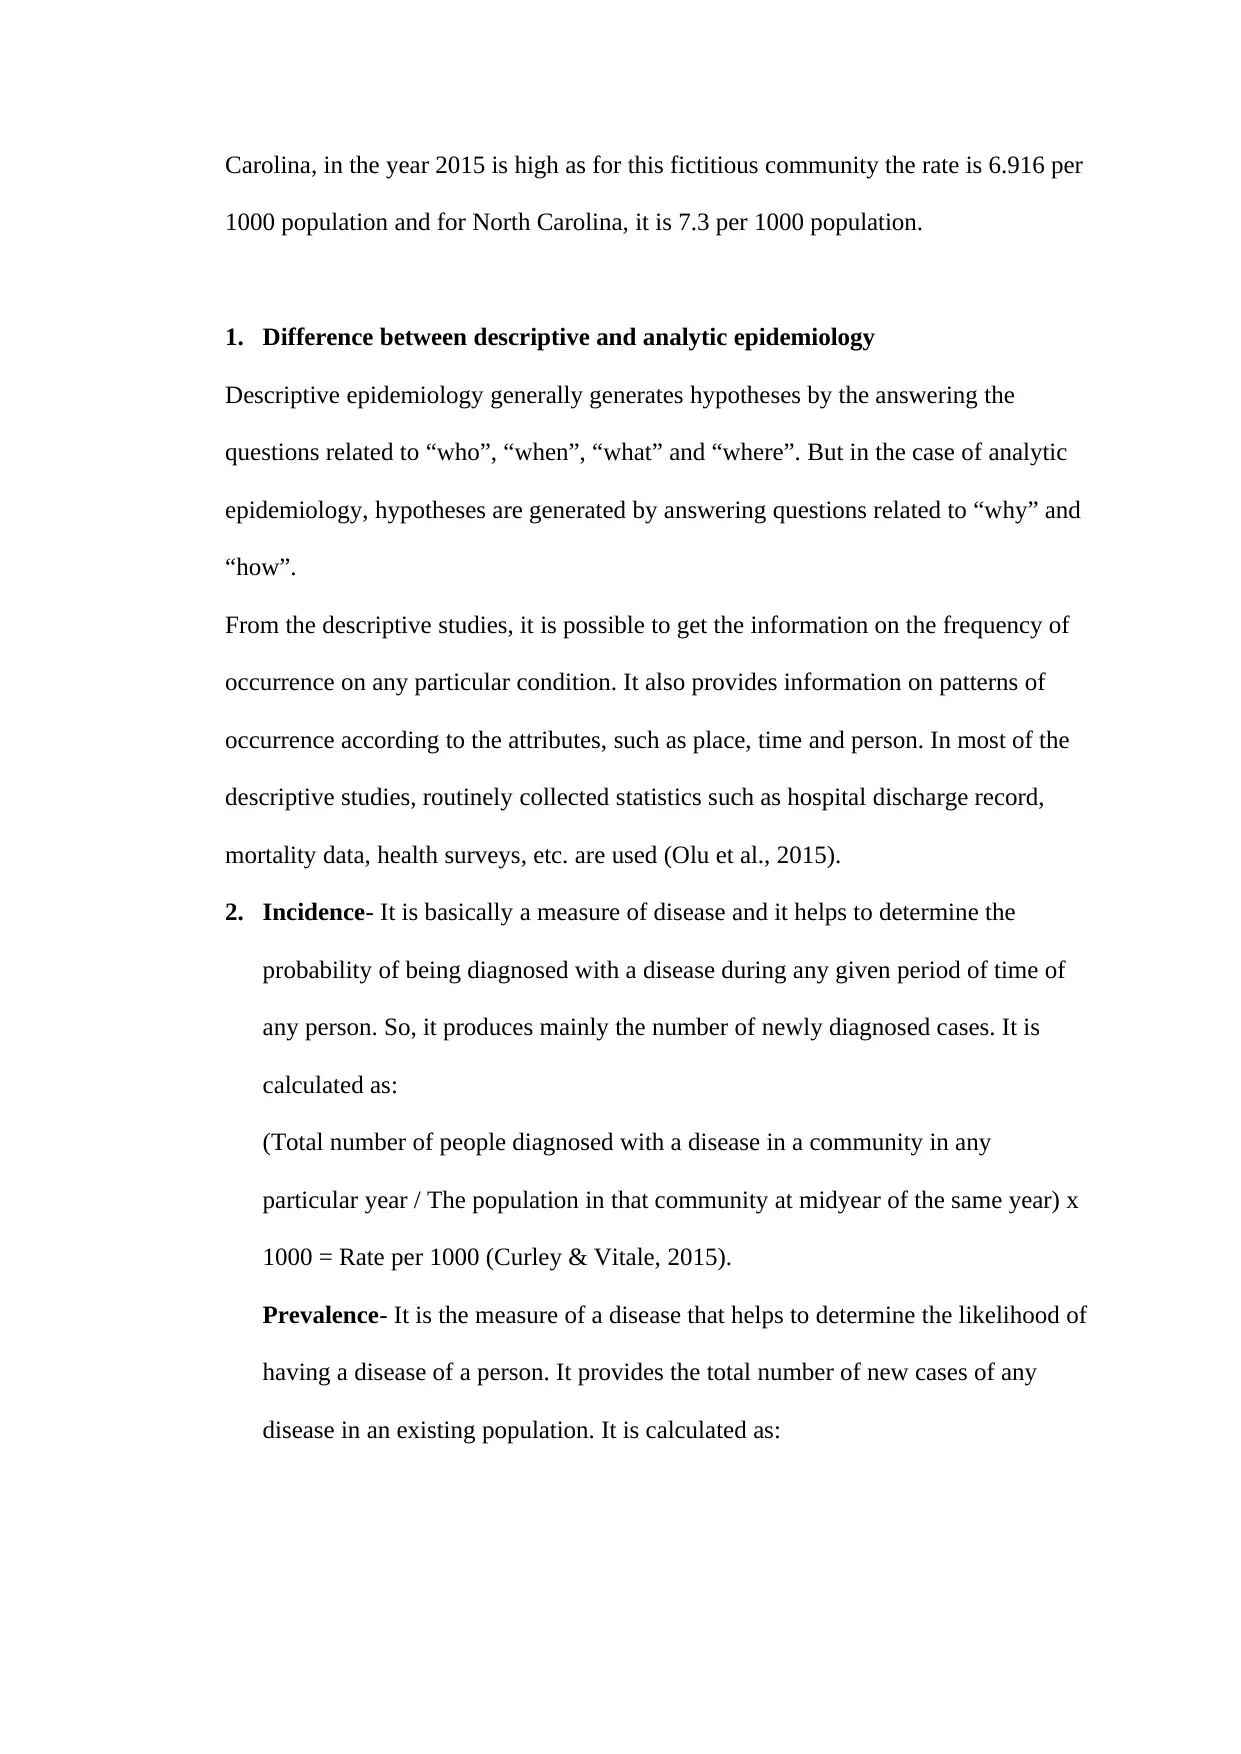
Carolina, in the year 2015 is high as for this fictitious community the rate is 6.916 per
1000 population and for North Carolina, it is 7.3 per 1000 population.
1. Difference between descriptive and analytic epidemiology
Descriptive epidemiology generally generates hypotheses by the answering the
questions related to “who”, “when”, “what” and “where”. But in the case of analytic
epidemiology, hypotheses are generated by answering questions related to “why” and
“how”.
From the descriptive studies, it is possible to get the information on the frequency of
occurrence on any particular condition. It also provides information on patterns of
occurrence according to the attributes, such as place, time and person. In most of the
descriptive studies, routinely collected statistics such as hospital discharge record,
mortality data, health surveys, etc. are used (Olu et al., 2015).
2. Incidence- It is basically a measure of disease and it helps to determine the
probability of being diagnosed with a disease during any given period of time of
any person. So, it produces mainly the number of newly diagnosed cases. It is
calculated as:
(Total number of people diagnosed with a disease in a community in any
particular year / The population in that community at midyear of the same year) x
1000 = Rate per 1000 (Curley & Vitale, 2015).
Prevalence- It is the measure of a disease that helps to determine the likelihood of
having a disease of a person. It provides the total number of new cases of any
disease in an existing population. It is calculated as:
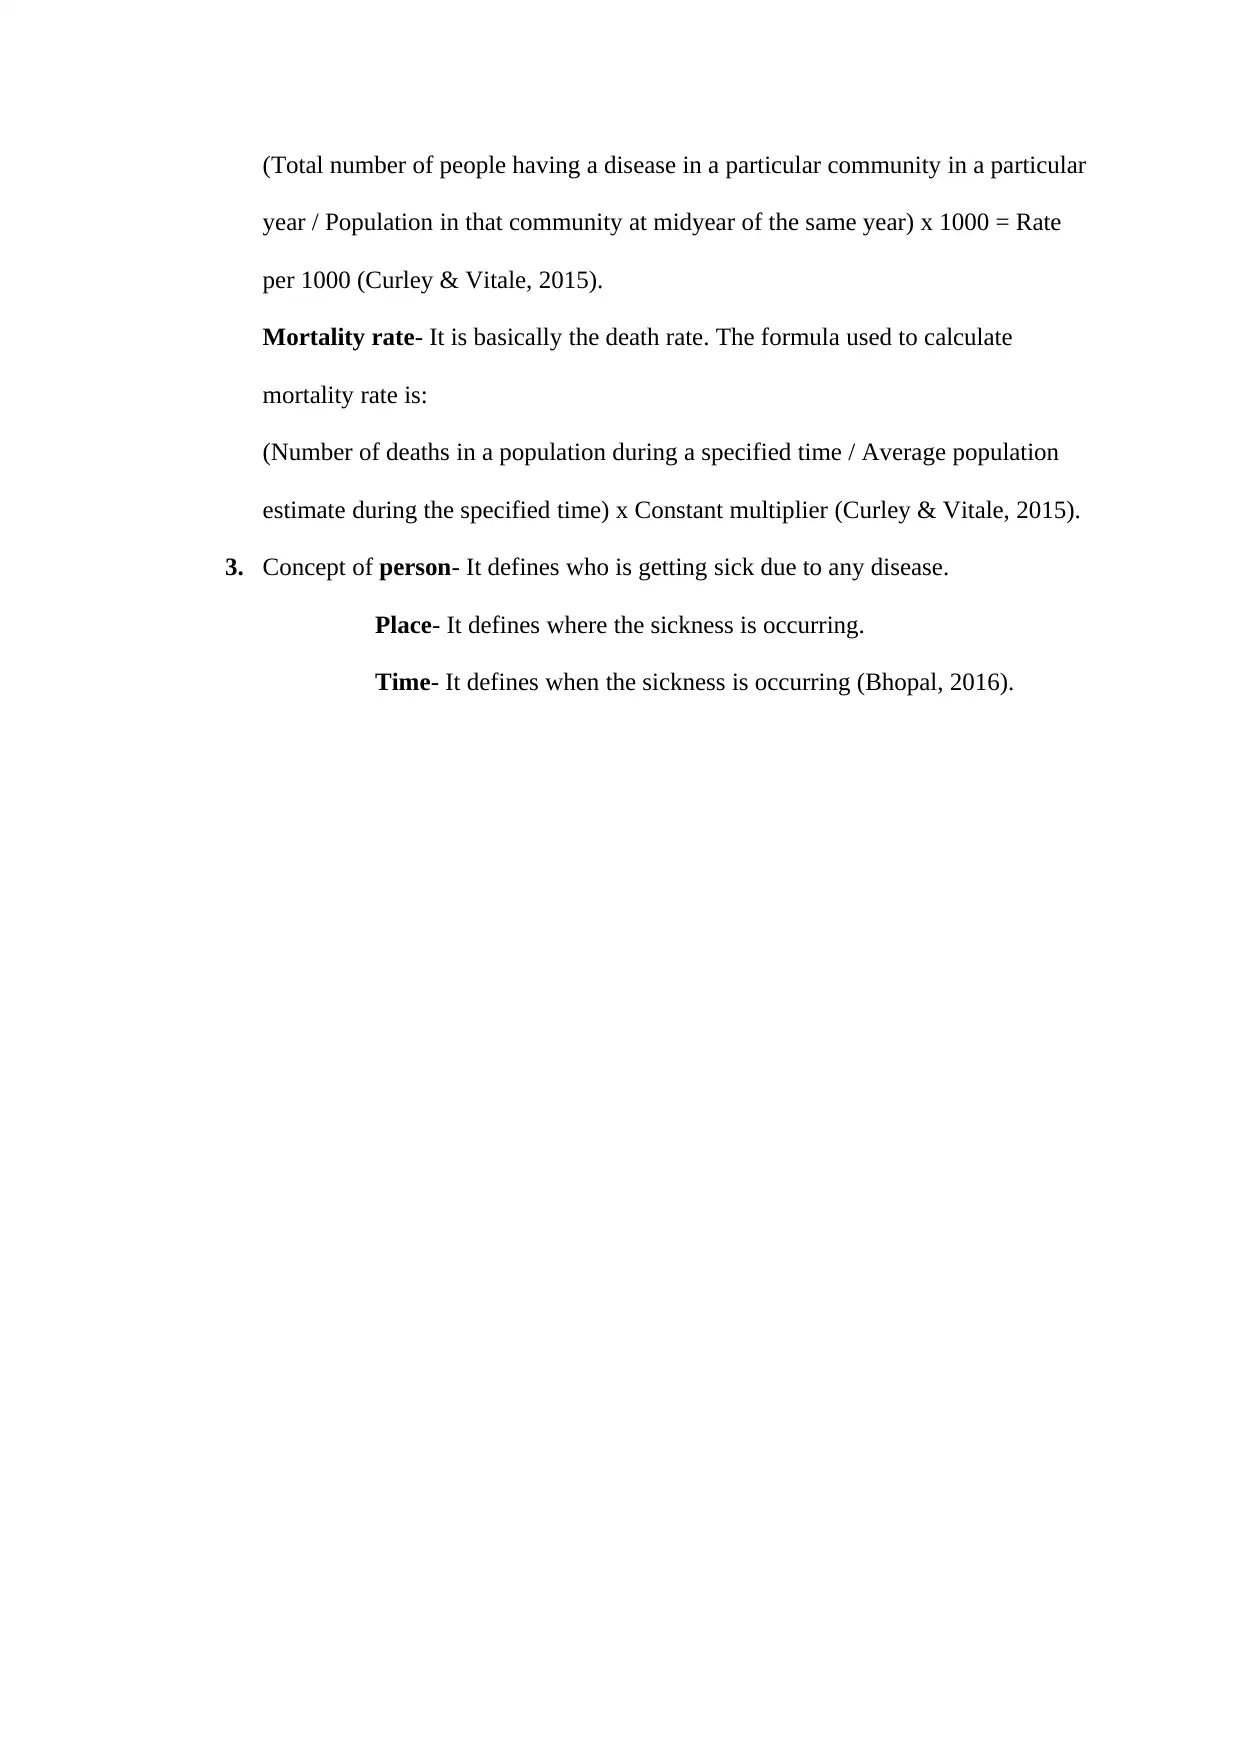
(Total number of people having a disease in a particular community in a particular
year / Population in that community at midyear of the same year) x 1000 = Rate
per 1000 (Curley & Vitale, 2015).
Mortality rate- It is basically the death rate. The formula used to calculate
mortality rate is:
(Number of deaths in a population during a specified time / Average population
estimate during the specified time) x Constant multiplier (Curley & Vitale, 2015).
3. Concept of person- It defines who is getting sick due to any disease.
Place- It defines where the sickness is occurring.
Time- It defines when the sickness is occurring (Bhopal, 2016).
Secure Best Marks with AI Grader
Need help grading? Try our AI Grader for instant feedback on your assignments.
References
Bhopal, R. S. (2016). Concepts of epidemiology: integrating the ideas, theories,
principles, and methods of epidemiology. Oxford University Press.
Curley, A. L., & Vitale, P. A. (2015). Population-based nursing: Concepts and
competencies for advanced practice. Springer Publishing Company.
Holland, M. A., Young, M. L., & Jiroutek, M. R. (2016). Racial and ethnic disparities
in infant mortality in North Carolina, 2008–2009. North Carolina medical
journal, 77(6), 373-377.
Koo, B. K., Lee, C. H., Yang, B. R., Hwang, S. S., & Choi, N. K. (2014). The
incidence and prevalence of diabetes mellitus and related atherosclerotic
complications in Korea: a National Health Insurance Database Study. PLoS
One, 9(10), e110650.
Olu, O., Kargbo, B., Kamara, S., Wurie, A. H., Amone, J., Ganda, L., ... & Worku, N.
(2015). Epidemiology of Ebola virus disease transmission among health care
workers in Sierra Leone, May to December 2014: a retrospective descriptive
study. BMC infectious diseases, 15(1), 416.
Todd, S. R., Dahlgren, F. S., Traeger, M. S., Beltrán-Aguilar, E. D., Marianos, D. W.,
Hamilton, C., ... & Regan, J. J. (2015). No visible dental staining in children
treated with doxycycline for suspected Rocky Mountain spotted fever. The
Journal of pediatrics, 166(5), 1246-1251.
Younossi, Z. M., Koenig, A. B., Abdelatif, D., Fazel, Y., Henry, L., & Wymer, M.
(2016). Global epidemiology of nonalcoholic fatty liver disease—meta‐
analytic assessment of prevalence, incidence, and
outcomes. Hepatology, 64(1), 73-84.

1 out of 6
Your All-in-One AI-Powered Toolkit for Academic Success.
+13062052269
info@desklib.com
Available 24*7 on WhatsApp / Email
![[object Object]](/_next/static/media/star-bottom.7253800d.svg)
Unlock your academic potential
© 2024 | Zucol Services PVT LTD | All rights reserved.