Epidemiology Assignment: Calculations of Rates and Diagnostic Tests
VerifiedAdded on 2020/04/15
|5
|625
|35
Homework Assignment
AI Summary
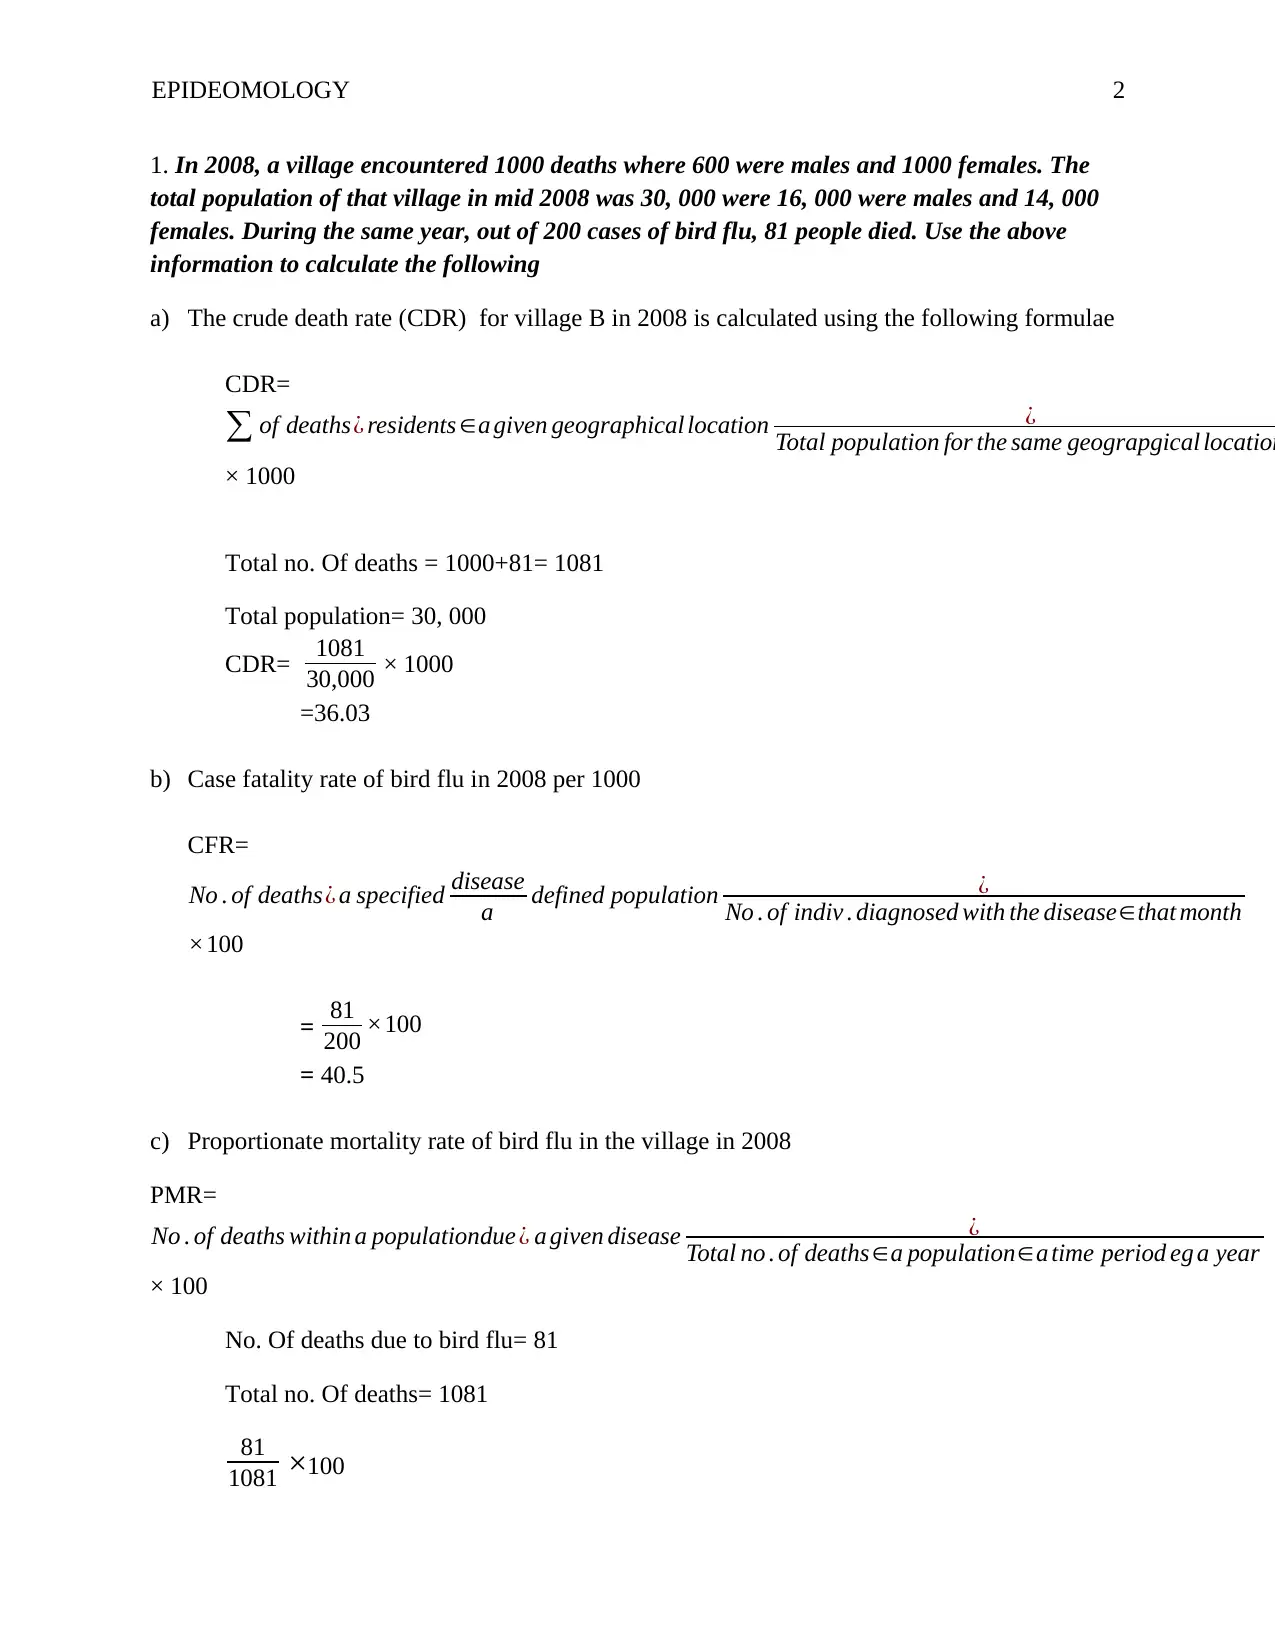
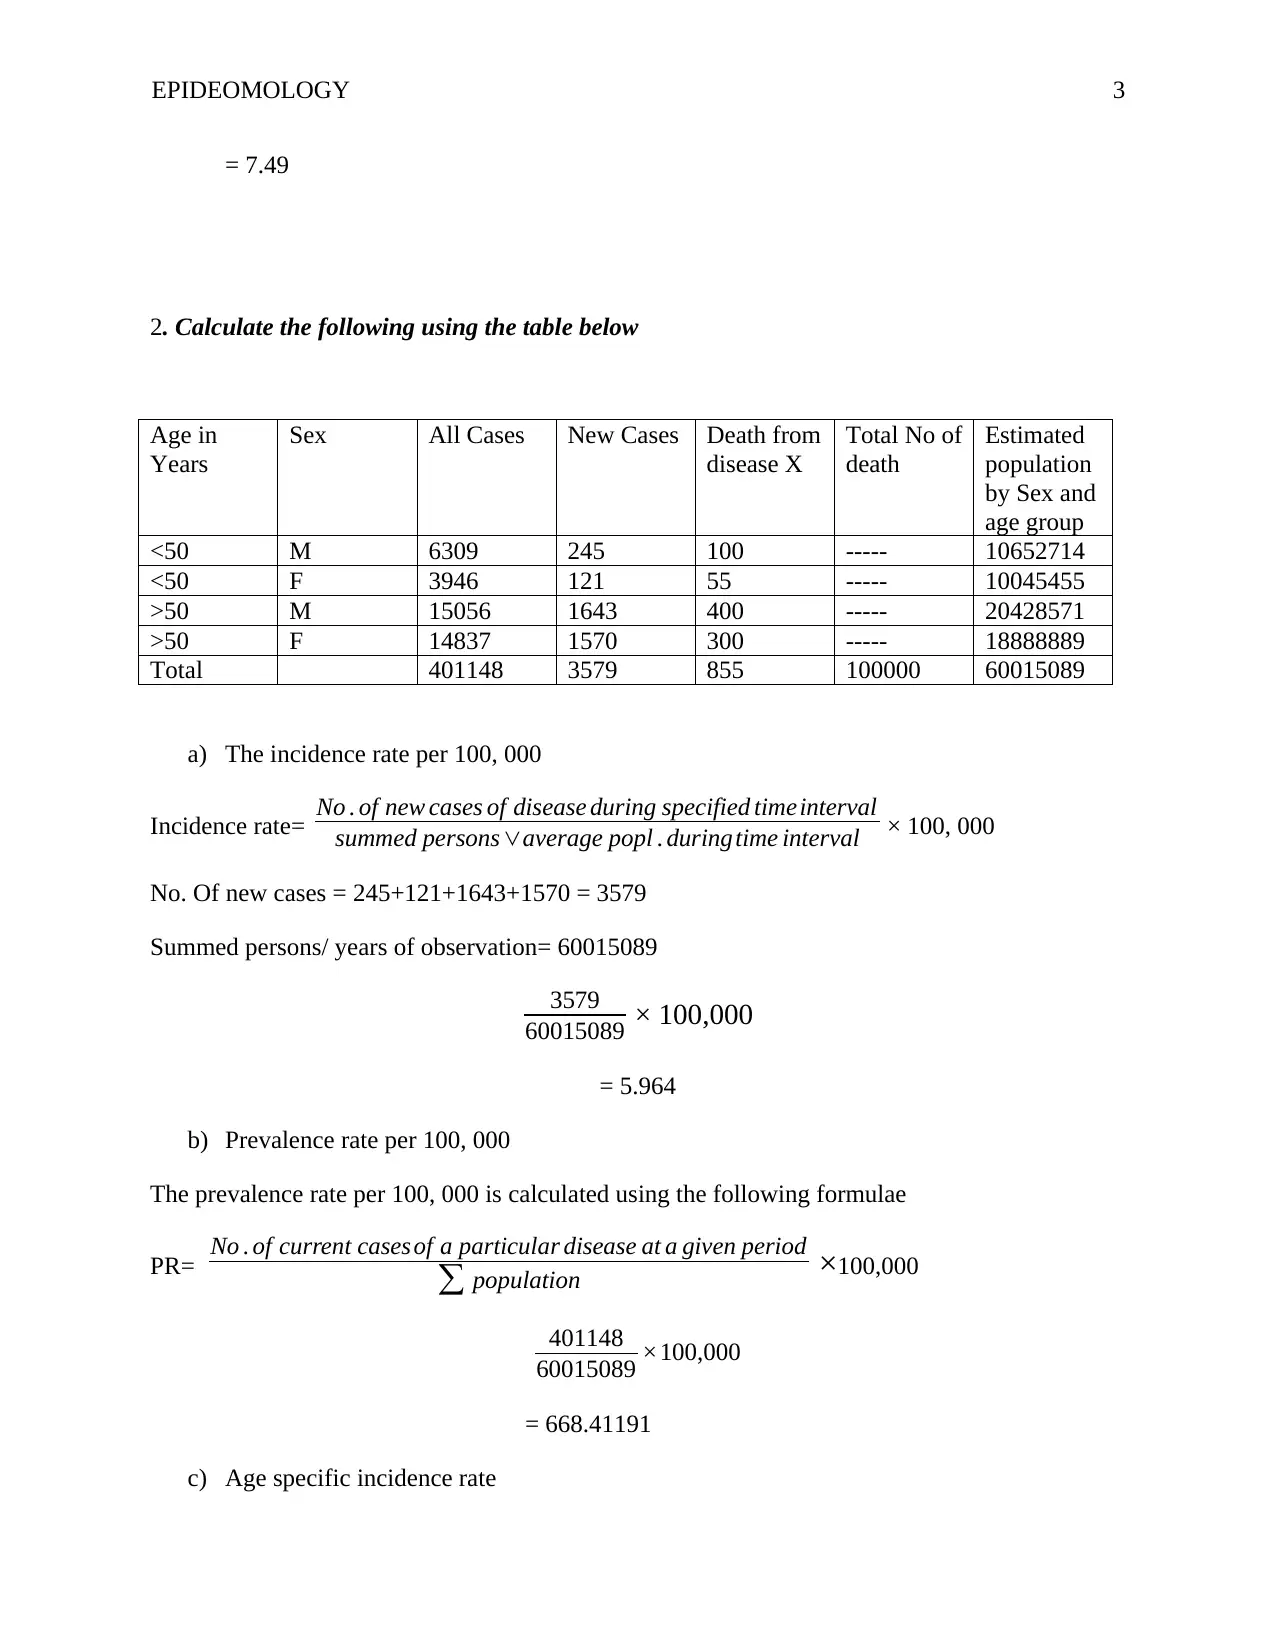
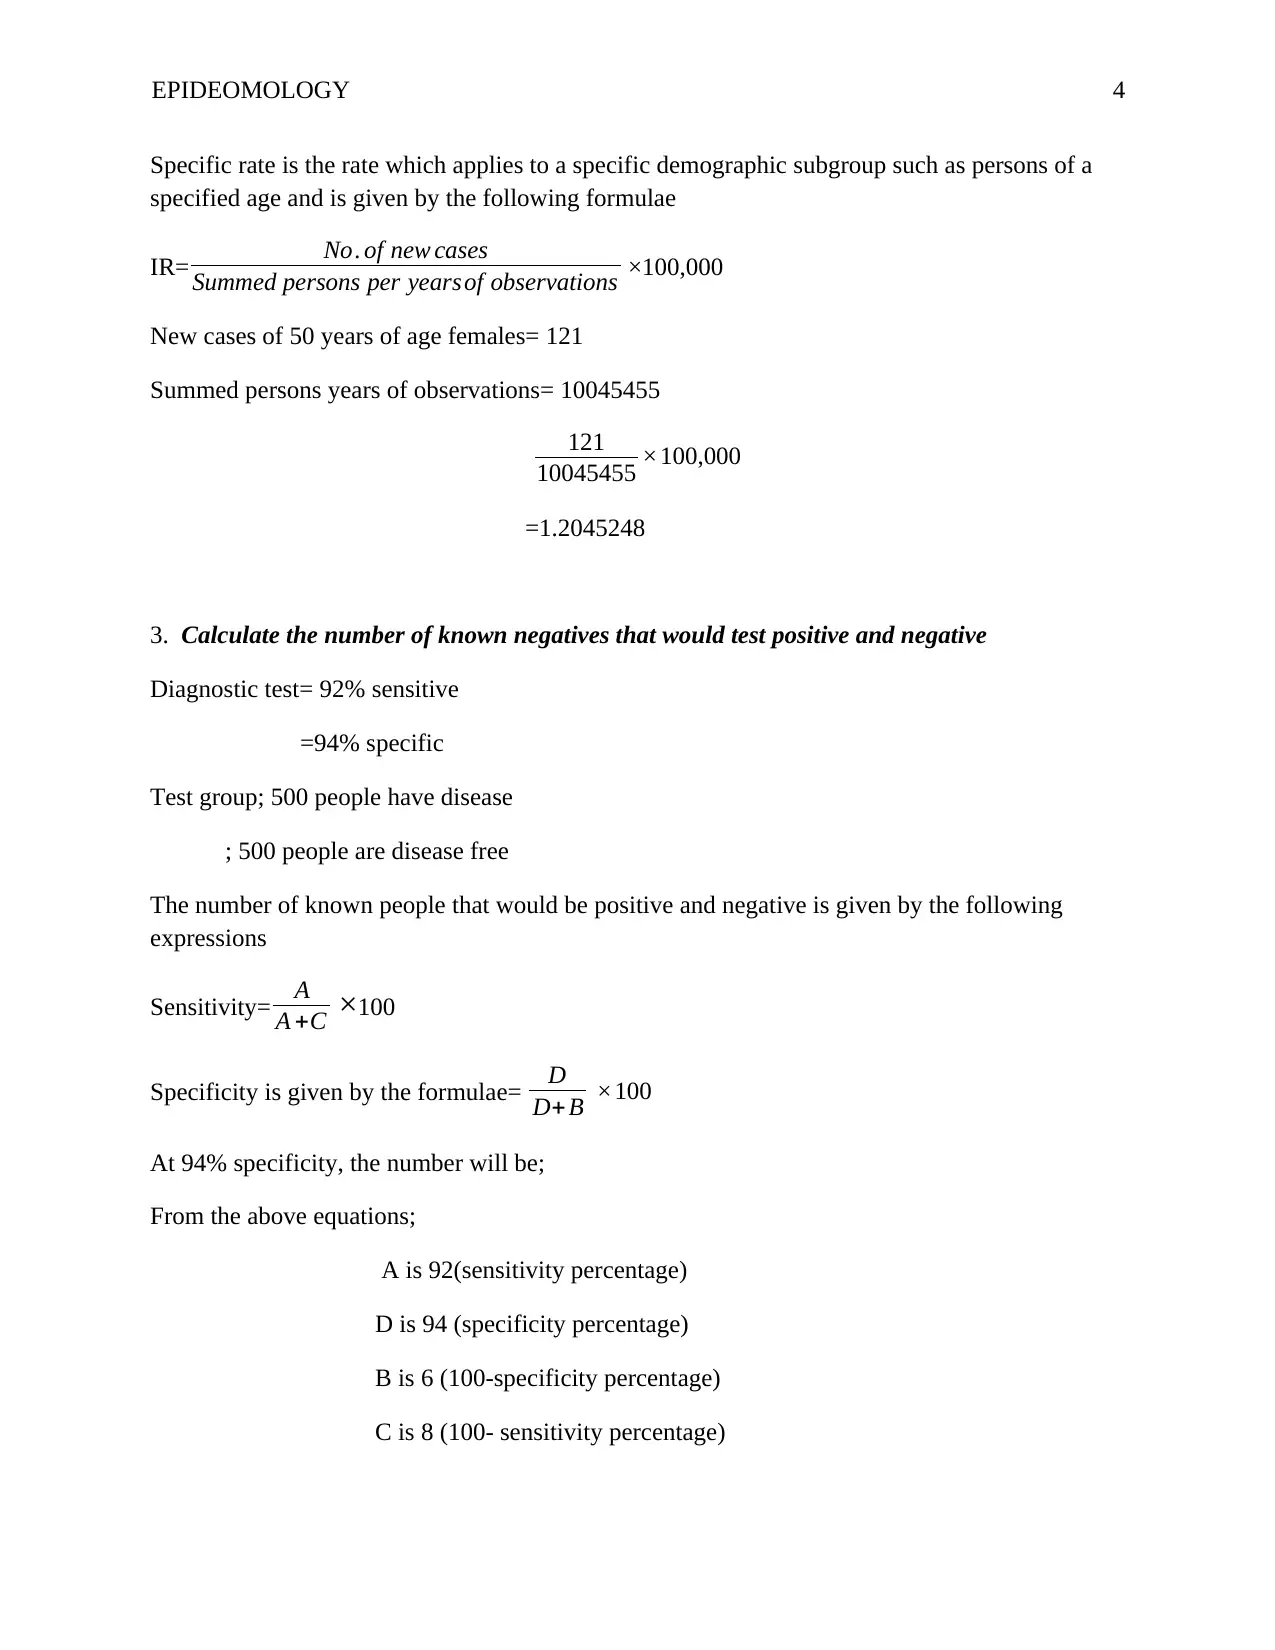
This assignment presents a series of epidemiology calculations based on provided data. It begins with calculating the crude death rate (CDR), case fatality rate (CFR), and proportionate mortality rate (PMR) using data on village deaths and bird flu cases. The assignment then progresses to calculating...

EPIDEOMOLOGY 1
Epidemiology
Student’s Name
University Affiliation
Epidemiology
Student’s Name
University Affiliation
Paraphrase This Document
Need a fresh take? Get an instant paraphrase of this document with our AI Paraphraser

EPIDEOMOLOGY 2
1. In 2008, a village encountered 1000 deaths where 600 were males and 1000 females. The
total population of that village in mid 2008 was 30, 000 were 16, 000 were males and 14, 000
females. During the same year, out of 200 cases of bird flu, 81 people died. Use the above
information to calculate the following
a) The crude death rate (CDR) for village B in 2008 is calculated using the following formulae
CDR=
∑ of deaths¿ residents ∈a given geographical location ¿
Total population for the same geograpgical location
× 1000
Total no. Of deaths = 1000+81= 1081
Total population= 30, 000
CDR= 1081
30,000 × 1000
=36.03
b) Case fatality rate of bird flu in 2008 per 1000
CFR=
No . of deaths¿ a specified disease
a defined population ¿
No . of indiv . diagnosed with the disease∈that month
×100
= 81
200 ×100
= 40.5
c) Proportionate mortality rate of bird flu in the village in 2008
PMR=
No . of deaths within a populationdue ¿ a given disease ¿
Total no . of deaths∈a population∈a time period eg a year
× 100
No. Of deaths due to bird flu= 81
Total no. Of deaths= 1081
81
1081 ×100

EPIDEOMOLOGY 3
= 7.49
2. Calculate the following using the table below
Age in
Years
Sex All Cases New Cases Death from
disease X
Total No of
death
Estimated
population
by Sex and
age group
<50 M 6309 245 100 ----- 10652714
<50 F 3946 121 55 ----- 10045455
>50 M 15056 1643 400 ----- 20428571
>50 F 14837 1570 300 ----- 18888889
Total 401148 3579 855 100000 60015089
a) The incidence rate per 100, 000
Incidence rate= No . of new cases of disease during specified timeinterval
summed persons∨average popl . duringtime interval × 100, 000
No. Of new cases = 245+121+1643+1570 = 3579
Summed persons/ years of observation= 60015089
3579
60015089 × 100,000
= 5.964
b) Prevalence rate per 100, 000
The prevalence rate per 100, 000 is calculated using the following formulae
PR= No . of current casesof a particular disease at a given period
∑ population ×100,000
401148
60015089 ×100,000
= 668.41191
c) Age specific incidence rate
⊘ This is a preview!⊘
Do you want full access?
Subscribe today to unlock all pages.

Trusted by 1+ million students worldwide

EPIDEOMOLOGY 4
Specific rate is the rate which applies to a specific demographic subgroup such as persons of a
specified age and is given by the following formulae
IR= No. of new cases
Summed persons per yearsof observations ×100,000
New cases of 50 years of age females= 121
Summed persons years of observations= 10045455
121
10045455 ×100,000
=1.2045248
3. Calculate the number of known negatives that would test positive and negative
Diagnostic test= 92% sensitive
=94% specific
Test group; 500 people have disease
; 500 people are disease free
The number of known people that would be positive and negative is given by the following
expressions
Sensitivity= A
A +C ×100
Specificity is given by the formulae= D
D+ B ×100
At 94% specificity, the number will be;
From the above equations;
A is 92(sensitivity percentage)
D is 94 (specificity percentage)
B is 6 (100-specificity percentage)
C is 8 (100- sensitivity percentage)
Paraphrase This Document
Need a fresh take? Get an instant paraphrase of this document with our AI Paraphraser

EPIDEOMOLOGY 5
94
100 ×500 = 470, which is the number of persons out of 500 with negative results
At 92% sensitivity, the number of persons will be
92
100 ×500=460 , which is the number of personsout of 500 with positivetest results
References
Bennell, K. L., & Brukner, P. D. (2007). Epidemiology and site specificity of stress fractures.
Clinics in sports medicine, 16(2), 179-196.
Fletcher, R. H., Fletcher, S. W., & Fletcher, G. S. (2012). Clinical epidemiology: the essentials.
Lippincott Williams & Wilkins.
Lin, S. J., Schranz, J., & Teutsch, S. M. (2011). Aspergillosis case-fatality rate: systematic
review of the literature. Clinical Infectious Diseases, 32(3), 358-366.
Pettersson, F., Fries, H., & Nillius, S. J. (2013). Epidemiology of secondary amenorrhea: I.
Incidence and prevalence rates. American journal of obstetrics and gynecology, 117(1),
80-86.
1 out of 5

Your All-in-One AI-Powered Toolkit for Academic Success.
+13062052269
info@desklib.com
Available 24*7 on WhatsApp / Email
Unlock your academic potential
© 2024 | Zucol Services PVT LTD | All rights reserved.