Demand and Supply Analysis: A Case Study of the Apple Industry
VerifiedAdded on 2023/06/12
|9
|1120
|188
Homework Assignment
AI Summary
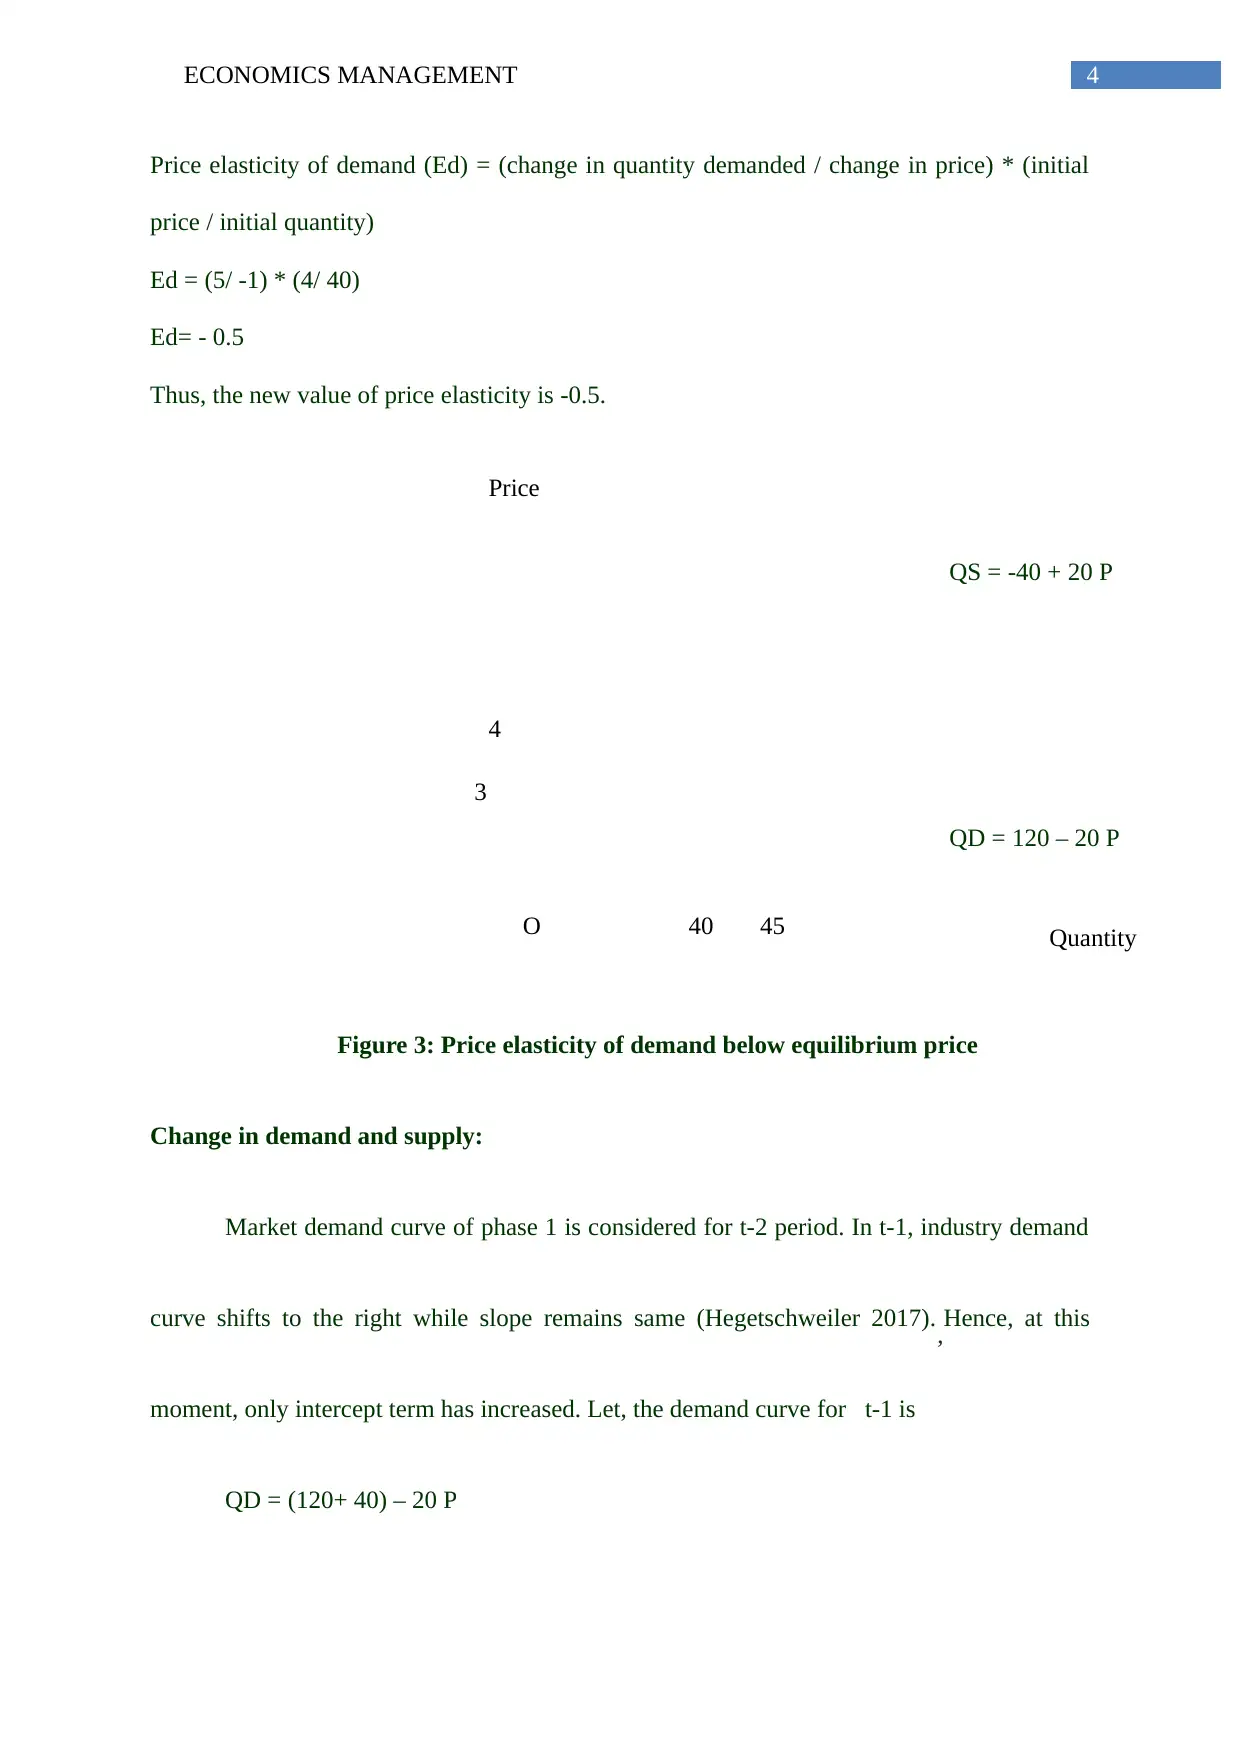
This assignment provides an economic analysis of the apple industry, focusing on demand and supply dynamics. It begins by defining demand and supply functions, deriving equilibrium price and quantity. The analysis explains factors influencing the demand function's shape and estimates demand elasticity above and below the equilibrium price. Furthermore, the assignment examines shifts in demand and supply curves over time (t-2, t-1, and t0), calculating new equilibrium points and illustrating these changes graphically. The study uses specified demand and supply functions to provide a clear understanding of market dynamics within the apple industry, offering valuable insights into economic management principles. Desklib provides this solved assignment and many other resources for students.

Running head: ECONOMICS MANAGEMENT
Economics management
Name of the student
Name of the university
Author Note
Economics management
Name of the student
Name of the university
Author Note
Paraphrase This Document
Need a fresh take? Get an instant paraphrase of this document with our AI Paraphraser

1ECONOMICS MANAGEMENT
Apple industry:
1.1 Given form of the demand curve is QD = a –bP
Hence, let the demand curve is: QD = 120 – 20 P
1.2 Given form of the supply curve is QS = c + dP
Hence, let the supply curve is: QS = -40 + 20 P
1.3 Equilibrium values: QD = QS
120 – 20 P = -40 + 20 P
20 P + 20 P = 120 + 40
40 P = 160
P = 160/ 40
P = 4
Hence, equilibrium price is $ 4
Substituting this value in demand function, equilibrium quantity of apple can be obtained:
Q= 120 – 20 * 4
Q= 120 – 80
Q= 40
Hence, the equilibrium quantity of apple in industry is 40.

2ECONOMICS MANAGEMENT
Price
Quantity
QS = -40 + 20
P
QD = 120 – 20
P
40O
4
1.3
Figure 1: Equilibrium price and quantity of apple industry
1.4: According to law of demand, price for a particular quantity has a negative relationship
with its quantity demanded (Zoutman, Gavrilova and Hopland 2018). This situation has
occurred within this apple industry as well. The demand function is QD = 120 – 20 P, which
represents a straight-line demand equation. Hence, the slope of this curve is – 20, which
means, the curve has possessed a negative slope of 20 indicating a downward slopping
demand curve and this is called marginal price. On the other side, 120 is the intercept of this
demand equation. This represents that when price is zero, people can demand 120 unit of
apple and as price goes up, the demand for apple decreased and vice versa. Hence, factors
that influence shape of the demand curve are slope and intercept of the demand equation.
1.5: The initial equilibrium price of apple is $ 4 and equilibrium quantity is 40. Suppose the
demand for this specified product changes for one price interval above the equilibrium
You're viewing a preview
Unlock full access by subscribing today!

3ECONOMICS MANAGEMENT
Price
Quantity
QS = -40 + 20 P
QD = 120 – 20 P
40O
4
5
35
equation indicating higher price and lower quantity demanded for apple in the industry.
Hence, the price of apple is $ 5 and corresponding amount of apple is 35. Hence, price has
change by $ ( 5- 4) = $ 1 while quantity demanded has decreased by ( 35 – 40 ) = - 5.
According to price elasticity of demand (Ed) = (change in quantity demanded / change in
price) * (initial price / initial quantity) (Coglianese et al. 2017)
Ed = (- 5/ 1) * (4/ 40)
Ed= - 0.5
Figure 2: Price elasticity of demand above equilibrium price
1.6: Suppose new price of apple is $ 3 and corresponding quantity demanded for
apple is 45 to estimate demand elasticity one price interval below the equilibrium price.
Hence, price changes by $ (3 – 4) = $ -1 while quantity demanded increases by (45 –
40) = 5 unit. Hence, in this situation, price elasticity of demand is
Paraphrase This Document
Need a fresh take? Get an instant paraphrase of this document with our AI Paraphraser

4ECONOMICS MANAGEMENT
Price
Quantity
QS = -40 + 20 P
QD = 120 – 20 P
40O
4
3
45
Price elasticity of demand (Ed) = (change in quantity demanded / change in price) * (initial
price / initial quantity)
Ed = (5/ -1) * (4/ 40)
Ed= - 0.5
Thus, the new value of price elasticity is -0.5.
Figure 3: Price elasticity of demand below equilibrium price
Change in demand and supply:
Market demand curve of phase 1 is considered for t-2 period. In t-1, industry demand
curve shifts to the right while slope remains same (Hegetschweiler 2017).,Hence, at this
moment, only intercept term has increased. Let, the demand curve for t-1 is
QD = (120+ 40) – 20 P

5ECONOMICS MANAGEMENT
QD = 160 – 20 P
Thus, equilibrium price at this situation is:
160 – 20 P = - 40 + 20 P
40 P = 200
P = 5
Thus, equilibrium amount of apple in this t-1 is:
Q = 160 – 20 * 5
Q = 160 – 100
Q = 60
Hence, new equilibrium amount of apple is 60,
QD = 160 – 20 P
Thus, equilibrium price at this situation is:
160 – 20 P = - 40 + 20 P
40 P = 200
P = 5
Thus, equilibrium amount of apple in this t-1 is:
Q = 160 – 20 * 5
Q = 160 – 100
Q = 60
Hence, new equilibrium amount of apple is 60,
You're viewing a preview
Unlock full access by subscribing today!

6ECONOMICS MANAGEMENT
Price
Quantity40O
4
120
S
16060
5
Figure 4: New demand curve for time t-1
Now, in t0 period, supply curve of apple shifts to the right remaining slope at its initial level.
Hence, this new supply curve is
QS = 0 + 20 P
Thus, new equilibrium price and equilibrium amount of apple is
160 – 20 P = 0 + 20 P
40 P = 160
P = 4
Putting this value is new supply equation output can be obtained.
Q= 0 + 20 * 4
Paraphrase This Document
Need a fresh take? Get an instant paraphrase of this document with our AI Paraphraser

7ECONOMICS MANAGEMENT
Price
Quantity40O
4
120
S0
16060
5
S1
-40 80
Q = 80
Thus, new equilibrium price is $ 4 and quantity is 80
Figure 5: New supply curve for time t0
References:
Coglianese, J., Davis, L.W., Kilian, L. and Stock, J.H., 2017. Anticipation, tax avoidance,
and the price elasticity of gasoline demand. Journal of Applied Econometrics, 32(1), pp.1-15.

8ECONOMICS MANAGEMENT
Hegetschweiler, K.T., de Vries, S., Arnberger, A., Bell, S., Brennan, M., Siter, N., Olafsson,
A.S., Voigt, A. and Hunziker, M., 2017. Linking demand and supply factors in identifying
cultural ecosystem services of urban green infrastructures: A review of European
studies. Urban Forestry & Urban Greening, 21, pp.48-59.
Zoutman, F.T., Gavrilova, E. and Hopland, A.O., 2018. Estimating Both Supply and Demand
Elasticities Using Variation in a Single Tax Rate. Econometrica, 86(2), pp.763-771.
You're viewing a preview
Unlock full access by subscribing today!
1 out of 9
Related Documents

Your All-in-One AI-Powered Toolkit for Academic Success.
+13062052269
info@desklib.com
Available 24*7 on WhatsApp / Email
Unlock your academic potential
© 2024 | Zucol Services PVT LTD | All rights reserved.