Melbourne IT Group Financial Analysis
VerifiedAdded on 2020/03/01
|11
|2826
|52
AI Summary
This assignment analyzes the financial performance of Melbourne IT Group, focusing specifically on its EBITDA (Earnings Before Interest, Taxes, Depreciation, and Amortization) margin. It compares the EBITDA margins of different divisions within the company – Enterprise and SMB – across 2015 and 2016. The analysis reveals that the SMB division consistently demonstrates a higher EBITDA margin than the Enterprise division. Furthermore, it suggests that focusing on the growing SMB division could lead to improved overall earning quality for Melbourne IT Group. Considering the positive economic conditions in the Australian IT and ICT sectors, the assignment concludes with recommendations for future growth strategies.
Contribute Materials
Your contribution can guide someone’s learning journey. Share your
documents today.

Finance Assignment
Secure Best Marks with AI Grader
Need help grading? Try our AI Grader for instant feedback on your assignments.
PART A
I. Estimation of the value of the share of Melbourne IT using the FEFE or free cash flow to
Equity method.
FCFE or free cash flow to equity can be defined as the cash flow which the entity retains after
making the suitable adjustments for payment of fiancé costs, debts issue and repayment od debts
for the given financial year. FCFE, once it is determined can be used by using the discounting
methods to determine the value of an entity’s equity and consequently the value of shares issued
in the open market by the entity (Watson, 2012).
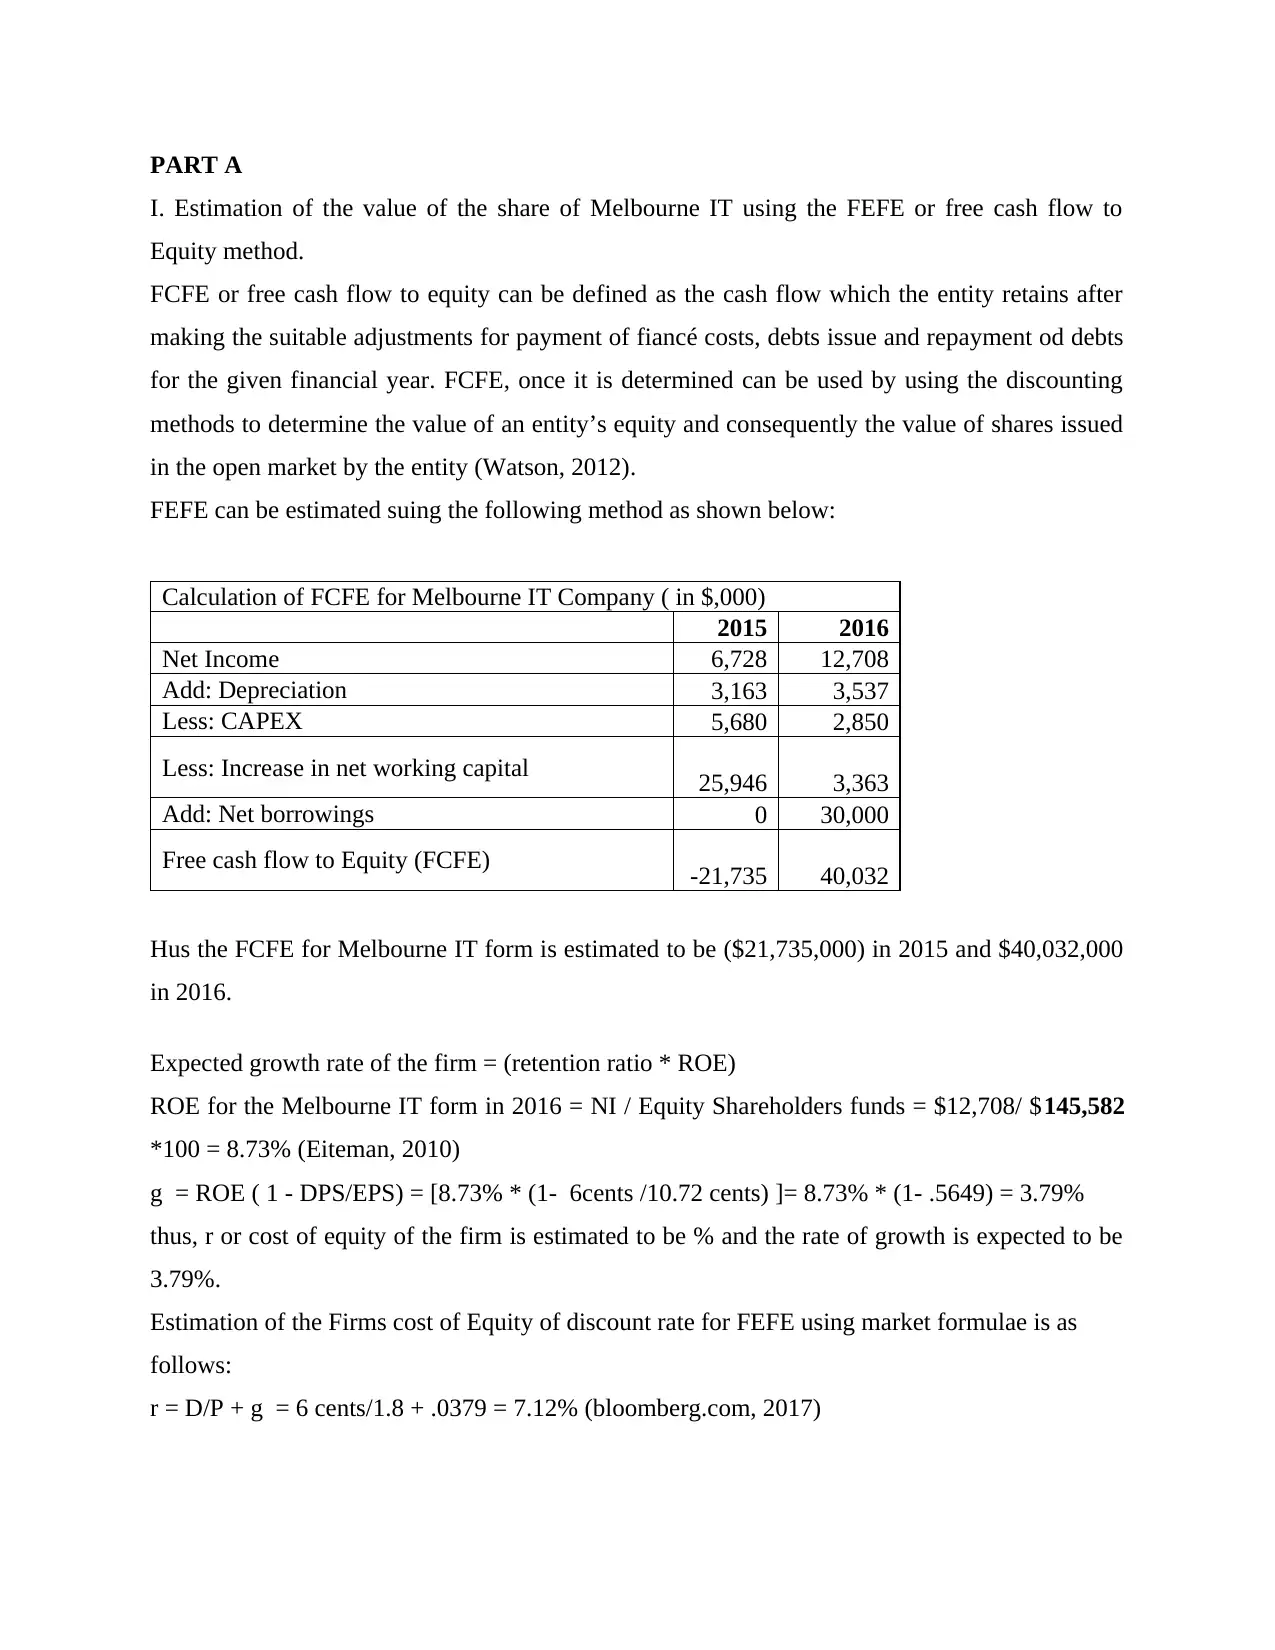
FEFE can be estimated suing the following method as shown below:
Calculation of FCFE for Melbourne IT Company ( in $,000)
2015 2016
Net Income 6,728 12,708
Add: Depreciation 3,163 3,537
Less: CAPEX 5,680 2,850
Less: Increase in net working capital 25,946 3,363
Add: Net borrowings 0 30,000
Free cash flow to Equity (FCFE) -21,735 40,032
Hus the FCFE for Melbourne IT form is estimated to be ($21,735,000) in 2015 and $40,032,000
in 2016.
Expected growth rate of the firm = (retention ratio * ROE)
ROE for the Melbourne IT form in 2016 = NI / Equity Shareholders funds = $12,708/ $145,582
*100 = 8.73% (Eiteman, 2010)
g = ROE ( 1 - DPS/EPS) = [8.73% * (1- 6cents /10.72 cents) ]= 8.73% * (1- .5649) = 3.79%
thus, r or cost of equity of the firm is estimated to be % and the rate of growth is expected to be
3.79%.
Estimation of the Firms cost of Equity of discount rate for FEFE using market formulae is as
follows:
r = D/P + g = 6 cents/1.8 + .0379 = 7.12% (bloomberg.com, 2017)
I. Estimation of the value of the share of Melbourne IT using the FEFE or free cash flow to
Equity method.
FCFE or free cash flow to equity can be defined as the cash flow which the entity retains after
making the suitable adjustments for payment of fiancé costs, debts issue and repayment od debts
for the given financial year. FCFE, once it is determined can be used by using the discounting
methods to determine the value of an entity’s equity and consequently the value of shares issued
in the open market by the entity (Watson, 2012).
FEFE can be estimated suing the following method as shown below:
Calculation of FCFE for Melbourne IT Company ( in $,000)
2015 2016
Net Income 6,728 12,708
Add: Depreciation 3,163 3,537
Less: CAPEX 5,680 2,850
Less: Increase in net working capital 25,946 3,363
Add: Net borrowings 0 30,000
Free cash flow to Equity (FCFE) -21,735 40,032
Hus the FCFE for Melbourne IT form is estimated to be ($21,735,000) in 2015 and $40,032,000
in 2016.
Expected growth rate of the firm = (retention ratio * ROE)
ROE for the Melbourne IT form in 2016 = NI / Equity Shareholders funds = $12,708/ $145,582
*100 = 8.73% (Eiteman, 2010)
g = ROE ( 1 - DPS/EPS) = [8.73% * (1- 6cents /10.72 cents) ]= 8.73% * (1- .5649) = 3.79%
thus, r or cost of equity of the firm is estimated to be % and the rate of growth is expected to be
3.79%.
Estimation of the Firms cost of Equity of discount rate for FEFE using market formulae is as
follows:
r = D/P + g = 6 cents/1.8 + .0379 = 7.12% (bloomberg.com, 2017)
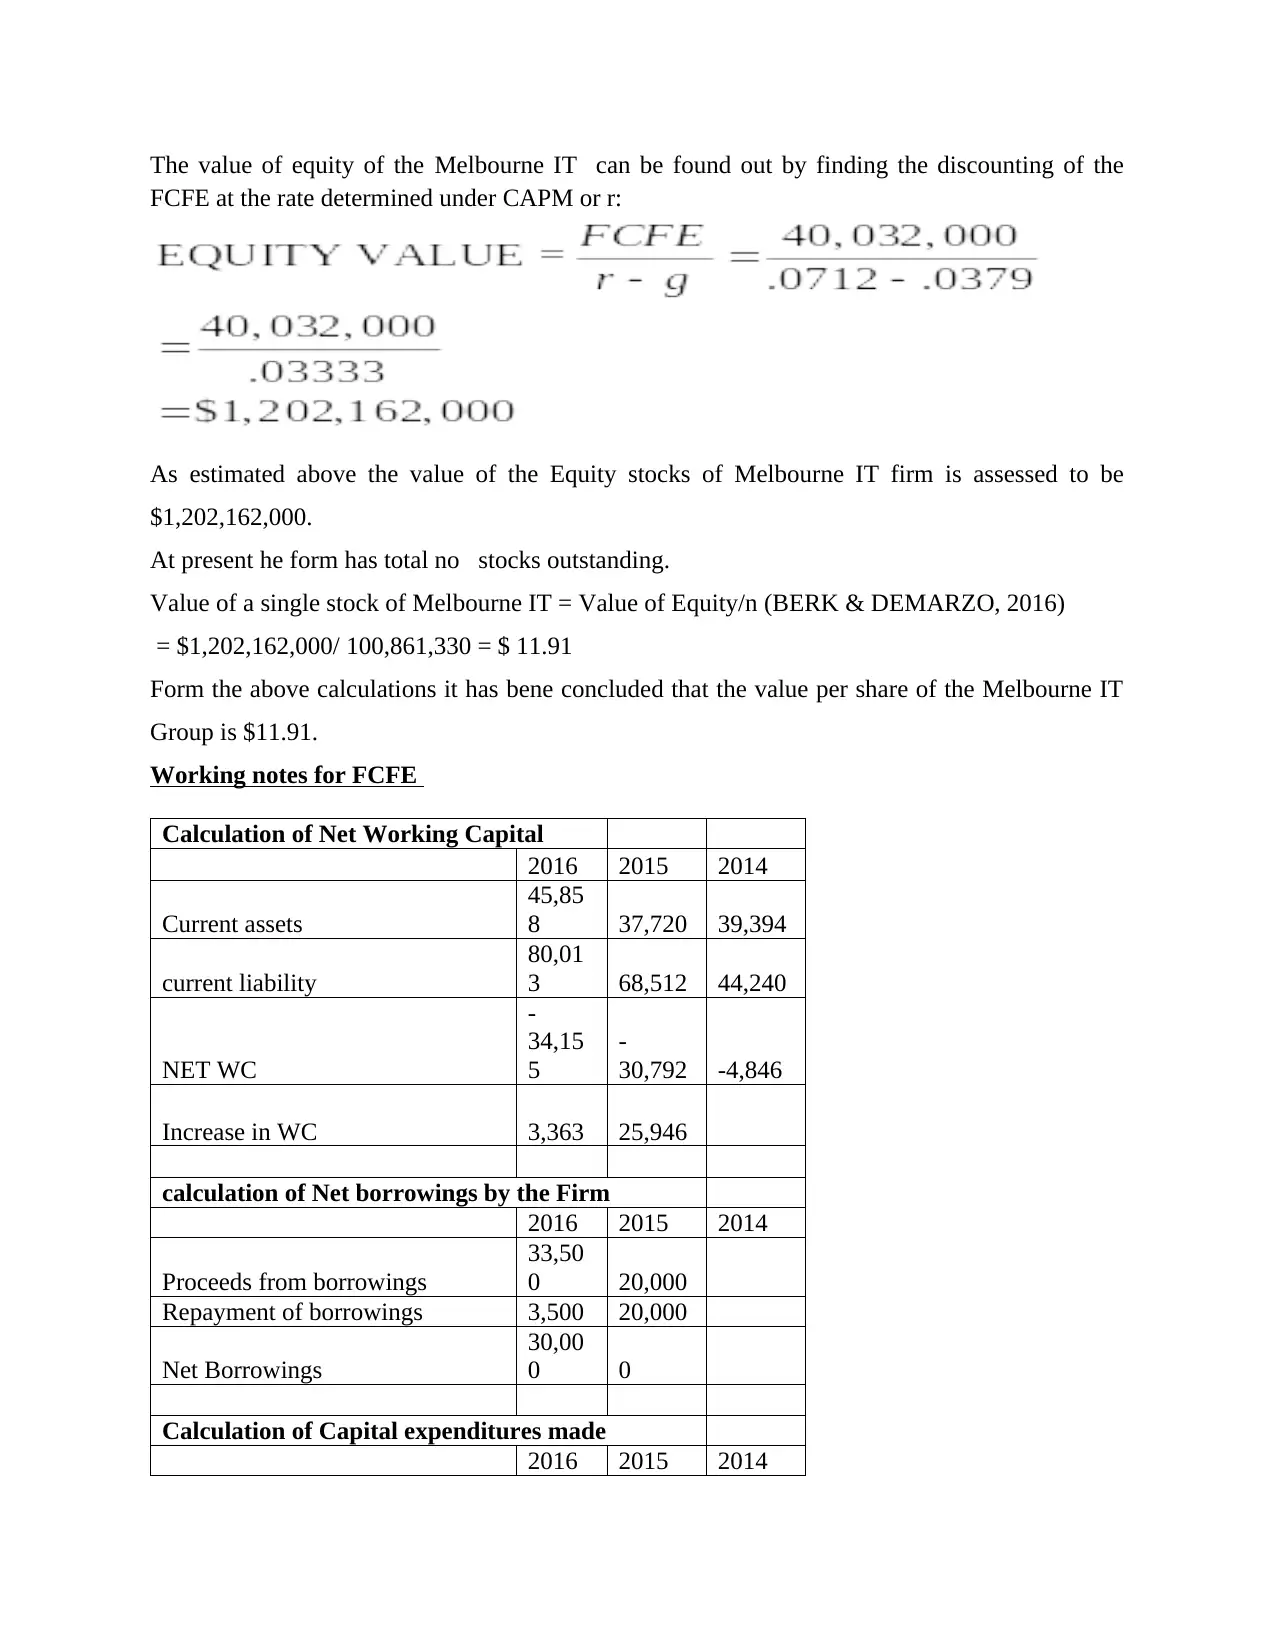
The value of equity of the Melbourne IT can be found out by finding the discounting of the
FCFE at the rate determined under CAPM or r:
As estimated above the value of the Equity stocks of Melbourne IT firm is assessed to be
$1,202,162,000.
At present he form has total no stocks outstanding.
Value of a single stock of Melbourne IT = Value of Equity/n (BERK & DEMARZO, 2016)
= $1,202,162,000/ 100,861,330 = $ 11.91
Form the above calculations it has bene concluded that the value per share of the Melbourne IT
Group is $11.91.
Working notes for FCFE
Calculation of Net Working Capital
2016 2015 2014
Current assets
45,85
8 37,720 39,394
current liability
80,01
3 68,512 44,240
NET WC
-
34,15
5
-
30,792 -4,846
Increase in WC 3,363 25,946
calculation of Net borrowings by the Firm
2016 2015 2014
Proceeds from borrowings
33,50
0 20,000
Repayment of borrowings 3,500 20,000
Net Borrowings
30,00
0 0
Calculation of Capital expenditures made
2016 2015 2014
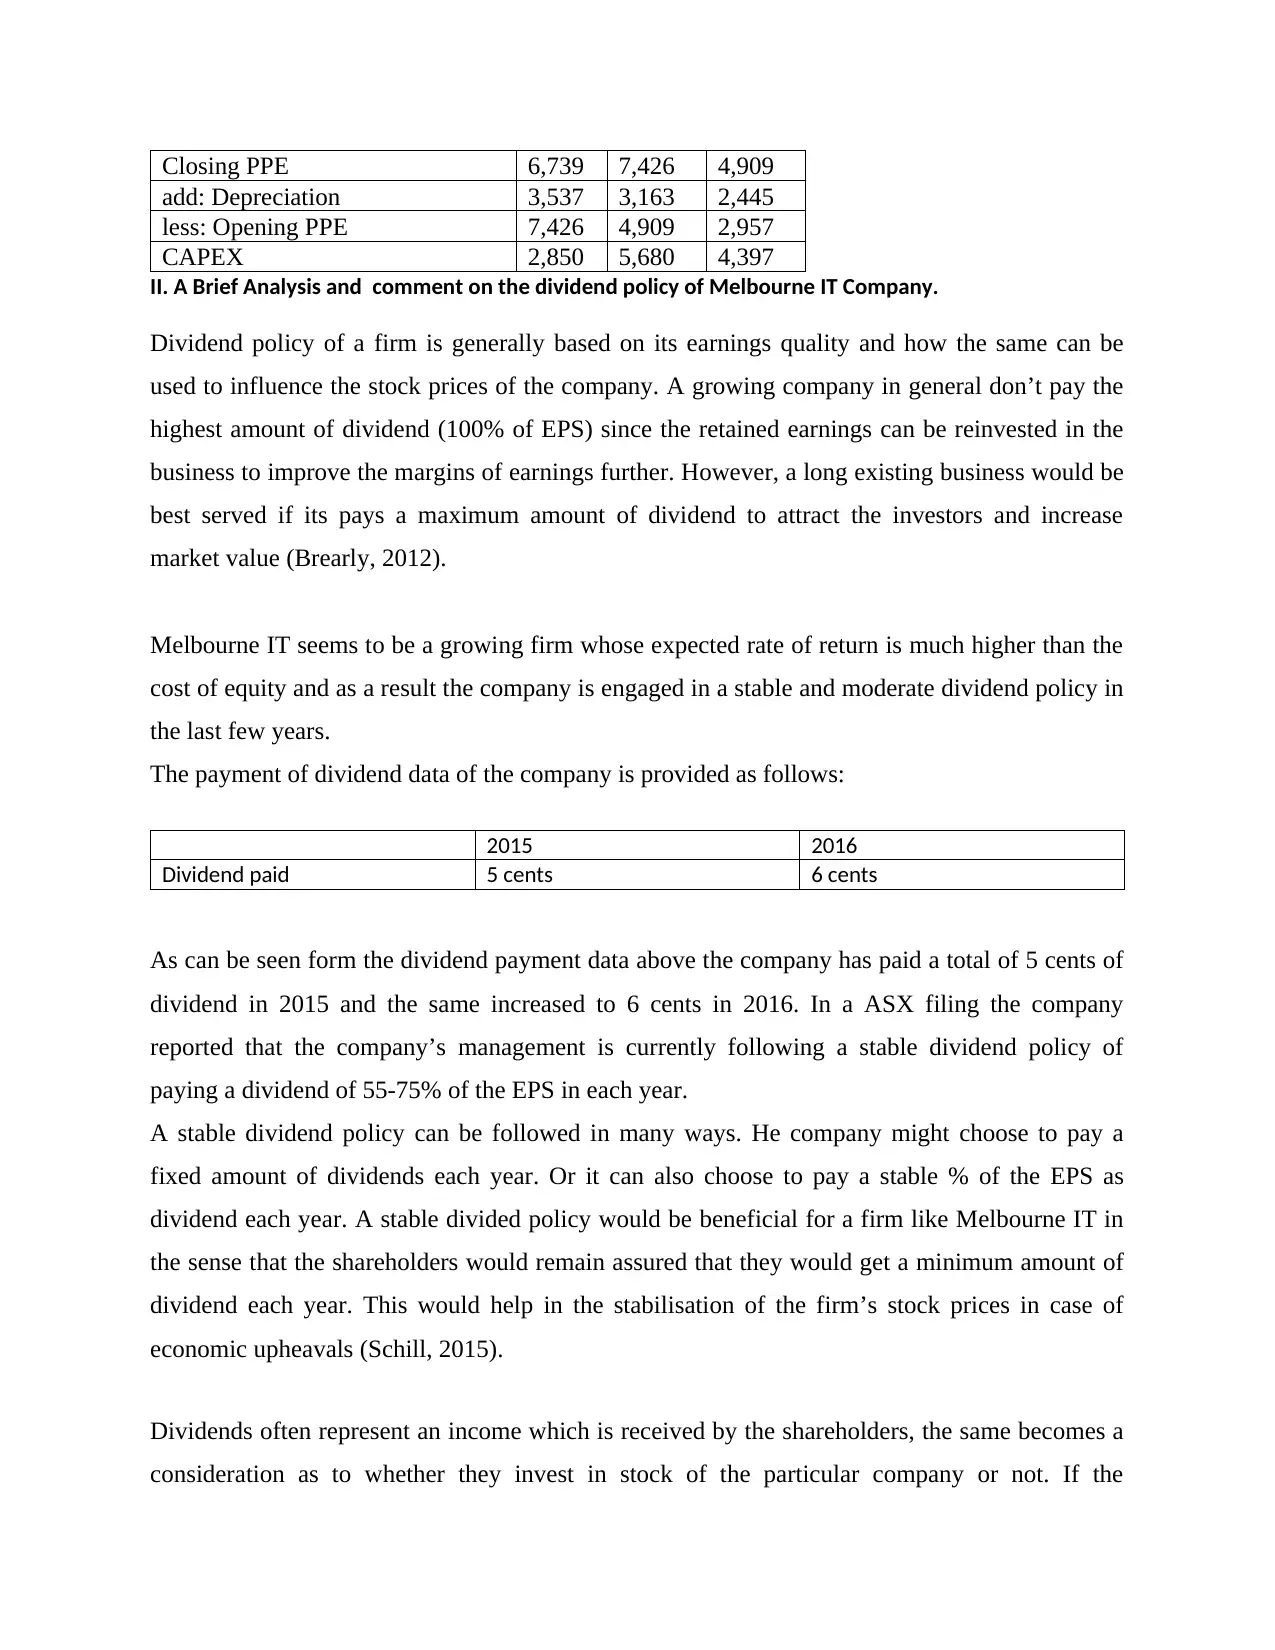
Closing PPE 6,739 7,426 4,909
add: Depreciation 3,537 3,163 2,445
less: Opening PPE 7,426 4,909 2,957
CAPEX 2,850 5,680 4,397
II. A Brief Analysis and comment on the dividend policy of Melbourne IT Company.
Dividend policy of a firm is generally based on its earnings quality and how the same can be
used to influence the stock prices of the company. A growing company in general don’t pay the
highest amount of dividend (100% of EPS) since the retained earnings can be reinvested in the
business to improve the margins of earnings further. However, a long existing business would be
best served if its pays a maximum amount of dividend to attract the investors and increase
market value (Brearly, 2012).
Melbourne IT seems to be a growing firm whose expected rate of return is much higher than the
cost of equity and as a result the company is engaged in a stable and moderate dividend policy in
the last few years.
The payment of dividend data of the company is provided as follows:
2015 2016
Dividend paid 5 cents 6 cents
As can be seen form the dividend payment data above the company has paid a total of 5 cents of
dividend in 2015 and the same increased to 6 cents in 2016. In a ASX filing the company
reported that the company’s management is currently following a stable dividend policy of
paying a dividend of 55-75% of the EPS in each year.
A stable dividend policy can be followed in many ways. He company might choose to pay a
fixed amount of dividends each year. Or it can also choose to pay a stable % of the EPS as
dividend each year. A stable divided policy would be beneficial for a firm like Melbourne IT in
the sense that the shareholders would remain assured that they would get a minimum amount of
dividend each year. This would help in the stabilisation of the firm’s stock prices in case of
economic upheavals (Schill, 2015).
Dividends often represent an income which is received by the shareholders, the same becomes a
consideration as to whether they invest in stock of the particular company or not. If the
Secure Best Marks with AI Grader
Need help grading? Try our AI Grader for instant feedback on your assignments.
shareholders of the company know with a degree of certainty that the company would pay a
stable dividend they become assured of their returns. Also they know that they get a particular
amount of dividend whether the Company earns less or more, ensuring that the dividend policy is
aligned with the long term objectives of the management and is seen as being cut off from the
quarterly volatility of earnings. This ensures the timing and the amount of dividend is known in
advance and creates an atmosphere of assurance for the shareholders of a company like
Melbourne IT (Vernimmen, 2011).
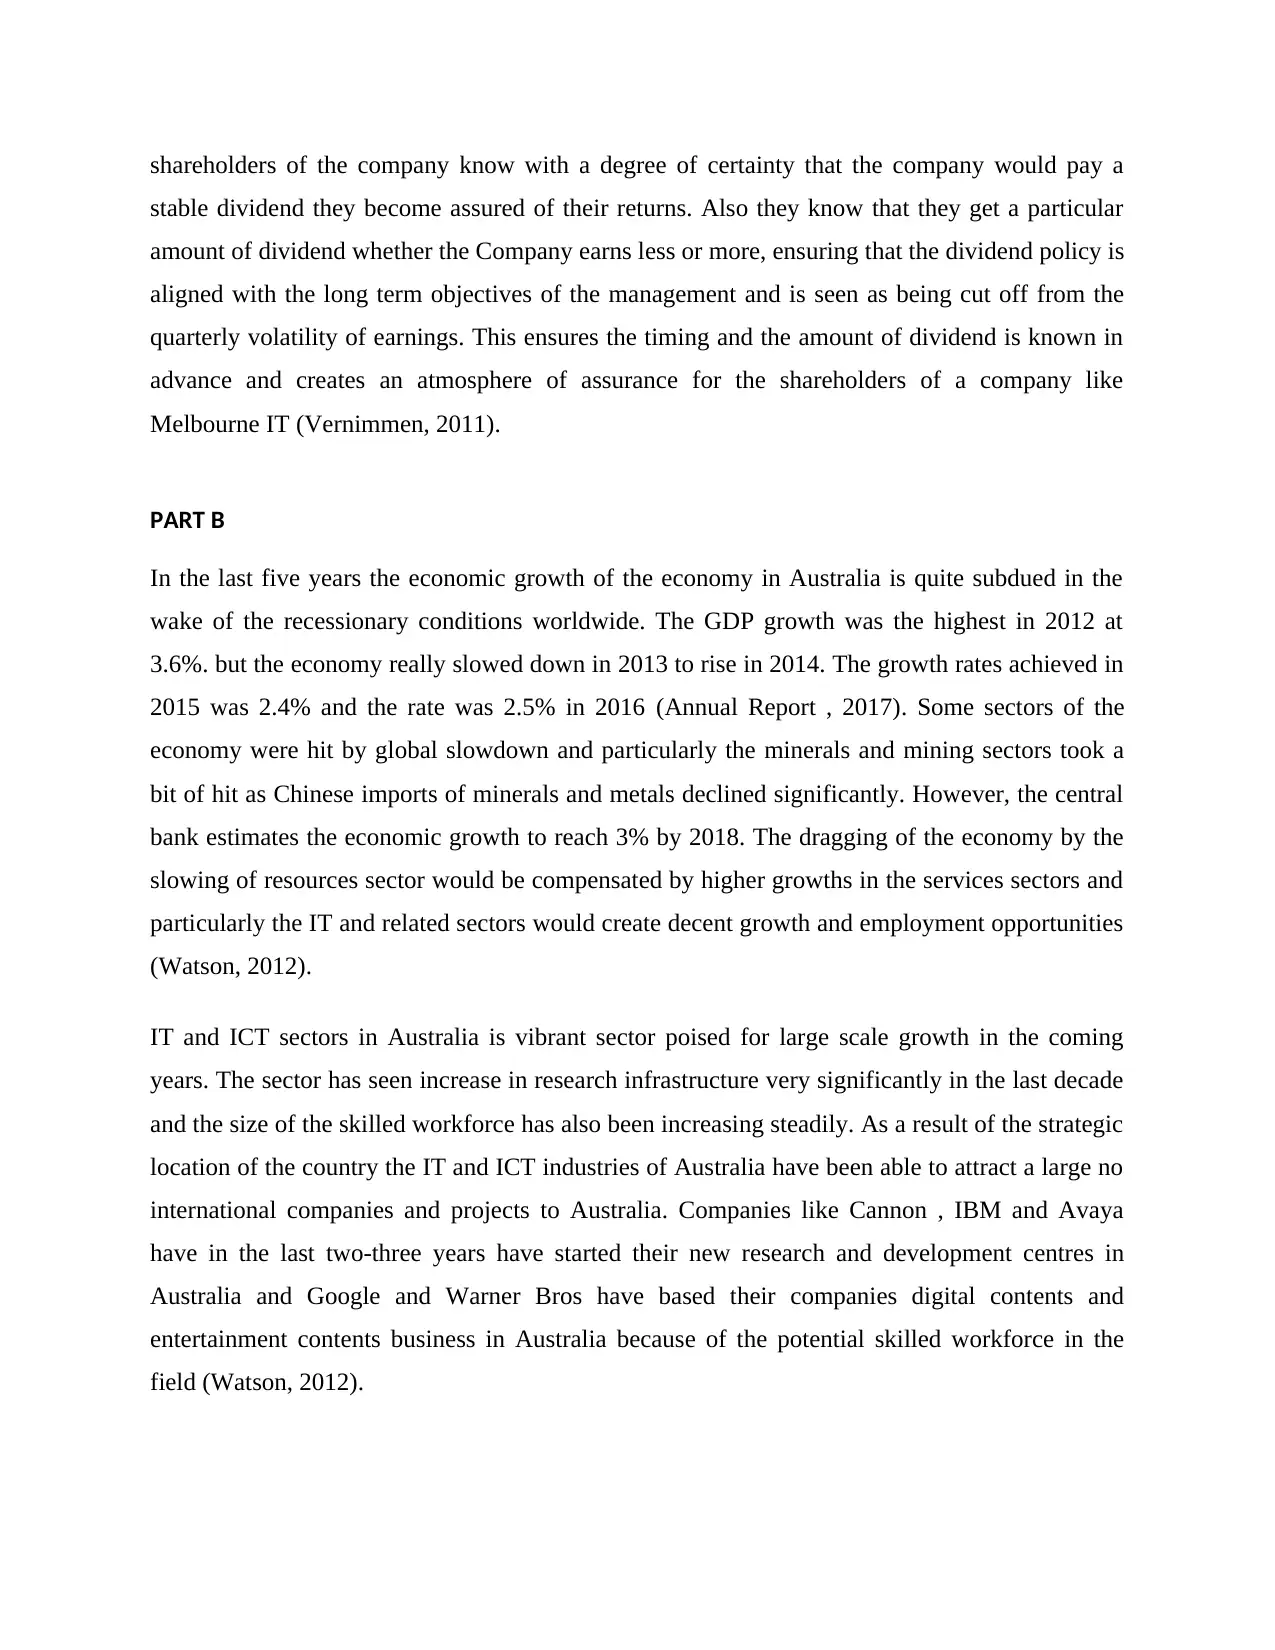
PART B
In the last five years the economic growth of the economy in Australia is quite subdued in the
wake of the recessionary conditions worldwide. The GDP growth was the highest in 2012 at
3.6%. but the economy really slowed down in 2013 to rise in 2014. The growth rates achieved in
2015 was 2.4% and the rate was 2.5% in 2016 (Annual Report , 2017). Some sectors of the
economy were hit by global slowdown and particularly the minerals and mining sectors took a
bit of hit as Chinese imports of minerals and metals declined significantly. However, the central
bank estimates the economic growth to reach 3% by 2018. The dragging of the economy by the
slowing of resources sector would be compensated by higher growths in the services sectors and
particularly the IT and related sectors would create decent growth and employment opportunities
(Watson, 2012).
IT and ICT sectors in Australia is vibrant sector poised for large scale growth in the coming
years. The sector has seen increase in research infrastructure very significantly in the last decade
and the size of the skilled workforce has also been increasing steadily. As a result of the strategic
location of the country the IT and ICT industries of Australia have been able to attract a large no
international companies and projects to Australia. Companies like Cannon , IBM and Avaya
have in the last two-three years have started their new research and development centres in
Australia and Google and Warner Bros have based their companies digital contents and
entertainment contents business in Australia because of the potential skilled workforce in the
field (Watson, 2012).
stable dividend they become assured of their returns. Also they know that they get a particular
amount of dividend whether the Company earns less or more, ensuring that the dividend policy is
aligned with the long term objectives of the management and is seen as being cut off from the
quarterly volatility of earnings. This ensures the timing and the amount of dividend is known in
advance and creates an atmosphere of assurance for the shareholders of a company like
Melbourne IT (Vernimmen, 2011).
PART B
In the last five years the economic growth of the economy in Australia is quite subdued in the
wake of the recessionary conditions worldwide. The GDP growth was the highest in 2012 at
3.6%. but the economy really slowed down in 2013 to rise in 2014. The growth rates achieved in
2015 was 2.4% and the rate was 2.5% in 2016 (Annual Report , 2017). Some sectors of the
economy were hit by global slowdown and particularly the minerals and mining sectors took a
bit of hit as Chinese imports of minerals and metals declined significantly. However, the central
bank estimates the economic growth to reach 3% by 2018. The dragging of the economy by the
slowing of resources sector would be compensated by higher growths in the services sectors and
particularly the IT and related sectors would create decent growth and employment opportunities
(Watson, 2012).
IT and ICT sectors in Australia is vibrant sector poised for large scale growth in the coming
years. The sector has seen increase in research infrastructure very significantly in the last decade
and the size of the skilled workforce has also been increasing steadily. As a result of the strategic
location of the country the IT and ICT industries of Australia have been able to attract a large no
international companies and projects to Australia. Companies like Cannon , IBM and Avaya
have in the last two-three years have started their new research and development centres in
Australia and Google and Warner Bros have based their companies digital contents and
entertainment contents business in Australia because of the potential skilled workforce in the
field (Watson, 2012).
The Australian software sector has been fitted largely form the comparatively lower development
costs and the presence of a very skilled labour force in the industry. As a result the country’s
economy has bene able to attract a large no of software making firms to the country and set up
base here. The digital content industry has recorded revenue upward of $23 billion in the last two
-three years and have attracted digital filmmaking as well (Watson, 2012).
In this backdrop, the Melbourne IT group has also benefited form the overall positive outlook of
the industry in Australia. The Company’s management has seen the revenue grow sizably in the
last two-three years (ROSS and Westerfield, 2012).
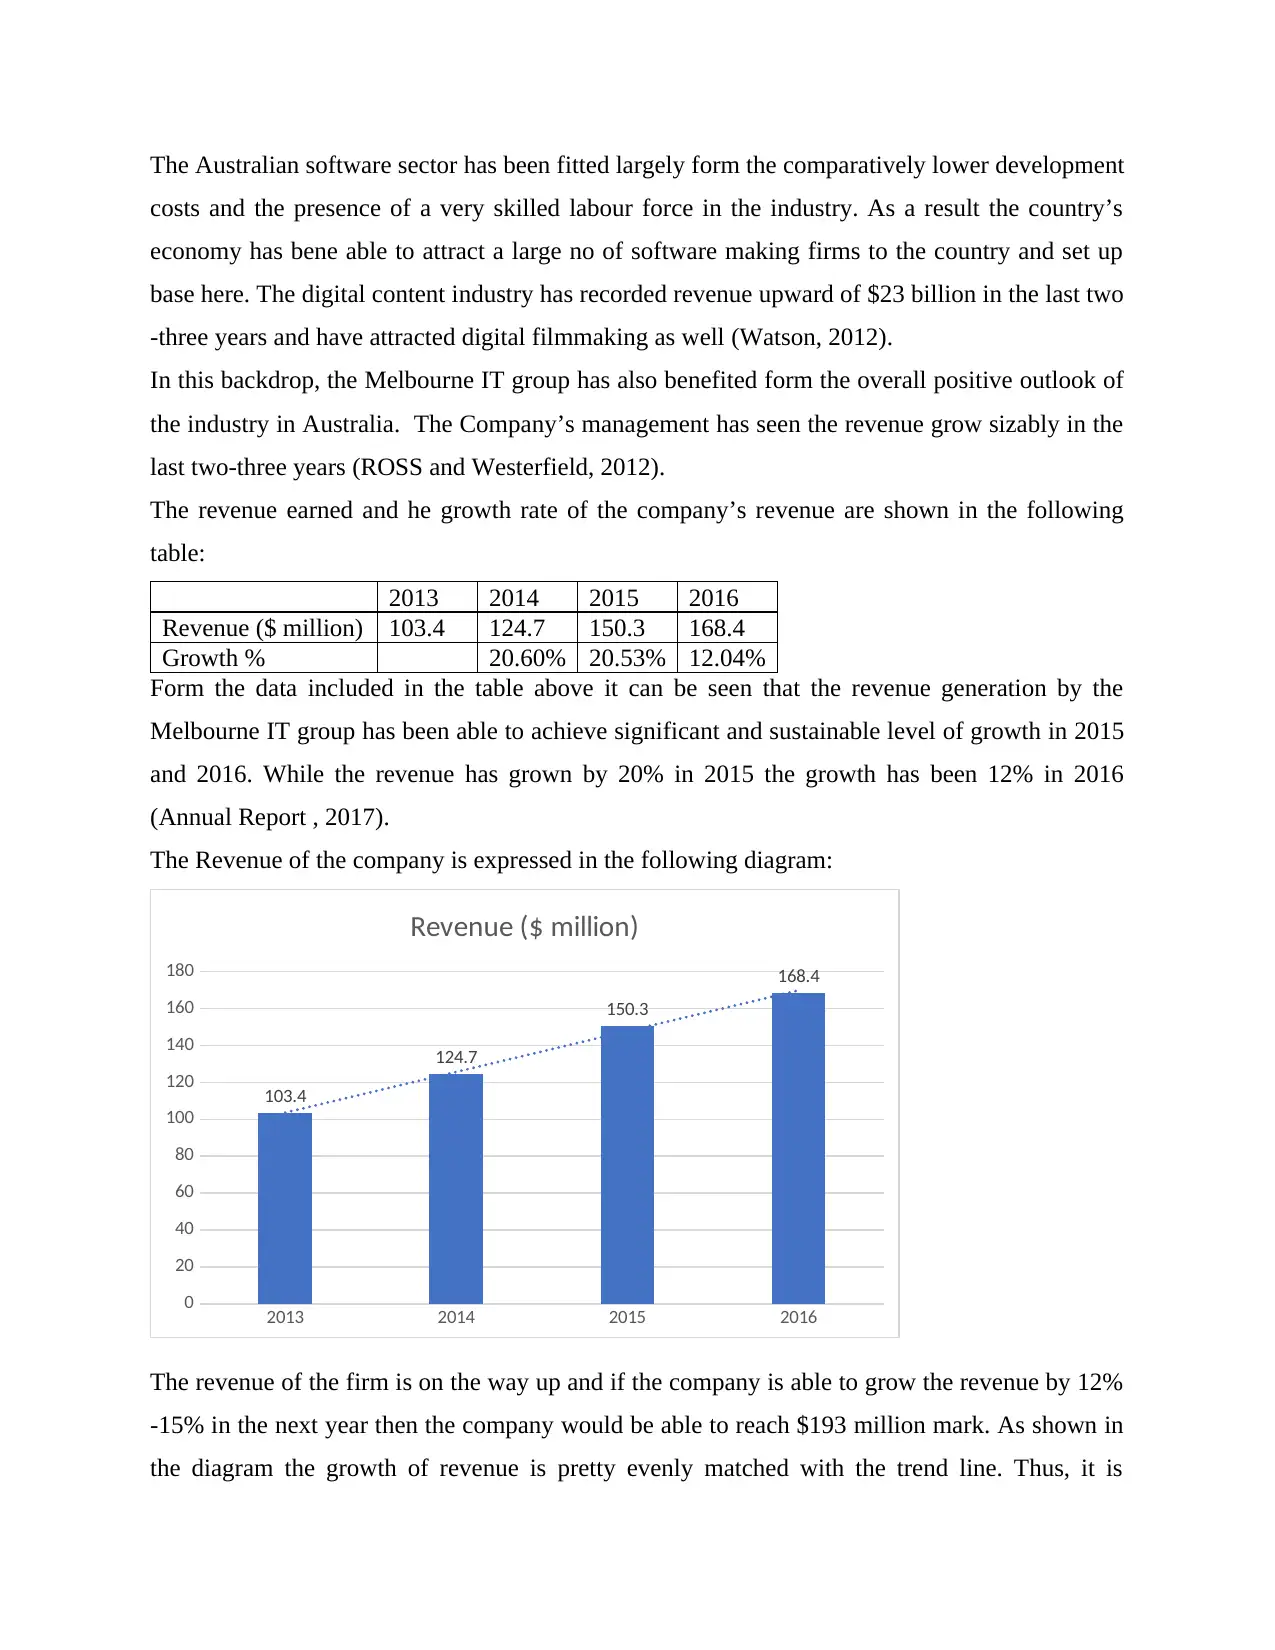
The revenue earned and he growth rate of the company’s revenue are shown in the following
table:
2013 2014 2015 2016
Revenue ($ million) 103.4 124.7 150.3 168.4
Growth % 20.60% 20.53% 12.04%
Form the data included in the table above it can be seen that the revenue generation by the
Melbourne IT group has been able to achieve significant and sustainable level of growth in 2015
and 2016. While the revenue has grown by 20% in 2015 the growth has been 12% in 2016
(Annual Report , 2017).
The Revenue of the company is expressed in the following diagram:
2013 2014 2015 2016
0
20
40
60
80
100
120
140
160
180
103.4
124.7
150.3
168.4
Revenue ($ million)
The revenue of the firm is on the way up and if the company is able to grow the revenue by 12%
-15% in the next year then the company would be able to reach $193 million mark. As shown in
the diagram the growth of revenue is pretty evenly matched with the trend line. Thus, it is
costs and the presence of a very skilled labour force in the industry. As a result the country’s
economy has bene able to attract a large no of software making firms to the country and set up
base here. The digital content industry has recorded revenue upward of $23 billion in the last two
-three years and have attracted digital filmmaking as well (Watson, 2012).
In this backdrop, the Melbourne IT group has also benefited form the overall positive outlook of
the industry in Australia. The Company’s management has seen the revenue grow sizably in the
last two-three years (ROSS and Westerfield, 2012).
The revenue earned and he growth rate of the company’s revenue are shown in the following
table:
2013 2014 2015 2016
Revenue ($ million) 103.4 124.7 150.3 168.4
Growth % 20.60% 20.53% 12.04%
Form the data included in the table above it can be seen that the revenue generation by the
Melbourne IT group has been able to achieve significant and sustainable level of growth in 2015
and 2016. While the revenue has grown by 20% in 2015 the growth has been 12% in 2016
(Annual Report , 2017).
The Revenue of the company is expressed in the following diagram:
2013 2014 2015 2016
0
20
40
60
80
100
120
140
160
180
103.4
124.7
150.3
168.4
Revenue ($ million)
The revenue of the firm is on the way up and if the company is able to grow the revenue by 12%
-15% in the next year then the company would be able to reach $193 million mark. As shown in
the diagram the growth of revenue is pretty evenly matched with the trend line. Thus, it is
expected that the company would be able to retain the same kind of growth in the 4 coming
quarters.
The expected growth rate for the company would be as follows:
Expected growth = (1.2053)(1.1204)1/2 -1 = 1.350418121/2 -1 = 1.1620 -1 = .620 = 16.2% (Eugene
Brigham & Michael Ehrhardt, 2010)
If the revenue grows at 16.2% for the next 4 quarters then the expected revenue would be in the
vicinity of $200million for the Melbourne IT group (Kane, 2015).
The Melbourne IT group prefers the use of the EBIDTA measure for measuring the forms
profitability. The EBIDTA of the company has increased significantly in the last two years on
account if an increase in the SMB business growing in 2015-2016 and enterprise business
division showing maturity (Eiteman, 2010).
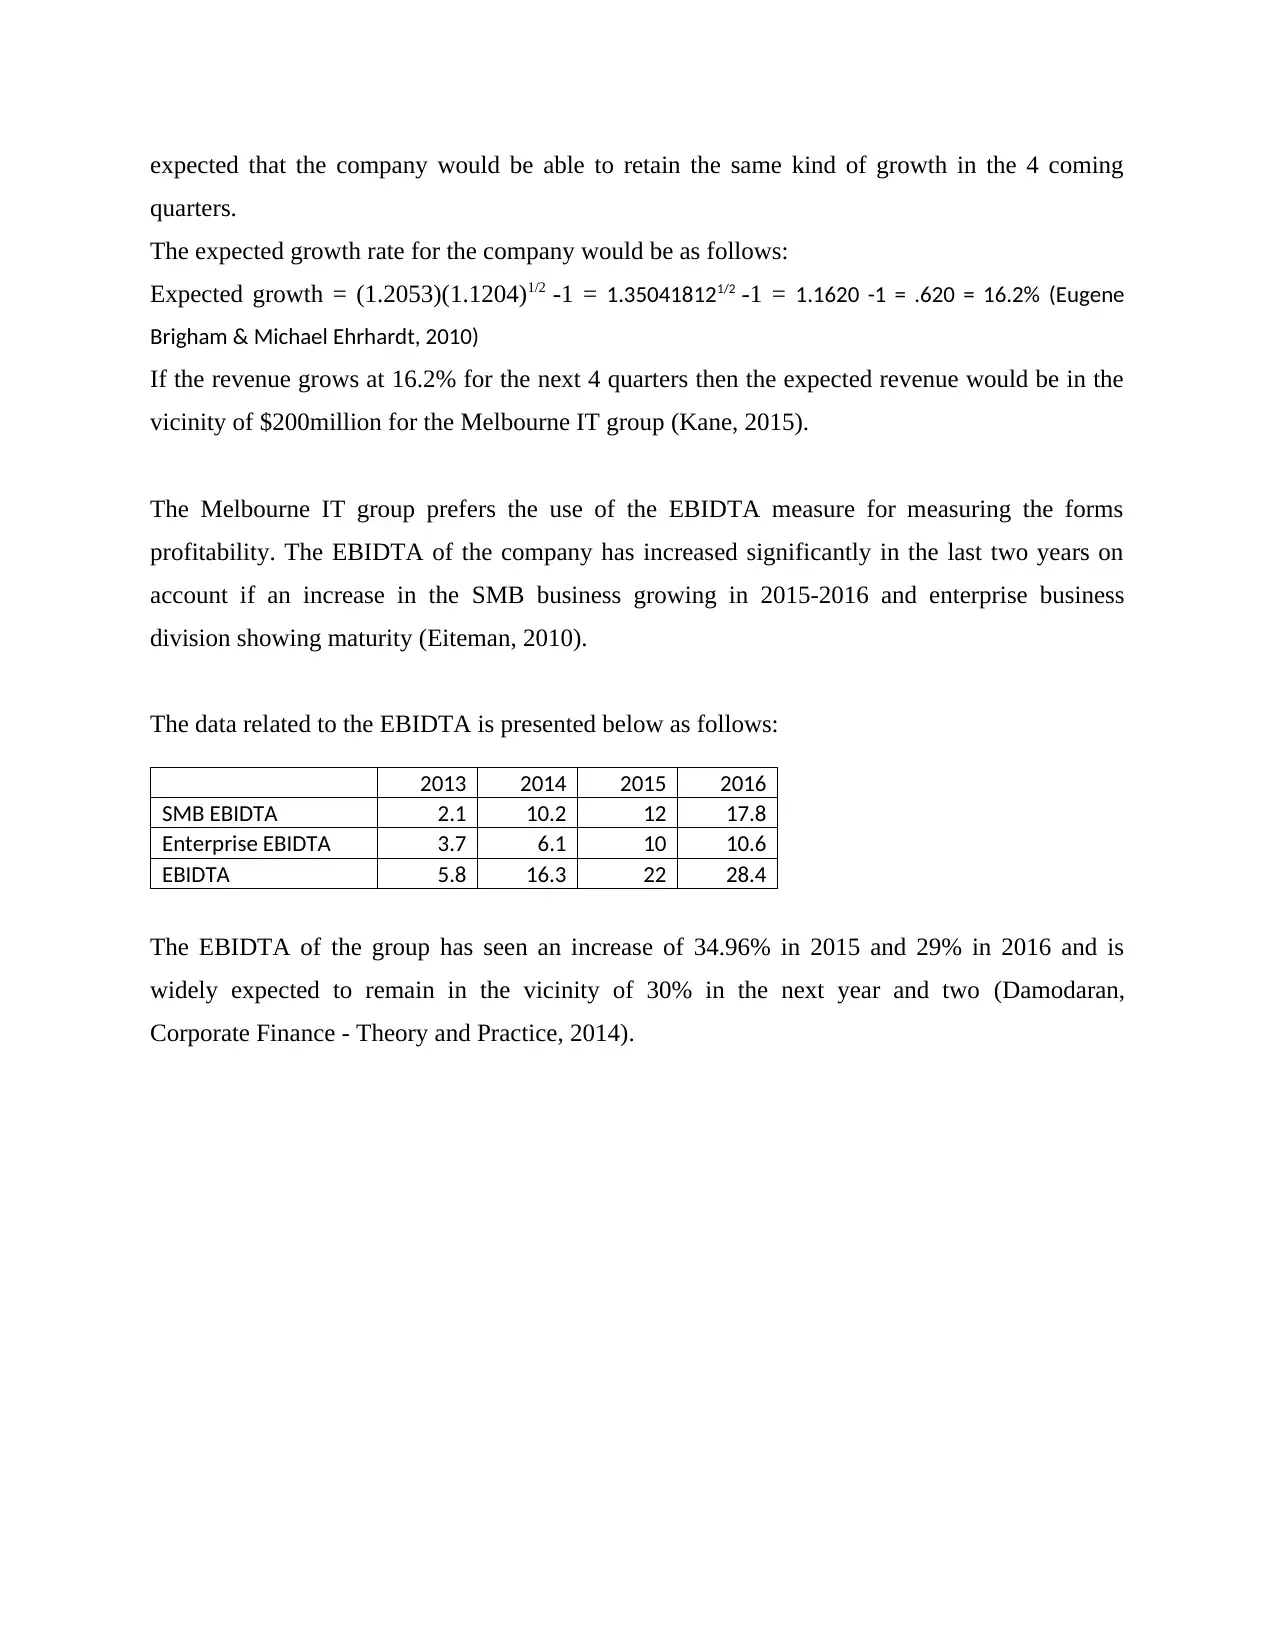
The data related to the EBIDTA is presented below as follows:
2013 2014 2015 2016
SMB EBIDTA 2.1 10.2 12 17.8
Enterprise EBIDTA 3.7 6.1 10 10.6
EBIDTA 5.8 16.3 22 28.4
The EBIDTA of the group has seen an increase of 34.96% in 2015 and 29% in 2016 and is
widely expected to remain in the vicinity of 30% in the next year and two (Damodaran,
Corporate Finance - Theory and Practice, 2014).
quarters.
The expected growth rate for the company would be as follows:
Expected growth = (1.2053)(1.1204)1/2 -1 = 1.350418121/2 -1 = 1.1620 -1 = .620 = 16.2% (Eugene
Brigham & Michael Ehrhardt, 2010)
If the revenue grows at 16.2% for the next 4 quarters then the expected revenue would be in the
vicinity of $200million for the Melbourne IT group (Kane, 2015).
The Melbourne IT group prefers the use of the EBIDTA measure for measuring the forms
profitability. The EBIDTA of the company has increased significantly in the last two years on
account if an increase in the SMB business growing in 2015-2016 and enterprise business
division showing maturity (Eiteman, 2010).
The data related to the EBIDTA is presented below as follows:
2013 2014 2015 2016
SMB EBIDTA 2.1 10.2 12 17.8
Enterprise EBIDTA 3.7 6.1 10 10.6
EBIDTA 5.8 16.3 22 28.4
The EBIDTA of the group has seen an increase of 34.96% in 2015 and 29% in 2016 and is
widely expected to remain in the vicinity of 30% in the next year and two (Damodaran,
Corporate Finance - Theory and Practice, 2014).
Paraphrase This Document
Need a fresh take? Get an instant paraphrase of this document with our AI Paraphraser
2013 2014 2015 2016
0
5
10
15
20
25
30
2.1
10.2 12
17.8
3.7
6.1
10 10.6
5.8
16.3
22
28.4
EBIDTA
SMB EBIDTA Enterprise EBIDTA
EBIDTA Linear (EBIDTA)
What has so far worked for the Melbourne IT group is the fact that the SMB division has
returned to high growth territory and the same can be seen for the above margins of EBIDTA.
While the overall EBIDTA has grown by 29% in 2016 and 34% approx. in 2015 the EBIDTA of
the SMB division has grown by 48.33% in 2016. This points towards higher growth of EBDITA
in the coming two years if growth of revenue can be sustained (Damodaran, APPLIED
CORPORATE FINANCE, 2012).
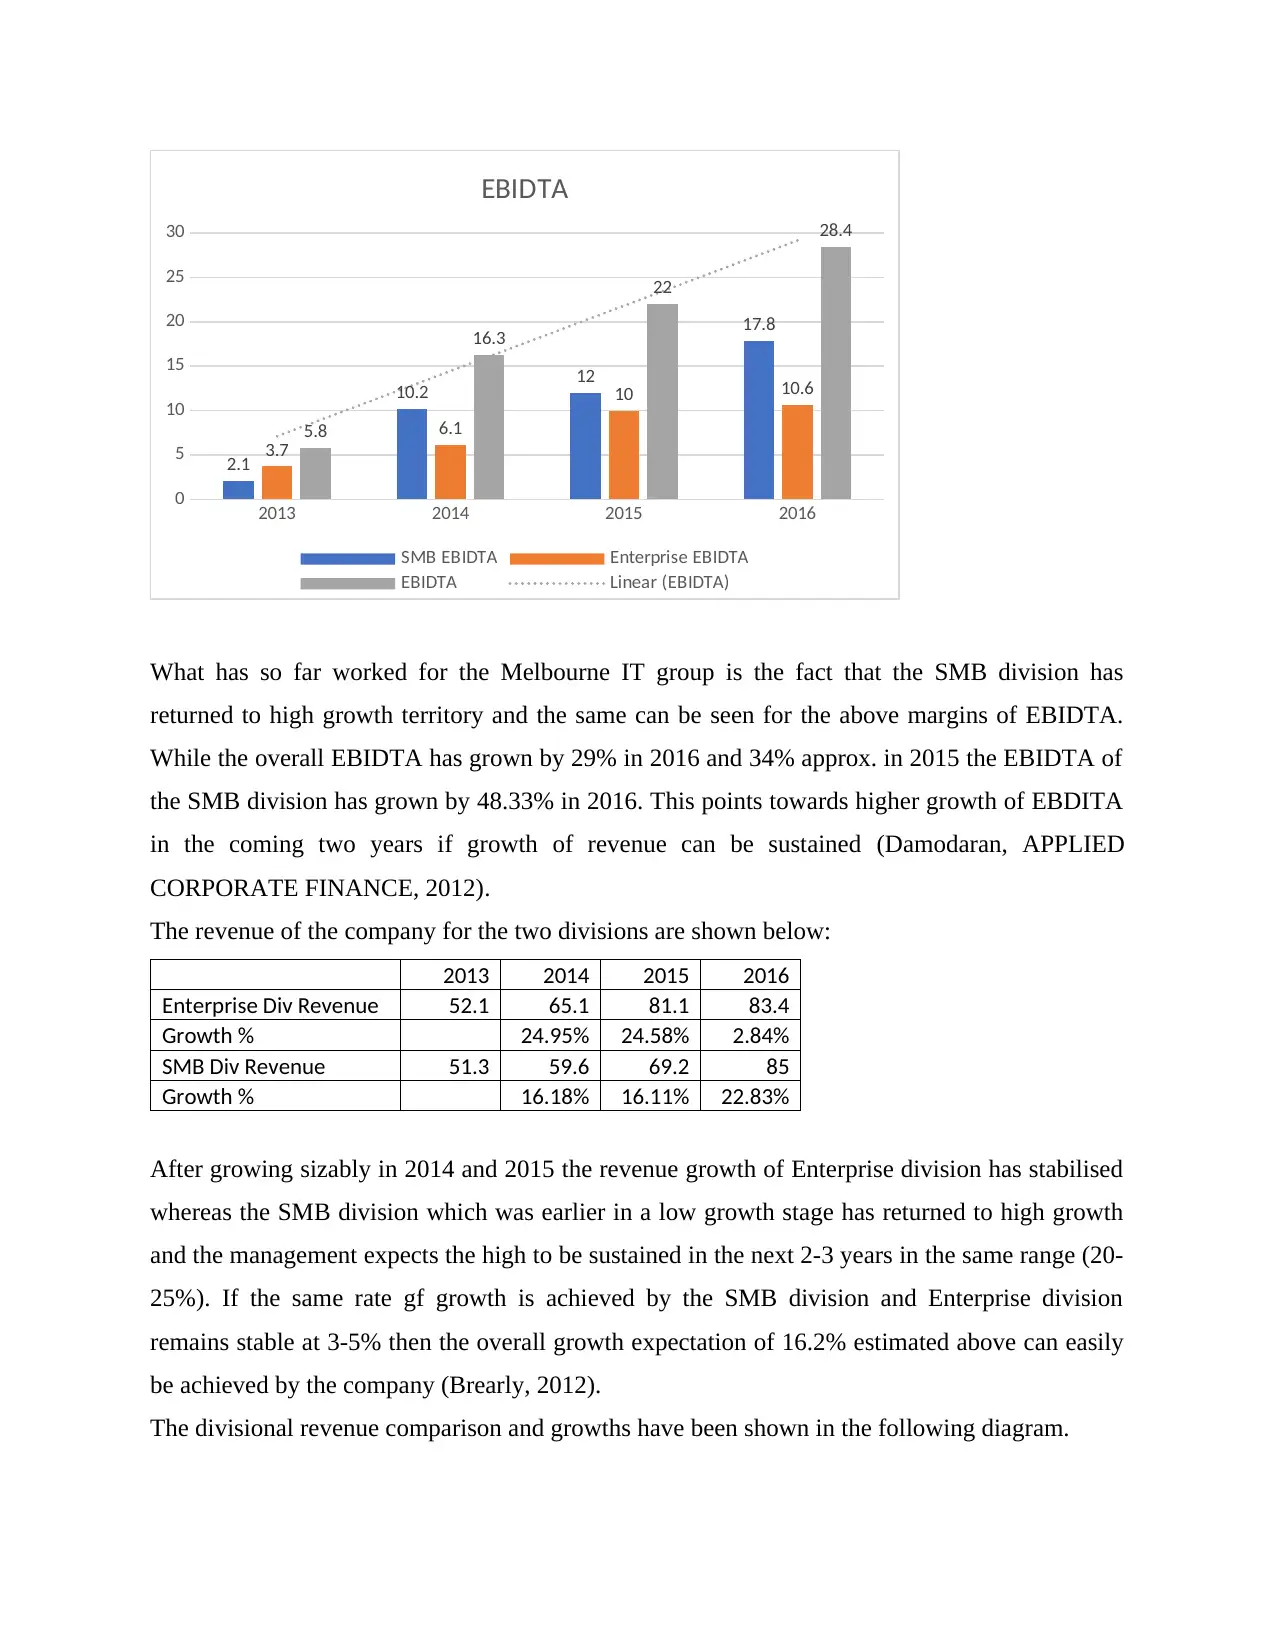
The revenue of the company for the two divisions are shown below:
2013 2014 2015 2016
Enterprise Div Revenue 52.1 65.1 81.1 83.4
Growth % 24.95% 24.58% 2.84%
SMB Div Revenue 51.3 59.6 69.2 85
Growth % 16.18% 16.11% 22.83%
After growing sizably in 2014 and 2015 the revenue growth of Enterprise division has stabilised
whereas the SMB division which was earlier in a low growth stage has returned to high growth
and the management expects the high to be sustained in the next 2-3 years in the same range (20-
25%). If the same rate gf growth is achieved by the SMB division and Enterprise division
remains stable at 3-5% then the overall growth expectation of 16.2% estimated above can easily
be achieved by the company (Brearly, 2012).
The divisional revenue comparison and growths have been shown in the following diagram.
0
5
10
15
20
25
30
2.1
10.2 12
17.8
3.7
6.1
10 10.6
5.8
16.3
22
28.4
EBIDTA
SMB EBIDTA Enterprise EBIDTA
EBIDTA Linear (EBIDTA)
What has so far worked for the Melbourne IT group is the fact that the SMB division has
returned to high growth territory and the same can be seen for the above margins of EBIDTA.
While the overall EBIDTA has grown by 29% in 2016 and 34% approx. in 2015 the EBIDTA of
the SMB division has grown by 48.33% in 2016. This points towards higher growth of EBDITA
in the coming two years if growth of revenue can be sustained (Damodaran, APPLIED
CORPORATE FINANCE, 2012).
The revenue of the company for the two divisions are shown below:
2013 2014 2015 2016
Enterprise Div Revenue 52.1 65.1 81.1 83.4
Growth % 24.95% 24.58% 2.84%
SMB Div Revenue 51.3 59.6 69.2 85
Growth % 16.18% 16.11% 22.83%
After growing sizably in 2014 and 2015 the revenue growth of Enterprise division has stabilised
whereas the SMB division which was earlier in a low growth stage has returned to high growth
and the management expects the high to be sustained in the next 2-3 years in the same range (20-
25%). If the same rate gf growth is achieved by the SMB division and Enterprise division
remains stable at 3-5% then the overall growth expectation of 16.2% estimated above can easily
be achieved by the company (Brearly, 2012).
The divisional revenue comparison and growths have been shown in the following diagram.
2013 2014 2015 2016
0
10
20
30
40
50
60
70
80
90
52.1
65.1
81.1 83.4
51.3
59.6
69.2
85
Divisional Revenue
Enterprise Div Revenue SMB Revenue
From a comparatively lower proportion the high growth achieved by the SMB division in the last
two years have made it possible for the division to surpass the enterprise divisions and the same
trend would also be expected to be seen in the next 1-2 years (Berger, 2014).
Another factor which shall not be left behind in this discussion is the fact that the EBIDTA
percentage of the SMB division of late has bene excellent (BERK & DEMARZO, 2016). This
can be seen form the following table:
2013 2014 2015 2016
Revenue ($ million) 103.4 124.7 150.3 168.4
EBIDTA 5.8 16.3 22 28.4
EBIDTA %
5.61
%
13.07
%
14.64
%
16.86
%
SMB Revenue 51.3 59.6 69.2 85
SMB EBIDTA 2.1 10.2 12 17.8
SMB EBIDTA %
4.09
%
17.11
%
17.34
%
20.94
%
Enterprise Div Revenue 52.1 65.1 81.1 83.4
Enterprise EBIDTA 3.7 6.1 10 10.6
Enterprise EBIDTA %
7.10
% 9.37%
12.33
%
12.71
%
While the company’s overall EBIDTA margin is 14.64% and 16.86% in 2015 and 2016 the same
for the SMB division is much higher in both the years at 17.34% and 20.94%. at the same time,
the EBIDTA margin for the company’s Enterprise division has been lower at 12.33% and
12.71% in 2015 and 2016. Thus, it can be concluded from the above analysis that the EBIDTA
margin of the company would improve further if the management puts in more efforts to increase
the revenue for the SMB division (Atrill & Eddie, 2012).
The current economic conditions prevailing in Australian IT and ICT sectors are positive and the
company can easily achieve a sustainable rate of growth in the next 1 year and the management
is needed to concentrate of the growing SMB division to increase the earning quality.
Bibliography
Annual Report . (2017). Annual Report 2016, Melbourne IT Group. Melbourne IT Group.
Atrill, P., & Eddie, M. (2012). Accounting and Finance (5th ed.). LONDON: Prentice Hall Financial Times.
Berger, S. (2014). FUNDAMENTALS OF HEALTH CARE FINANCE. San Francisco: Jossey-Bass(jOHN wiley
and Sons).
BERK, J., & DEMARZO, P. (2016). corporate finance. Boston: Pearson Educaitonal Publication.
bloomberg.com. (2017, August 22nd).
www.bloomberg.com/markets/rates-bonds/government-bonds/australia. Retrieved from
www.bloomberg.com: www.bloomberg.com/markets/rates-bonds/government-bonds/australia
Brearly, M. &. (2012). Corporate finance (9th ed.). Chicago: McGraw Hill Irwin.
Damodaran, A. (2012). APPLIED CORPORATE FINANCE (FOURTH EDITION ed.). Chicago: Wiley Publishers.
Damodaran, A. (2014). Corporate Finance - Theory and Practice (2nd ed.). NewYork: Wiley Educaitonal
Publishers.
Secure Best Marks with AI Grader
Need help grading? Try our AI Grader for instant feedback on your assignments.
Eiteman, D. K. (2010). Fundamentals of Multinational Finance (3rd ed.). London: Pearson Education.
Eugene Brigham & Michael Ehrhardt. (2010). corporate finance (13th ed ed.). Chicago: Mcgrawhill Irwin.
Kane, Z. B. (2015). Investments (10th ed.). NewYork: McGrawhill Education .
Luenberger, D. G. (2012). Investment Science (1st ed.). London: Oxford University Press.
Pascal Quiry, M. D. (2015). Corporate Finance - Theory and practice (8th ed.). Chicago: Wiley Publishers.
ROSS and Westerfield. (2012). fundamentals of corporate finance (9th ed.). cengage learning .
Schill, R. B. (2015). Cases in finance (6th ed.). NewYork : McgrawHill educaiton .
Vernimmen, P. (2011). Corporate Finance: Theory and Practice (3rd ed.). Chichester, West Sussex: John
Wiley & Sons, Inc.
Watson, D. a. (2012). Corporate Finance Principles and Practice. (6th ed.). Harlow: Pearson Publishers .
1 out of 11
Your All-in-One AI-Powered Toolkit for Academic Success.
+13062052269
info@desklib.com
Available 24*7 on WhatsApp / Email
![[object Object]](/_next/static/media/star-bottom.7253800d.svg)
Unlock your academic potential
© 2024 | Zucol Services PVT LTD | All rights reserved.