7247AFE: Apple Company Alternative Investment Report for QLD Titanium
VerifiedAdded on 2022/12/14
|22
|5218
|491
Report
AI Summary
This report serves as an investment analysis of Apple Corporation, evaluating its potential as an alternative investment for QLD Titanium Equity Management. The report begins with an executive summary and an introduction outlining the report's purpose: to provide QLD Titanium with an investment opportunity that maximizes returns and minimizes losses. The report provides a detailed literature review of Apple, including its history, products, services, and global market position. The body of the report focuses on Apple's liquidity ratios (cash ratio, current ratio, quick ratio) and historical returns. The analysis includes tables of financial data and performance summaries, providing a comprehensive overview of Apple's financial health and investment potential. The report highlights Apple's unique characteristics, its consumer satisfaction, and its global achievements, supporting the justification for its selection as an alternative investment. The report concludes with an assessment of Apple's strengths and weaknesses to assist QLD Titanium in making an informed investment decision.

ETHICS AND ALTERNATIVE
INVESTMENTS.
NAME:
EMAIL:
STUDENT ID:
DATE OF REPORT:
WORD COUNT:
INVESTMENTS.
NAME:
EMAIL:
STUDENT ID:
DATE OF REPORT:
WORD COUNT:
Paraphrase This Document
Need a fresh take? Get an instant paraphrase of this document with our AI Paraphraser
EXECUTIVE SUMMARY.
The report explains different points and ideas. It comprises of an alternative investment which is
Apple Company for QLD Equity Management. The report outlines the different characteristics of
Apple Company showing both its strengths and weakness. They is also a literature review indicating
when the company was founded and also indicating the core owners. The report mainly aims at giving
QLD Titanium Equity Management an alternative investment in which the organization can invest in
without fear of losing.
INTRODUCTION.
The report aims at providing QLD Titanium Equity Management an alternative investment where the
company can make more profits than losses. The investment alternative to be chosen should possess
unique characteristics that promote maximization and diminished loses. In this report, Apple
Corporation was the alternative investment decision made for the QLD Titanium Equity Management.
Also, the report aims at providing the alternative investment details in parts of returns, risk Skewness,
kurtosis, correlation, Sharpe ratio, and the company’s liquidity. The report also explains the
alternative investment background information Example the owners or the year it started it is
operation.
JUSTIFICATIONS.
Apple Company is a global organization that has significantly developed due to its unique practices
and characteristics. The companies aim to ensure consumer satisfaction by producing quality products
that make a purchaser life more comfortable and relaxed. The company is known globally for its
achievements over the years since it is the foundation (Iglesias, O., & Saleem, F. Z, 2015).
LITERATURE REVIEW.
Apple Company is an American intercontinental applied science incorporation whose headquarters
are in California Cupertino. Apple designs sell and enhance the development of purchaser’s needs,
online services, and various computer software. The company globally is considered as one of the big
four corporations alongside Google, Facebook, and Amazon (Iglesias, O., & Saleem, F. Z., 2015).
The corporation hardware products that it produces and sells the iPad, the Apple smart watch, the air
pod wireless ear buds, the home pod smart speaker, the Apple TV digital and media player. Apples
also manufacture software that includes tvOS, watchOS, Ipad, Ios, macOS operating systems, the
shazam fingerprint feature, the safari internet browser, iWork productivity, and creativity suites,
though the multinational company also has professional applications that include Xcode, logic pro and
the final cut pro. The corporation services that are usually conducted online include the Apple TV,
and I cloud, I Message, Ios App Store, Apple Music, and mac app store. The company other
commonly used services globally include the famous apple care, apple card, apple pay, apple pay
cash, genius bar, and apple store (Fogliasso, C. E., & Williams, A, 2014).
The company was formed by Ronald Wayne, Steve Wozniak and Steve Jobs in the year 1976 April
purposely to sell and bloom apples one desktop computer, though Ronald Wayne sold his whole
shares in the company back in the years within 12 days. The entire organization was incorporated as
apple incorporation in 1977 January in which the overall sales of the company grew substantially. In a
few years after the establishment, the remaining two partners had acquired the ability to hire qualified
that included designers and software engineers (Kahney and Leander, 2014). In 1980 Apple
Corporation made it is a financial breakthrough in which the years that followed the company started
shipping to other continents, the computers possessed unique features such as the 1984 original
Macintosh. The company’s marketing prowess lead to widespread positive criticism on their products
and also increased acceptance. However, the Apple products high prices lead to limited purchases and
even power disputes between the executives in which led to the exit of Wozniak while the remaining
owner Steve Jobs also departed to found neXT (Guiso, L., Sapienza, P., & Zingales, L, 2015).
Through the years of the 1990s as the market for minicomputers extensively grew and evolved, the
company lost sales due to the availability of Microsoft Windows on Intel pc clones that are lowlier
priced than their organization. The management then employed CEO Gil Amelio with the aims of the
CEO, ensuring the improvement of the company in terms of sales, employee’s recruitment, executive
restructuring, and customer retention. In the year 1997, the new chief executive officer bought neXT
⊘ This is a preview!⊘
Do you want full access?
Subscribe today to unlock all pages.
Trusted by 1+ million students worldwide
which solved the need for an operating system that did not fail quickly and the chief executive officer
also brought one of the initial core founders, Steve Jobs, back to the company( Koblin and John
(March 25, 2018).Steve Jobs consequently gained back his leadership role in the company, becoming
the company’s chief executive officer in 2000.The company after the changes regained its market
through its unique and quality mini computers under the campaign of think differently, by the launch
of the popular iMac software in 1998, and also the company merged uniquely small companies that
helped it in advertising its different products( K Pearce, R Golley, L Lewis, L Cassidy,2018).In 2007
January Steve Job being the chief executive officer renamed the corporation Apple Inc., which in turn
shifted it is major concerns to producing consumer electronics and the introduction of the iPhone
phone that created financial success and globally acceptance. In the year 2011 august after the
numerous changes and success of the company Steve Job resigned as the chief executive officer
because of complicated health problems whereby Tim cook took over as the new chief executive
officer. Then almost two months after the founder and former Chief executive officer of Apple Steve
Jobs had resigned, he died (ML Guckian, DA Chapman, and B Lickel, 2018).
Presently Apple is known for it is revenues and size; globally, annual income is approximately $265
in the year 2018. The company is the world’s most enormous technology corporation by income
annually, and also it’s the most unique and contains valuable products worldwide. The company is the
world third largest smartphone manufactures following Huawei and Samsung closely. As at 2018 the
company was employing 12300 full-time personnel with over 504 retail stores in about 24 countries
globally. Apple also becomes the first United States company to be valued at over $1 trillion. As of
2018 January, over 1.3 billion apple products are used globally by its consumers as it operates the
famous iTunes stores, which are known globally to be the most significant music store. The
Cooperation enjoys a lot of consumer loyalty due to its unique products and valuable assets (Schein,
E. H, 2010).
Paraphrase This Document
Need a fresh take? Get an instant paraphrase of this document with our AI Paraphraser
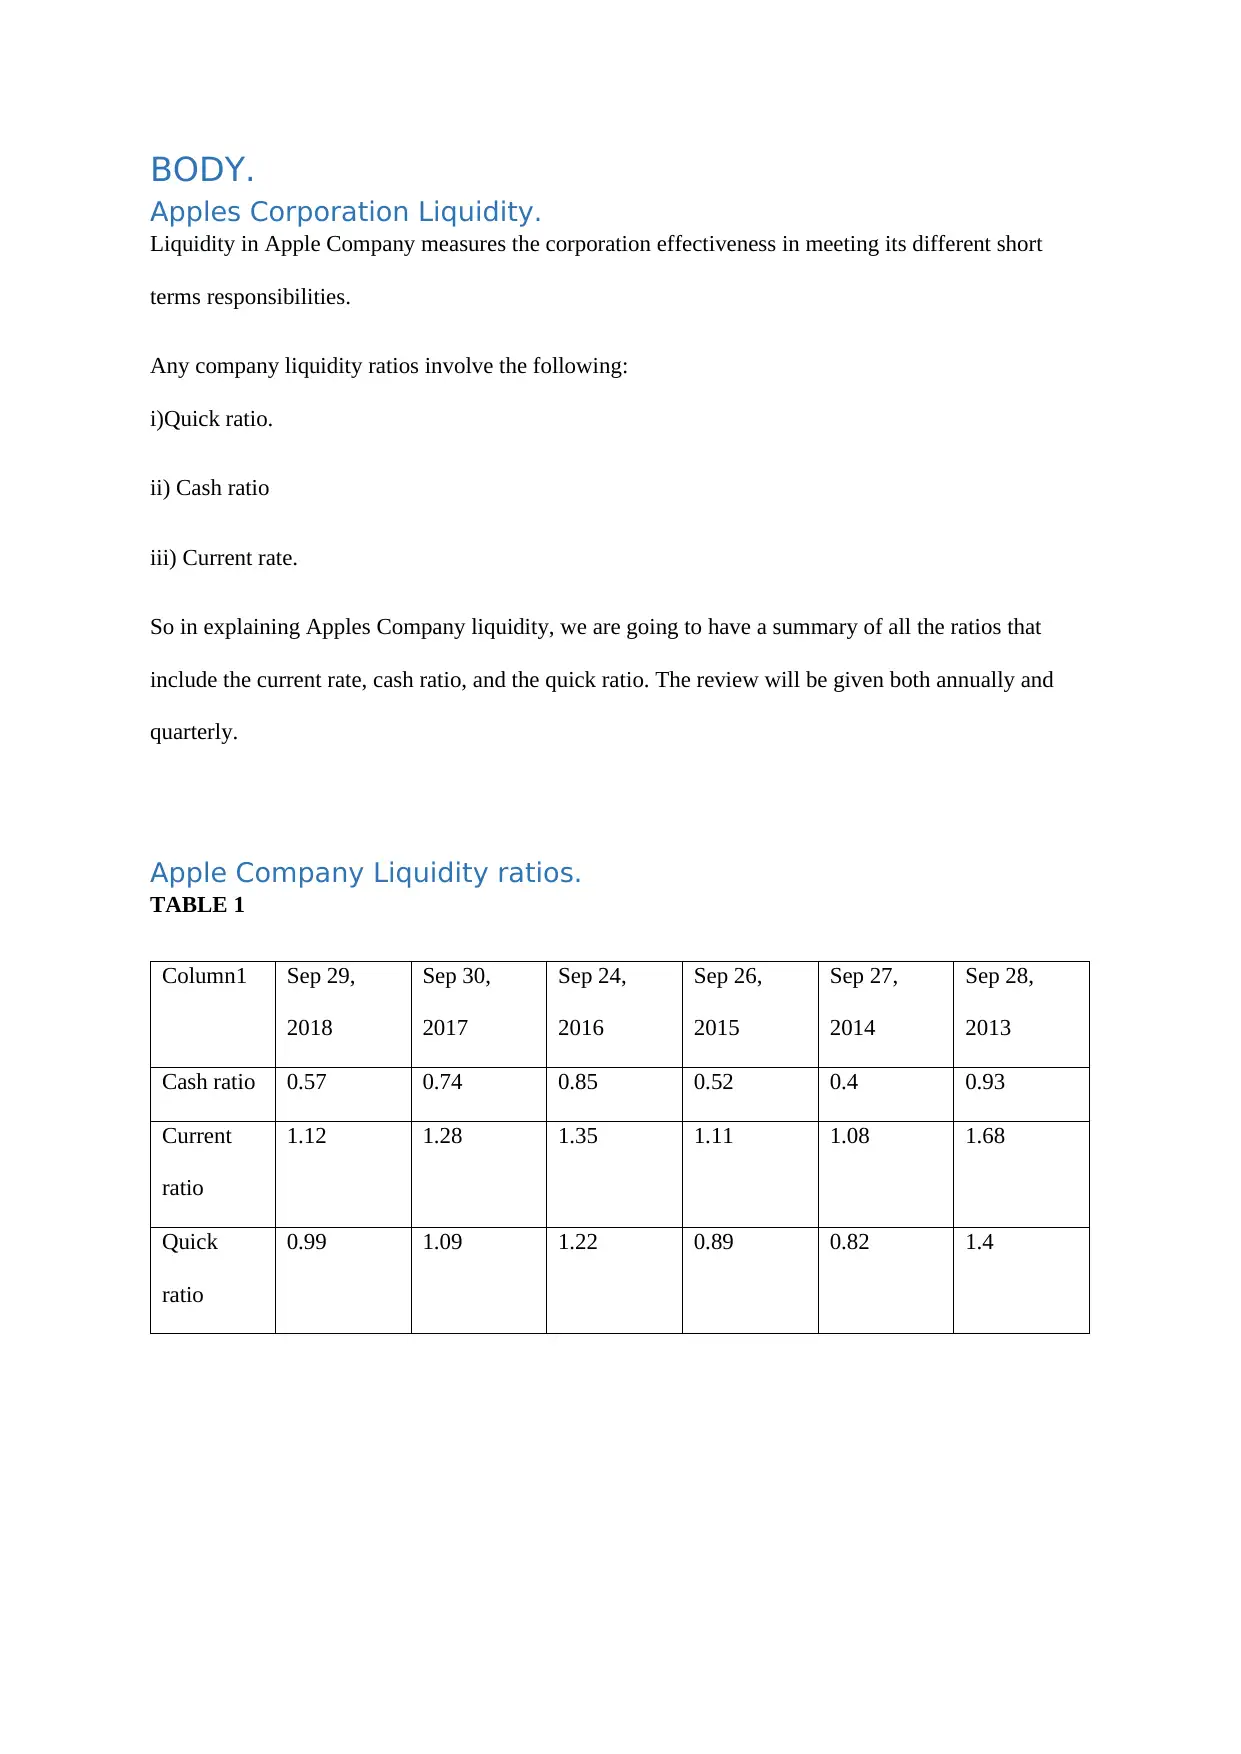
BODY.
Apples Corporation Liquidity.
Liquidity in Apple Company measures the corporation effectiveness in meeting its different short
terms responsibilities.
Any company liquidity ratios involve the following:
i)Quick ratio.
ii) Cash ratio
iii) Current rate.
So in explaining Apples Company liquidity, we are going to have a summary of all the ratios that
include the current rate, cash ratio, and the quick ratio. The review will be given both annually and
quarterly.
Apple Company Liquidity ratios.
TABLE 1
Column1 Sep 29,
2018
Sep 30,
2017
Sep 24,
2016
Sep 26,
2015
Sep 27,
2014
Sep 28,
2013
Cash ratio 0.57 0.74 0.85 0.52 0.4 0.93
Current
ratio
1.12 1.28 1.35 1.11 1.08 1.68
Quick
ratio
0.99 1.09 1.22 0.89 0.82 1.4
Cash ratio. This is a liquidity ratio that is always calculated by dividing the cash equivalents and cash
of any company over its current liabilities. Apple company cash ratio experienced deterioration from
2016 to 2017 and also from 2017 to 2018(W Lazonick, M Mazzucato, and Ö Tulum, 2013).
Current ratio. This is a liquidity ratio that is usually calculated by dividing the existing assets by the
current liabilities. Apple company in 2016 to 2017 it is current rate also deteriorated in 2017 to 2018
the same was experienced (S Orellana, 2019).
Quick ratio. This is a liquidity ratio calculated by dividing the current total assets over the total
current liabilities. In Apple Company, the quick ratio deteriorated from 2016 to 2017, and the same
thing happened in 2017 to 2018(U.S. Department of Commerce, 2019).
Returns
Apple Company manufactures unique designs and sells smartphones, minicomputers, and media
devices. It also deals with the development of novel and valuable applications, software, accessories,
services, and third-party digital content. Apple Inc. designs to manufacture, and markets mobile
communication and media devices, and personal computers. It also sells various related software,
services, accessories, and third-party digital content and applications (C Owen and R Philip, 2018).
Performance Summary
In the last latest year Apples return on its assets is 16.6% while its four-year return on its assets as of
2017 September was approximately 13.9%. The company’s assets return over the years rose
considerably during the year 2015 September at a percentage of 20.5(U.S. Department of Commerce,
2016).In 2016 the corporation's returns on various assets decreased substantially from a rate of 14.9
minus 27 while in 2017 a reduction of 13.9 minus 7.1 was experienced which greatly affected the
development of the company and in 2018 the return on assets increased from 16.1% plus 15.8. In its
fiscal year ending 2014 September to 2018, the Apples return averaged at a percentage of 16.7.
Generally the Apple company return on assets in approximately 2.0 percent which is 730% greater
than any company operating in the technology sector as of 2019(Taylor and Harriet (August 30,
2016).
⊘ This is a preview!⊘
Do you want full access?
Subscribe today to unlock all pages.
Trusted by 1+ million students worldwide
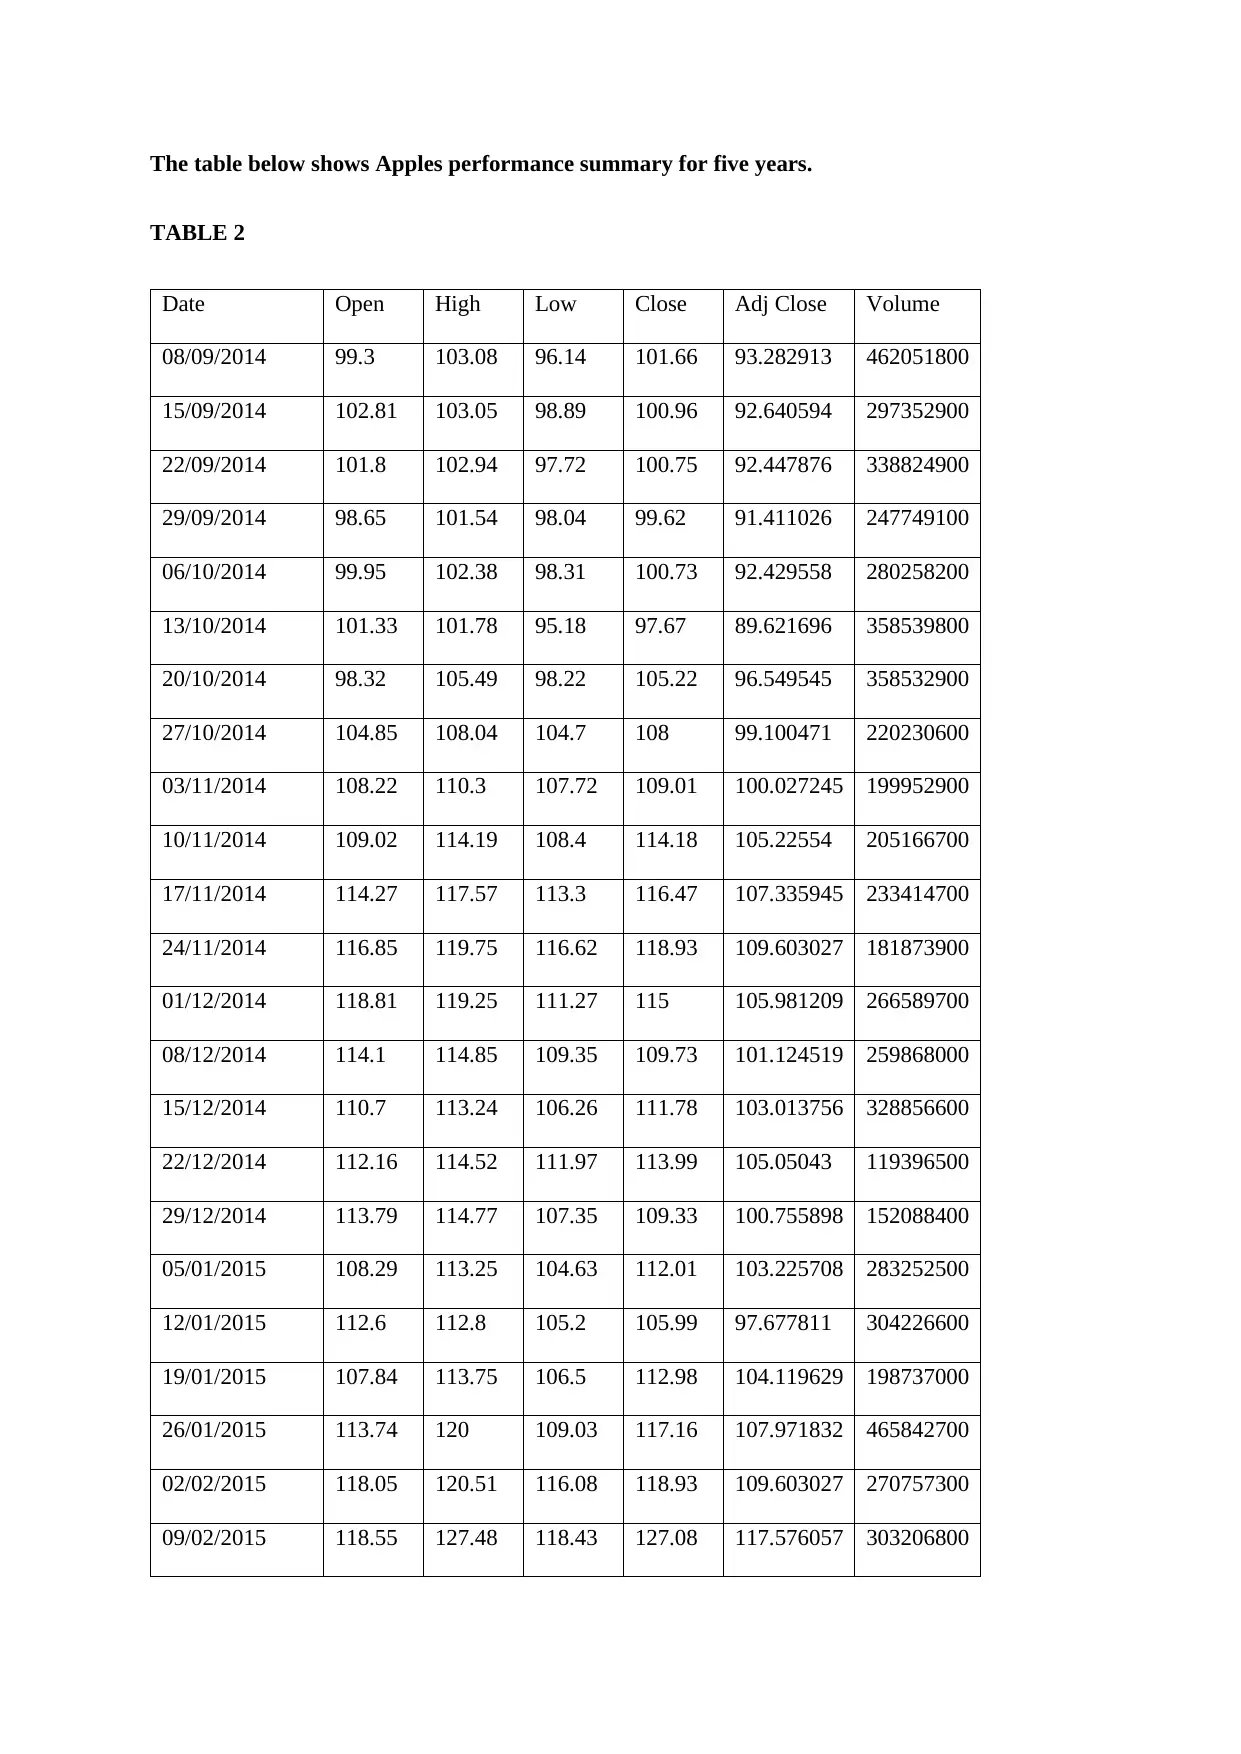
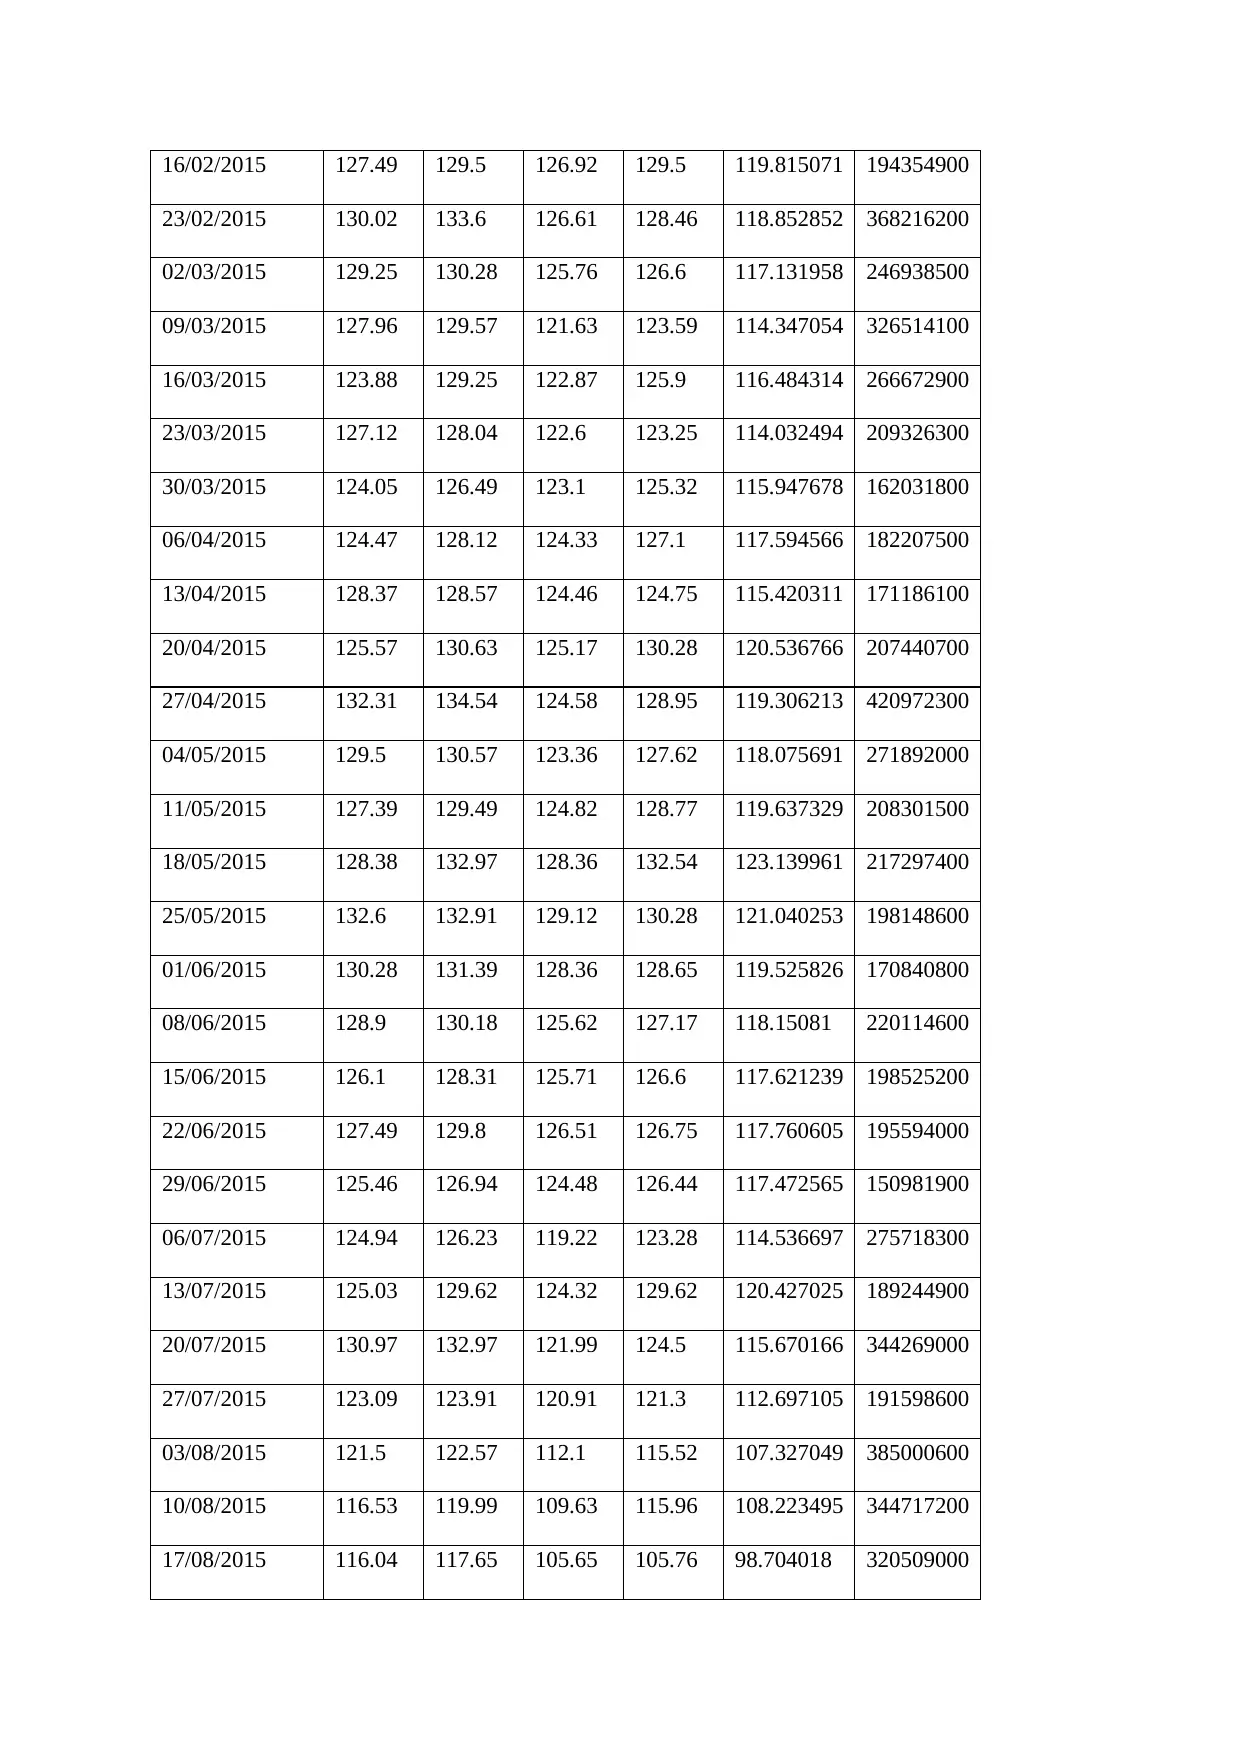
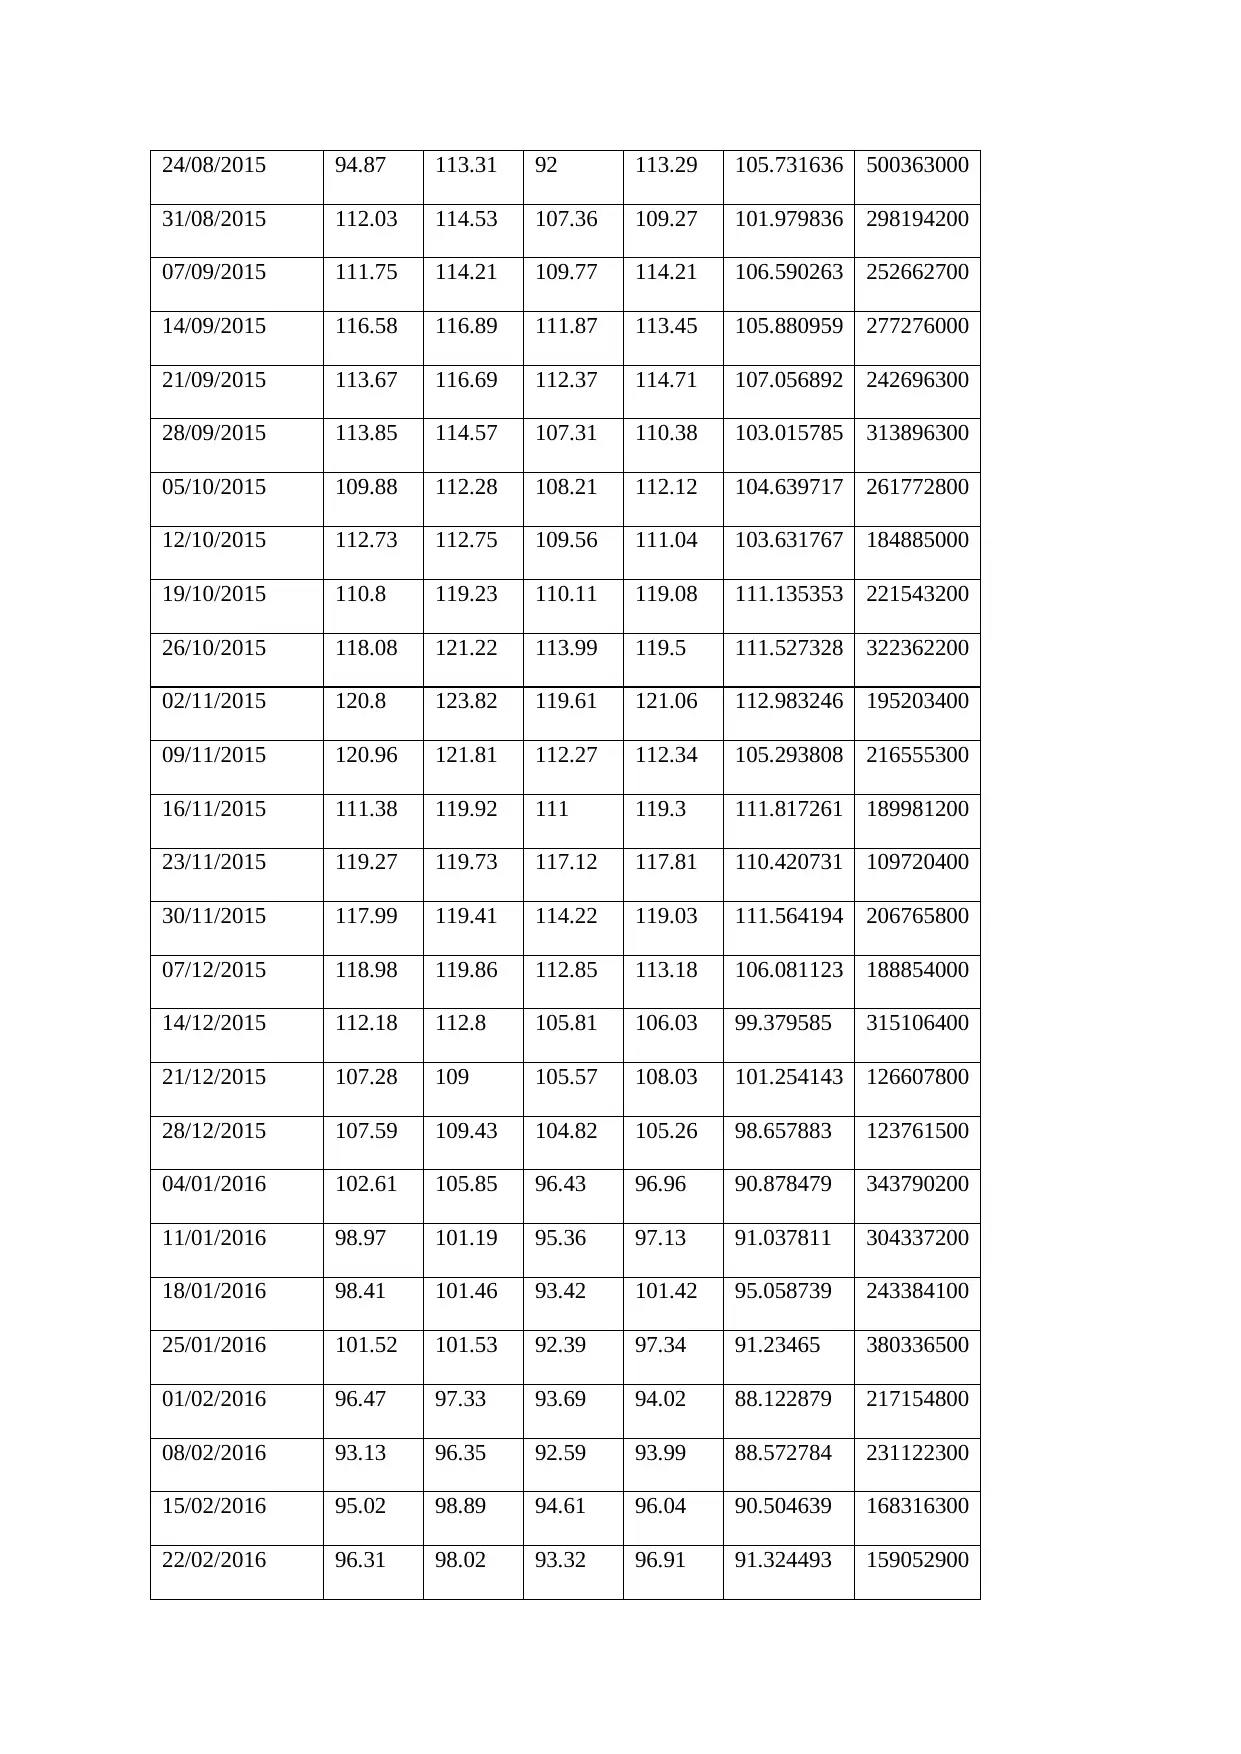
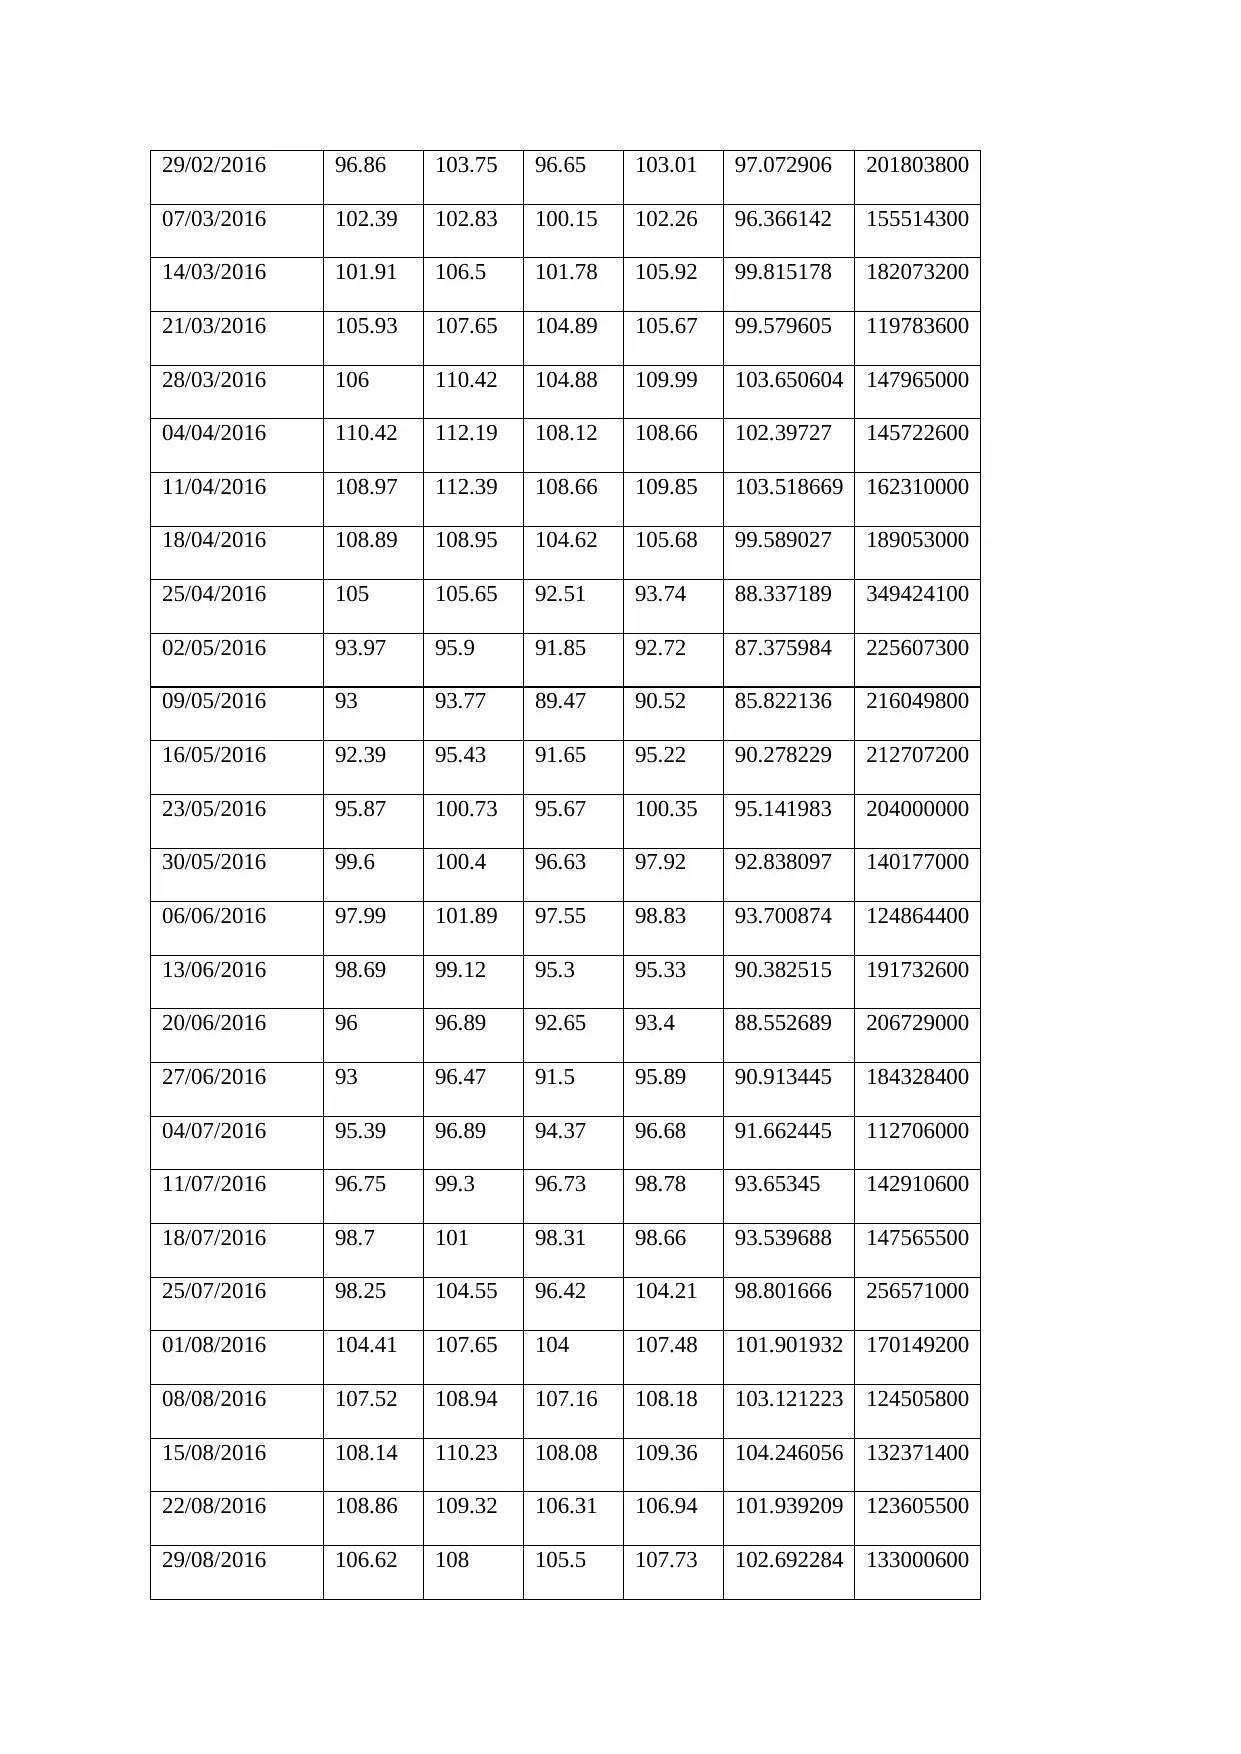
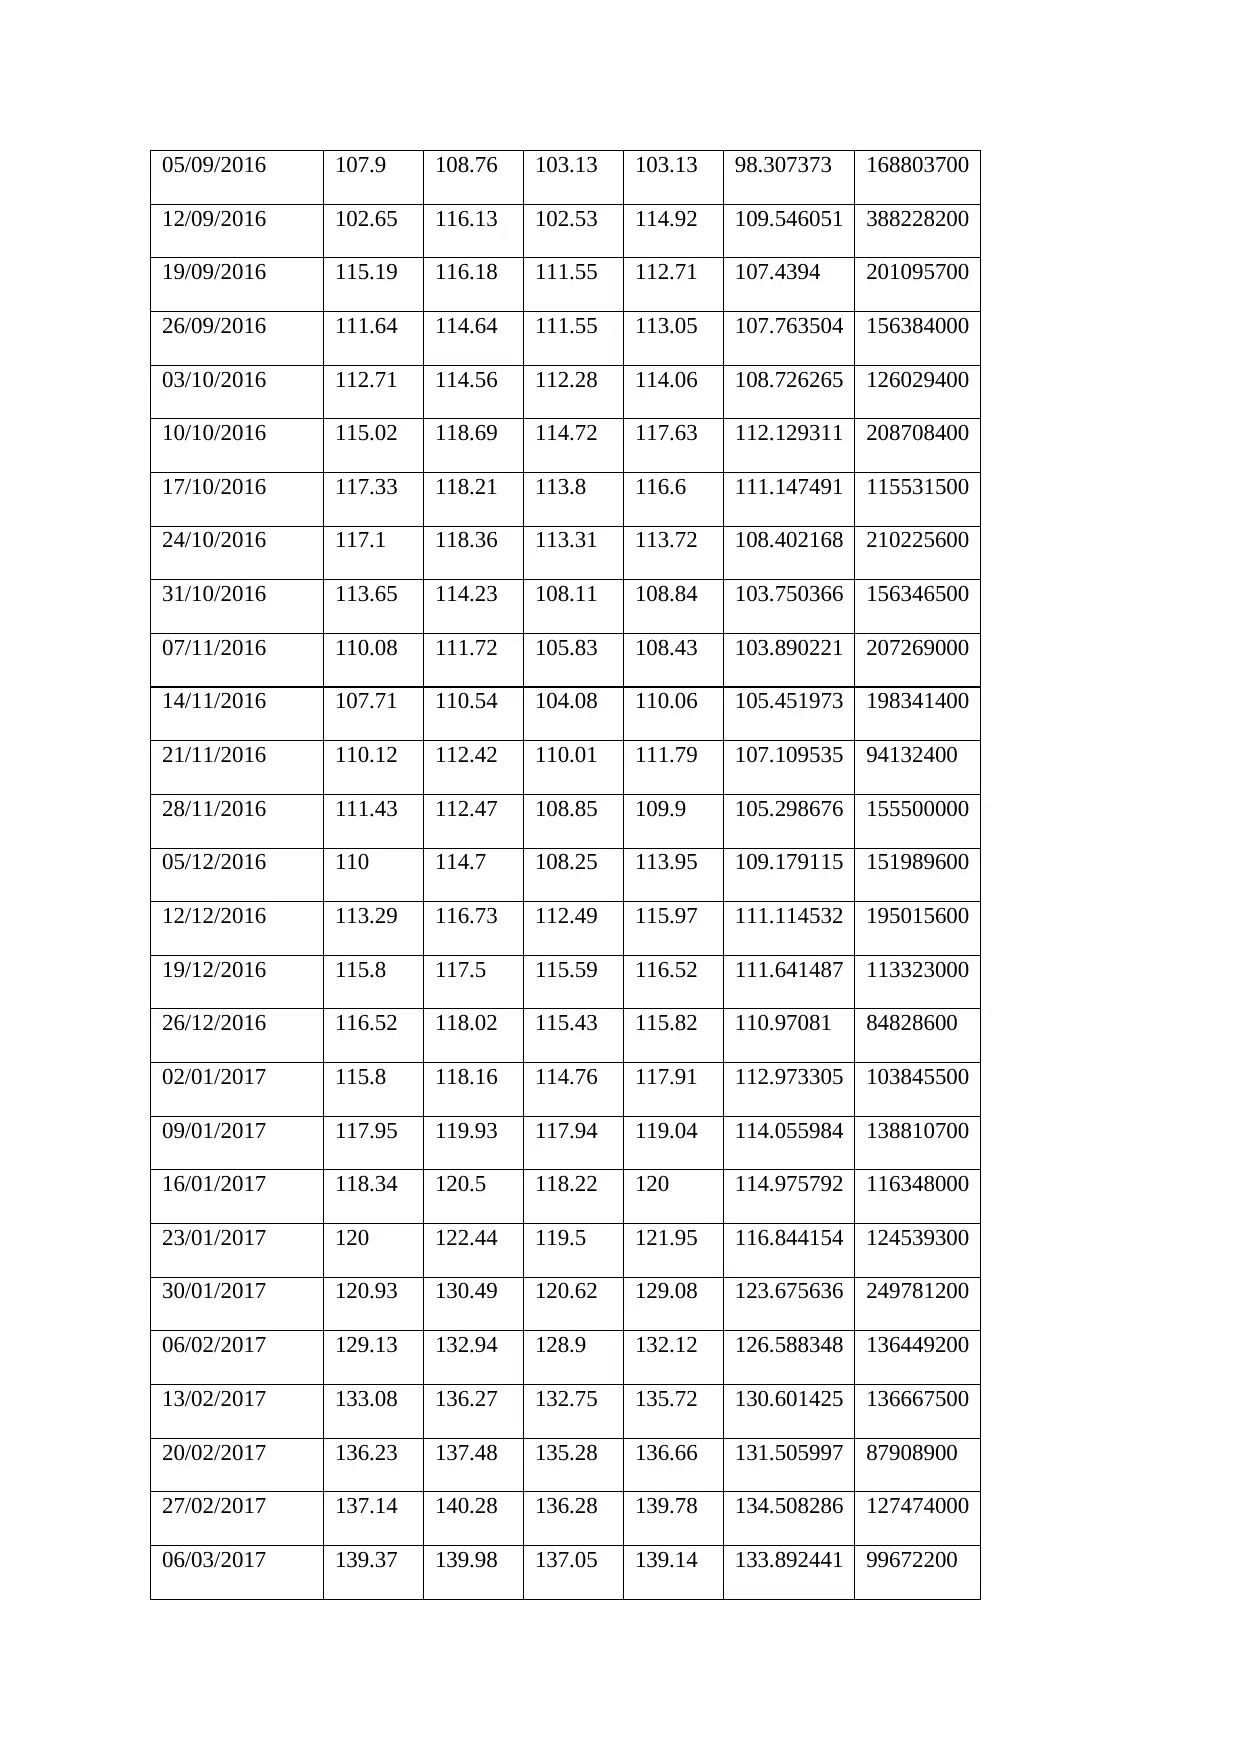
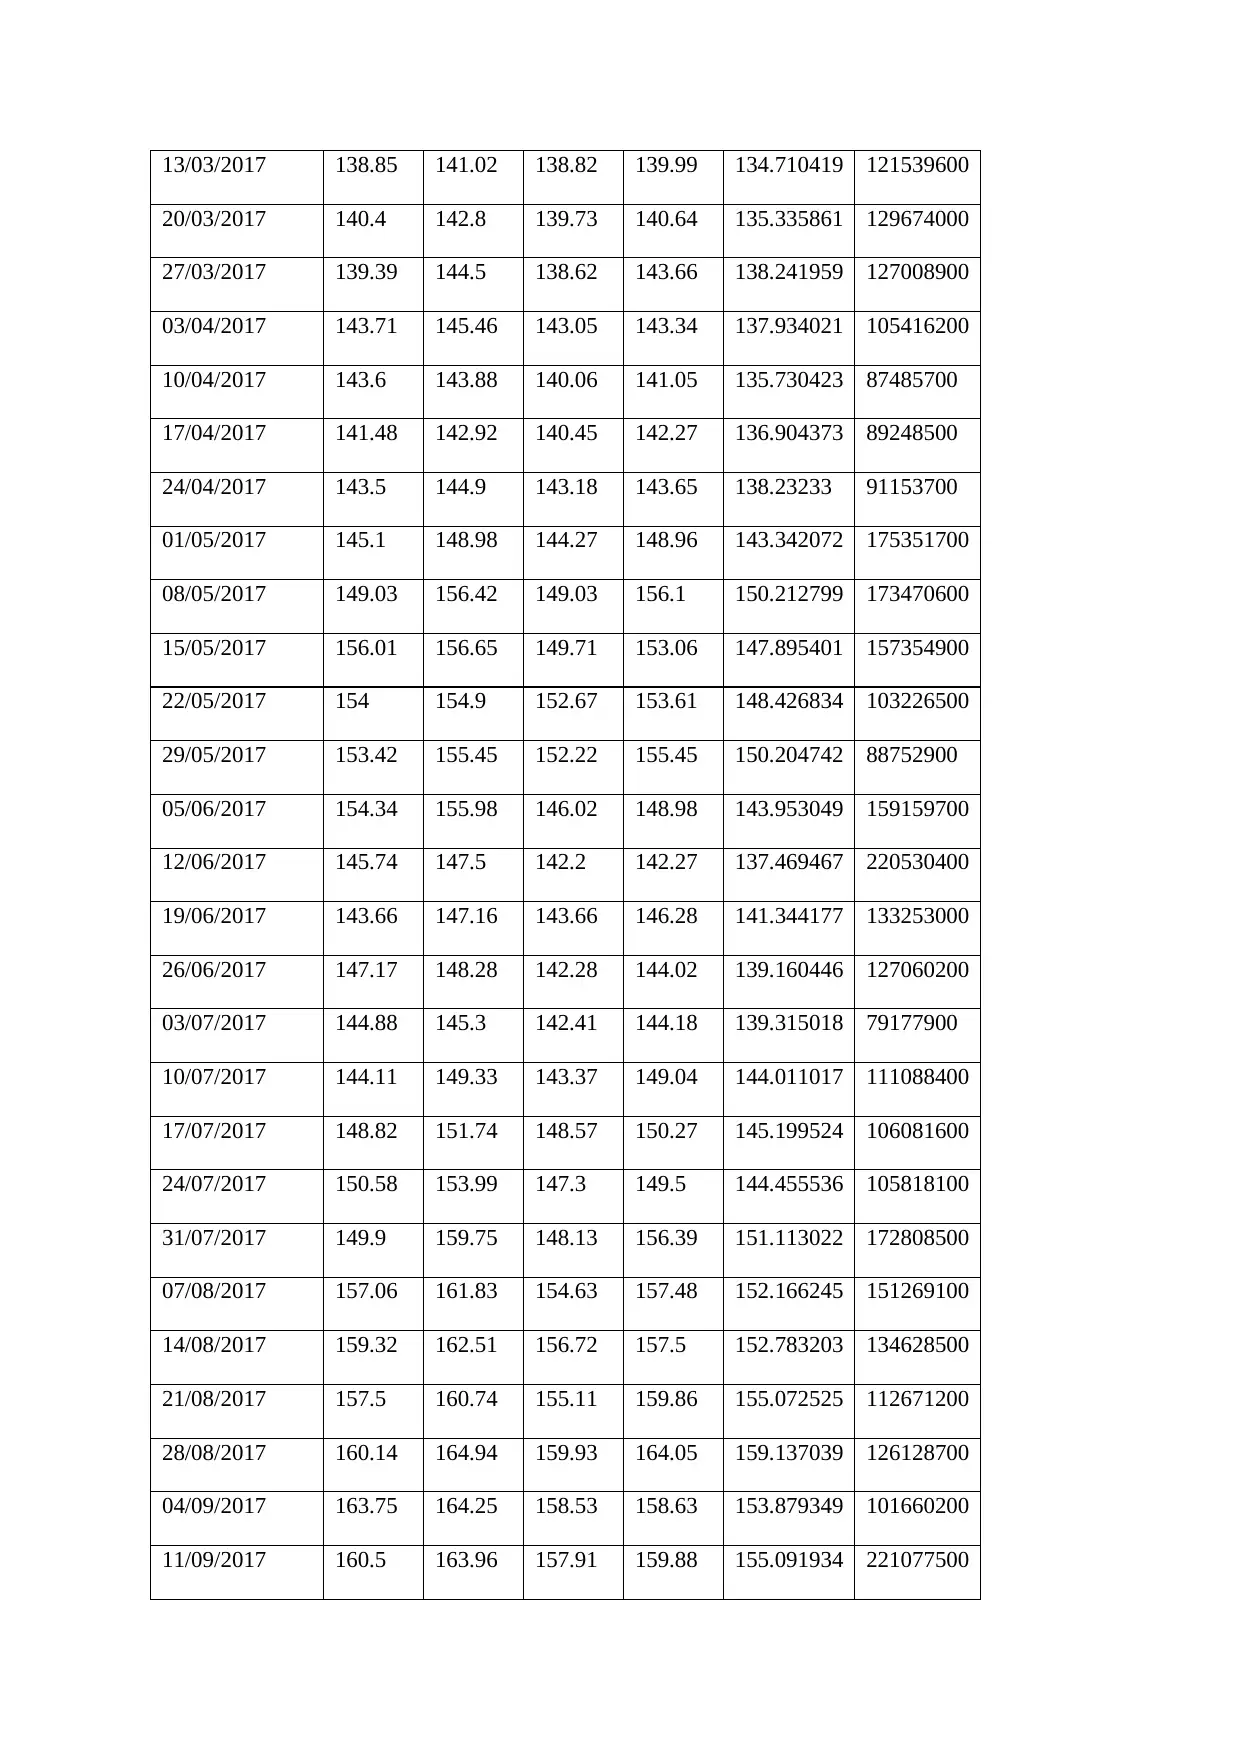
The table below shows Apples performance summary for five years.
TABLE 2
Date Open High Low Close Adj Close Volume
08/09/2014 99.3 103.08 96.14 101.66 93.282913 462051800
15/09/2014 102.81 103.05 98.89 100.96 92.640594 297352900
22/09/2014 101.8 102.94 97.72 100.75 92.447876 338824900
29/09/2014 98.65 101.54 98.04 99.62 91.411026 247749100
06/10/2014 99.95 102.38 98.31 100.73 92.429558 280258200
13/10/2014 101.33 101.78 95.18 97.67 89.621696 358539800
20/10/2014 98.32 105.49 98.22 105.22 96.549545 358532900
27/10/2014 104.85 108.04 104.7 108 99.100471 220230600
03/11/2014 108.22 110.3 107.72 109.01 100.027245 199952900
10/11/2014 109.02 114.19 108.4 114.18 105.22554 205166700
17/11/2014 114.27 117.57 113.3 116.47 107.335945 233414700
24/11/2014 116.85 119.75 116.62 118.93 109.603027 181873900
01/12/2014 118.81 119.25 111.27 115 105.981209 266589700
08/12/2014 114.1 114.85 109.35 109.73 101.124519 259868000
15/12/2014 110.7 113.24 106.26 111.78 103.013756 328856600
22/12/2014 112.16 114.52 111.97 113.99 105.05043 119396500
29/12/2014 113.79 114.77 107.35 109.33 100.755898 152088400
05/01/2015 108.29 113.25 104.63 112.01 103.225708 283252500
12/01/2015 112.6 112.8 105.2 105.99 97.677811 304226600
19/01/2015 107.84 113.75 106.5 112.98 104.119629 198737000
26/01/2015 113.74 120 109.03 117.16 107.971832 465842700
02/02/2015 118.05 120.51 116.08 118.93 109.603027 270757300
09/02/2015 118.55 127.48 118.43 127.08 117.576057 303206800
Paraphrase This Document
Need a fresh take? Get an instant paraphrase of this document with our AI Paraphraser
16/02/2015 127.49 129.5 126.92 129.5 119.815071 194354900
23/02/2015 130.02 133.6 126.61 128.46 118.852852 368216200
02/03/2015 129.25 130.28 125.76 126.6 117.131958 246938500
09/03/2015 127.96 129.57 121.63 123.59 114.347054 326514100
16/03/2015 123.88 129.25 122.87 125.9 116.484314 266672900
23/03/2015 127.12 128.04 122.6 123.25 114.032494 209326300
30/03/2015 124.05 126.49 123.1 125.32 115.947678 162031800
06/04/2015 124.47 128.12 124.33 127.1 117.594566 182207500
13/04/2015 128.37 128.57 124.46 124.75 115.420311 171186100
20/04/2015 125.57 130.63 125.17 130.28 120.536766 207440700
27/04/2015 132.31 134.54 124.58 128.95 119.306213 420972300
04/05/2015 129.5 130.57 123.36 127.62 118.075691 271892000
11/05/2015 127.39 129.49 124.82 128.77 119.637329 208301500
18/05/2015 128.38 132.97 128.36 132.54 123.139961 217297400
25/05/2015 132.6 132.91 129.12 130.28 121.040253 198148600
01/06/2015 130.28 131.39 128.36 128.65 119.525826 170840800
08/06/2015 128.9 130.18 125.62 127.17 118.15081 220114600
15/06/2015 126.1 128.31 125.71 126.6 117.621239 198525200
22/06/2015 127.49 129.8 126.51 126.75 117.760605 195594000
29/06/2015 125.46 126.94 124.48 126.44 117.472565 150981900
06/07/2015 124.94 126.23 119.22 123.28 114.536697 275718300
13/07/2015 125.03 129.62 124.32 129.62 120.427025 189244900
20/07/2015 130.97 132.97 121.99 124.5 115.670166 344269000
27/07/2015 123.09 123.91 120.91 121.3 112.697105 191598600
03/08/2015 121.5 122.57 112.1 115.52 107.327049 385000600
10/08/2015 116.53 119.99 109.63 115.96 108.223495 344717200
17/08/2015 116.04 117.65 105.65 105.76 98.704018 320509000
24/08/2015 94.87 113.31 92 113.29 105.731636 500363000
31/08/2015 112.03 114.53 107.36 109.27 101.979836 298194200
07/09/2015 111.75 114.21 109.77 114.21 106.590263 252662700
14/09/2015 116.58 116.89 111.87 113.45 105.880959 277276000
21/09/2015 113.67 116.69 112.37 114.71 107.056892 242696300
28/09/2015 113.85 114.57 107.31 110.38 103.015785 313896300
05/10/2015 109.88 112.28 108.21 112.12 104.639717 261772800
12/10/2015 112.73 112.75 109.56 111.04 103.631767 184885000
19/10/2015 110.8 119.23 110.11 119.08 111.135353 221543200
26/10/2015 118.08 121.22 113.99 119.5 111.527328 322362200
02/11/2015 120.8 123.82 119.61 121.06 112.983246 195203400
09/11/2015 120.96 121.81 112.27 112.34 105.293808 216555300
16/11/2015 111.38 119.92 111 119.3 111.817261 189981200
23/11/2015 119.27 119.73 117.12 117.81 110.420731 109720400
30/11/2015 117.99 119.41 114.22 119.03 111.564194 206765800
07/12/2015 118.98 119.86 112.85 113.18 106.081123 188854000
14/12/2015 112.18 112.8 105.81 106.03 99.379585 315106400
21/12/2015 107.28 109 105.57 108.03 101.254143 126607800
28/12/2015 107.59 109.43 104.82 105.26 98.657883 123761500
04/01/2016 102.61 105.85 96.43 96.96 90.878479 343790200
11/01/2016 98.97 101.19 95.36 97.13 91.037811 304337200
18/01/2016 98.41 101.46 93.42 101.42 95.058739 243384100
25/01/2016 101.52 101.53 92.39 97.34 91.23465 380336500
01/02/2016 96.47 97.33 93.69 94.02 88.122879 217154800
08/02/2016 93.13 96.35 92.59 93.99 88.572784 231122300
15/02/2016 95.02 98.89 94.61 96.04 90.504639 168316300
22/02/2016 96.31 98.02 93.32 96.91 91.324493 159052900
⊘ This is a preview!⊘
Do you want full access?
Subscribe today to unlock all pages.
Trusted by 1+ million students worldwide
29/02/2016 96.86 103.75 96.65 103.01 97.072906 201803800
07/03/2016 102.39 102.83 100.15 102.26 96.366142 155514300
14/03/2016 101.91 106.5 101.78 105.92 99.815178 182073200
21/03/2016 105.93 107.65 104.89 105.67 99.579605 119783600
28/03/2016 106 110.42 104.88 109.99 103.650604 147965000
04/04/2016 110.42 112.19 108.12 108.66 102.39727 145722600
11/04/2016 108.97 112.39 108.66 109.85 103.518669 162310000
18/04/2016 108.89 108.95 104.62 105.68 99.589027 189053000
25/04/2016 105 105.65 92.51 93.74 88.337189 349424100
02/05/2016 93.97 95.9 91.85 92.72 87.375984 225607300
09/05/2016 93 93.77 89.47 90.52 85.822136 216049800
16/05/2016 92.39 95.43 91.65 95.22 90.278229 212707200
23/05/2016 95.87 100.73 95.67 100.35 95.141983 204000000
30/05/2016 99.6 100.4 96.63 97.92 92.838097 140177000
06/06/2016 97.99 101.89 97.55 98.83 93.700874 124864400
13/06/2016 98.69 99.12 95.3 95.33 90.382515 191732600
20/06/2016 96 96.89 92.65 93.4 88.552689 206729000
27/06/2016 93 96.47 91.5 95.89 90.913445 184328400
04/07/2016 95.39 96.89 94.37 96.68 91.662445 112706000
11/07/2016 96.75 99.3 96.73 98.78 93.65345 142910600
18/07/2016 98.7 101 98.31 98.66 93.539688 147565500
25/07/2016 98.25 104.55 96.42 104.21 98.801666 256571000
01/08/2016 104.41 107.65 104 107.48 101.901932 170149200
08/08/2016 107.52 108.94 107.16 108.18 103.121223 124505800
15/08/2016 108.14 110.23 108.08 109.36 104.246056 132371400
22/08/2016 108.86 109.32 106.31 106.94 101.939209 123605500
29/08/2016 106.62 108 105.5 107.73 102.692284 133000600
Paraphrase This Document
Need a fresh take? Get an instant paraphrase of this document with our AI Paraphraser
05/09/2016 107.9 108.76 103.13 103.13 98.307373 168803700
12/09/2016 102.65 116.13 102.53 114.92 109.546051 388228200
19/09/2016 115.19 116.18 111.55 112.71 107.4394 201095700
26/09/2016 111.64 114.64 111.55 113.05 107.763504 156384000
03/10/2016 112.71 114.56 112.28 114.06 108.726265 126029400
10/10/2016 115.02 118.69 114.72 117.63 112.129311 208708400
17/10/2016 117.33 118.21 113.8 116.6 111.147491 115531500
24/10/2016 117.1 118.36 113.31 113.72 108.402168 210225600
31/10/2016 113.65 114.23 108.11 108.84 103.750366 156346500
07/11/2016 110.08 111.72 105.83 108.43 103.890221 207269000
14/11/2016 107.71 110.54 104.08 110.06 105.451973 198341400
21/11/2016 110.12 112.42 110.01 111.79 107.109535 94132400
28/11/2016 111.43 112.47 108.85 109.9 105.298676 155500000
05/12/2016 110 114.7 108.25 113.95 109.179115 151989600
12/12/2016 113.29 116.73 112.49 115.97 111.114532 195015600
19/12/2016 115.8 117.5 115.59 116.52 111.641487 113323000
26/12/2016 116.52 118.02 115.43 115.82 110.97081 84828600
02/01/2017 115.8 118.16 114.76 117.91 112.973305 103845500
09/01/2017 117.95 119.93 117.94 119.04 114.055984 138810700
16/01/2017 118.34 120.5 118.22 120 114.975792 116348000
23/01/2017 120 122.44 119.5 121.95 116.844154 124539300
30/01/2017 120.93 130.49 120.62 129.08 123.675636 249781200
06/02/2017 129.13 132.94 128.9 132.12 126.588348 136449200
13/02/2017 133.08 136.27 132.75 135.72 130.601425 136667500
20/02/2017 136.23 137.48 135.28 136.66 131.505997 87908900
27/02/2017 137.14 140.28 136.28 139.78 134.508286 127474000
06/03/2017 139.37 139.98 137.05 139.14 133.892441 99672200
13/03/2017 138.85 141.02 138.82 139.99 134.710419 121539600
20/03/2017 140.4 142.8 139.73 140.64 135.335861 129674000
27/03/2017 139.39 144.5 138.62 143.66 138.241959 127008900
03/04/2017 143.71 145.46 143.05 143.34 137.934021 105416200
10/04/2017 143.6 143.88 140.06 141.05 135.730423 87485700
17/04/2017 141.48 142.92 140.45 142.27 136.904373 89248500
24/04/2017 143.5 144.9 143.18 143.65 138.23233 91153700
01/05/2017 145.1 148.98 144.27 148.96 143.342072 175351700
08/05/2017 149.03 156.42 149.03 156.1 150.212799 173470600
15/05/2017 156.01 156.65 149.71 153.06 147.895401 157354900
22/05/2017 154 154.9 152.67 153.61 148.426834 103226500
29/05/2017 153.42 155.45 152.22 155.45 150.204742 88752900
05/06/2017 154.34 155.98 146.02 148.98 143.953049 159159700
12/06/2017 145.74 147.5 142.2 142.27 137.469467 220530400
19/06/2017 143.66 147.16 143.66 146.28 141.344177 133253000
26/06/2017 147.17 148.28 142.28 144.02 139.160446 127060200
03/07/2017 144.88 145.3 142.41 144.18 139.315018 79177900
10/07/2017 144.11 149.33 143.37 149.04 144.011017 111088400
17/07/2017 148.82 151.74 148.57 150.27 145.199524 106081600
24/07/2017 150.58 153.99 147.3 149.5 144.455536 105818100
31/07/2017 149.9 159.75 148.13 156.39 151.113022 172808500
07/08/2017 157.06 161.83 154.63 157.48 152.166245 151269100
14/08/2017 159.32 162.51 156.72 157.5 152.783203 134628500
21/08/2017 157.5 160.74 155.11 159.86 155.072525 112671200
28/08/2017 160.14 164.94 159.93 164.05 159.137039 126128700
04/09/2017 163.75 164.25 158.53 158.63 153.879349 101660200
11/09/2017 160.5 163.96 157.91 159.88 155.091934 221077500
⊘ This is a preview!⊘
Do you want full access?
Subscribe today to unlock all pages.
Trusted by 1+ million students worldwide
1 out of 22
Related Documents


Your All-in-One AI-Powered Toolkit for Academic Success.
+13062052269
info@desklib.com
Available 24*7 on WhatsApp / Email
![[object Object]](/_next/static/media/star-bottom.7253800d.svg)
Unlock your academic potential
Copyright © 2020–2025 A2Z Services. All Rights Reserved. Developed and managed by ZUCOL.