WaveRider Accounting Report: Financial Analysis and Evaluation
VerifiedAdded on 2023/04/22
|8
|1561
|259
Report
AI Summary
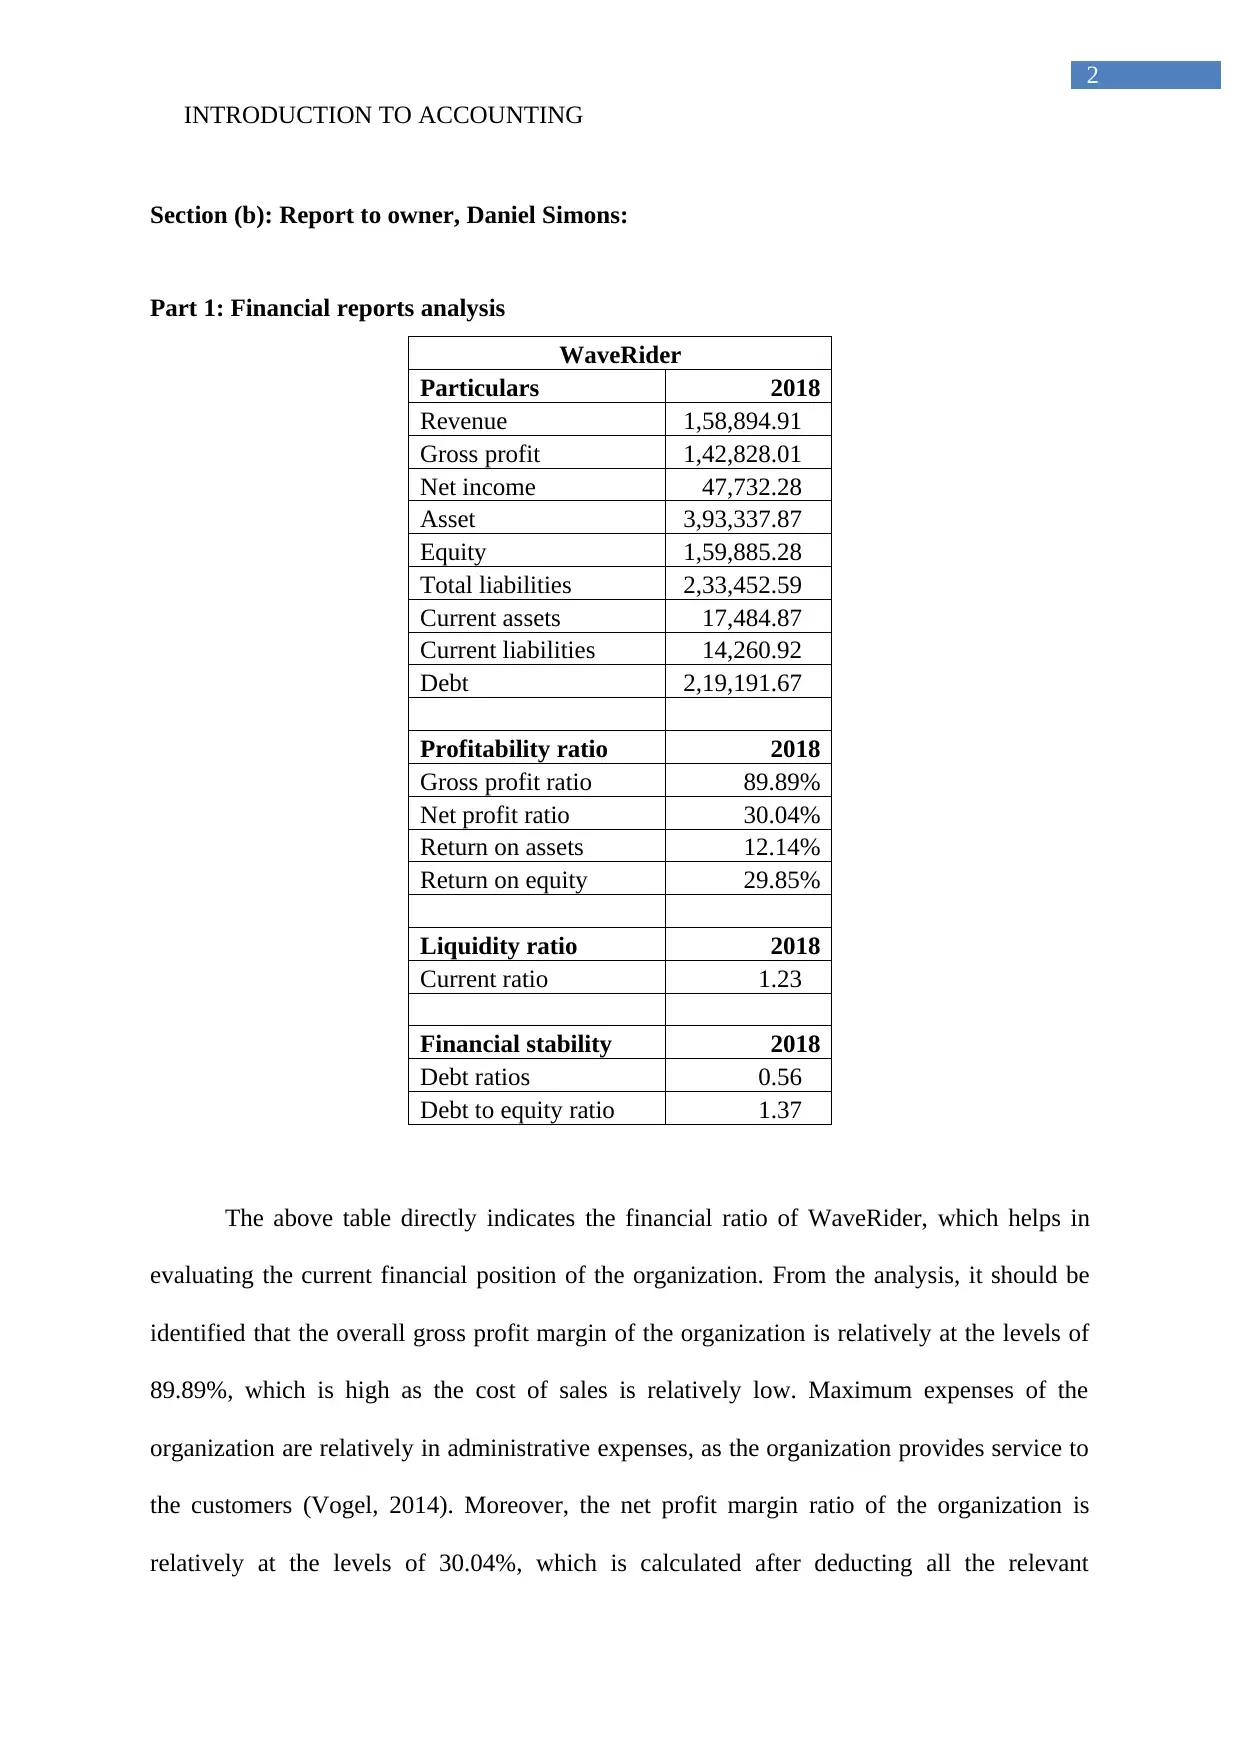
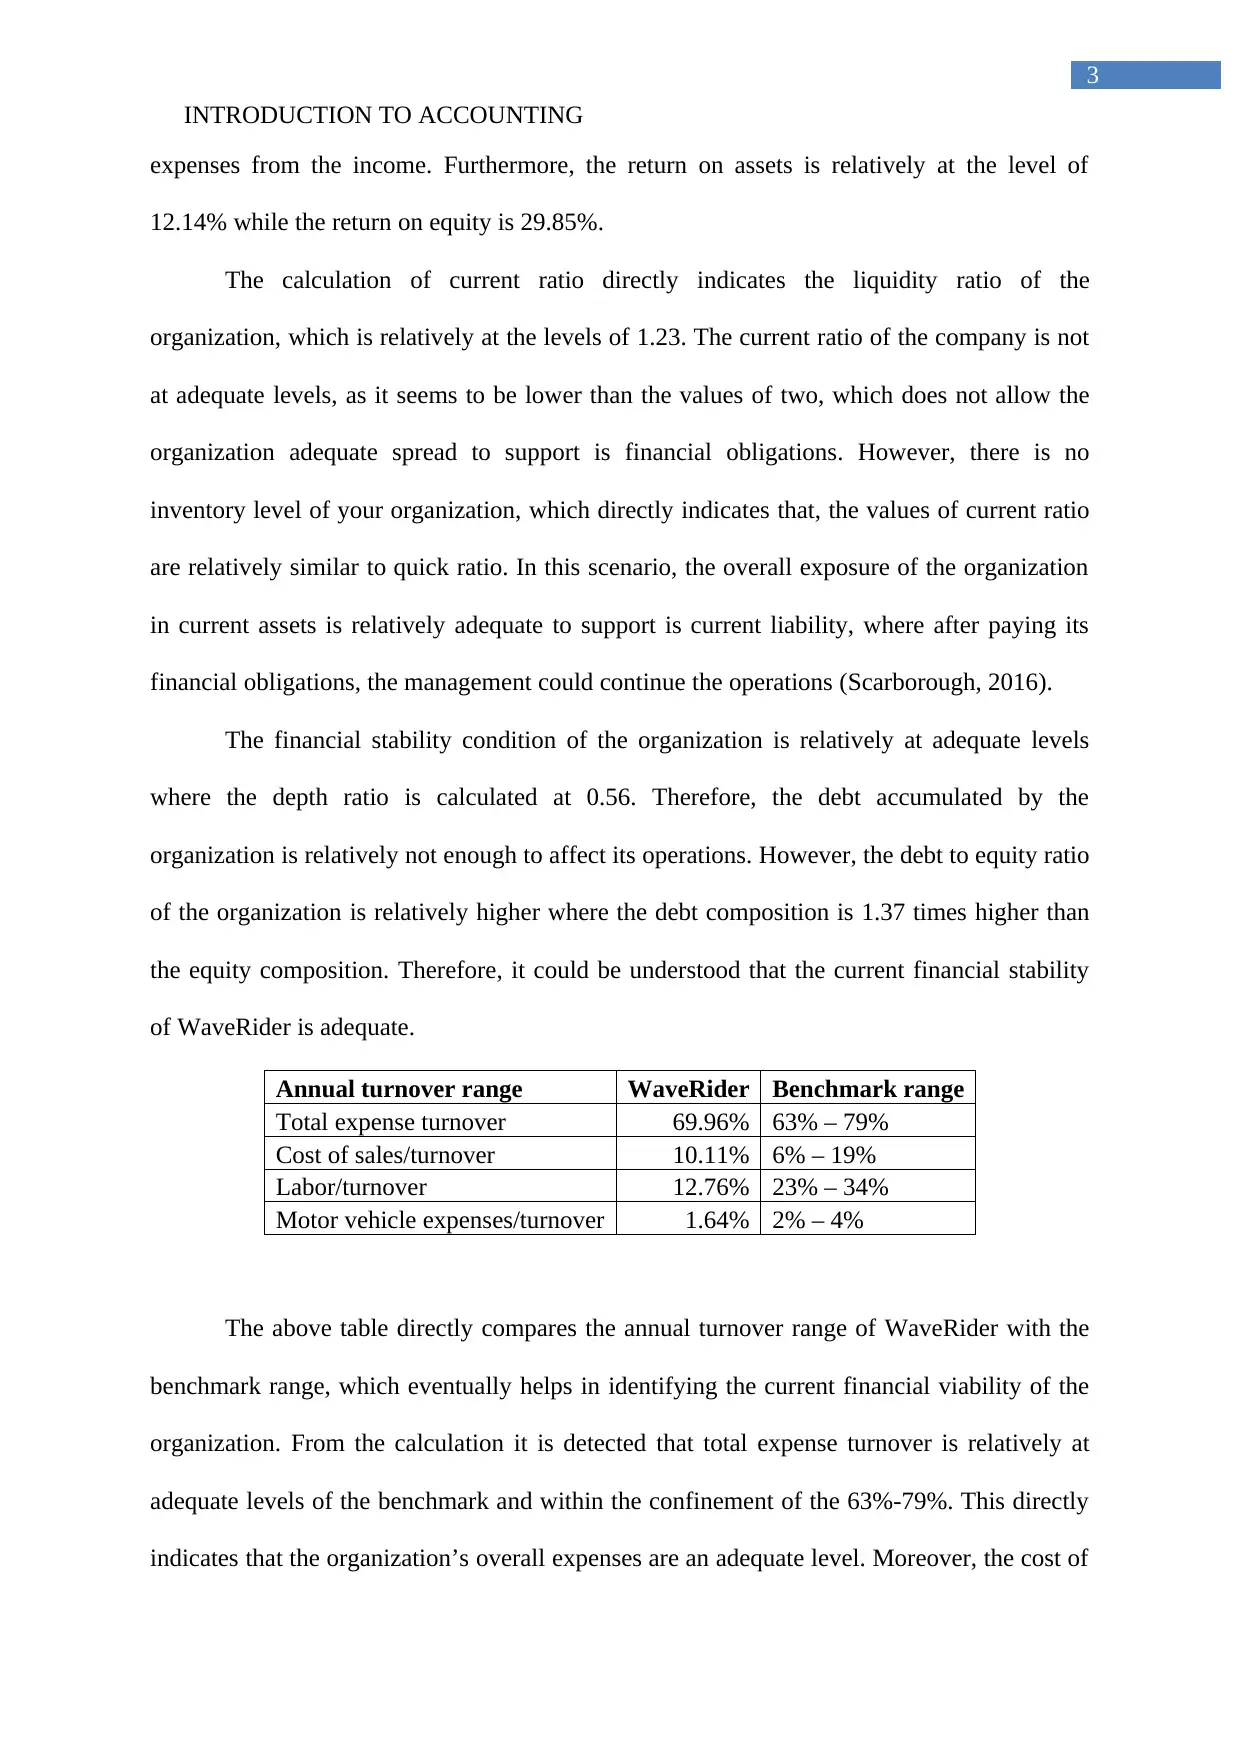
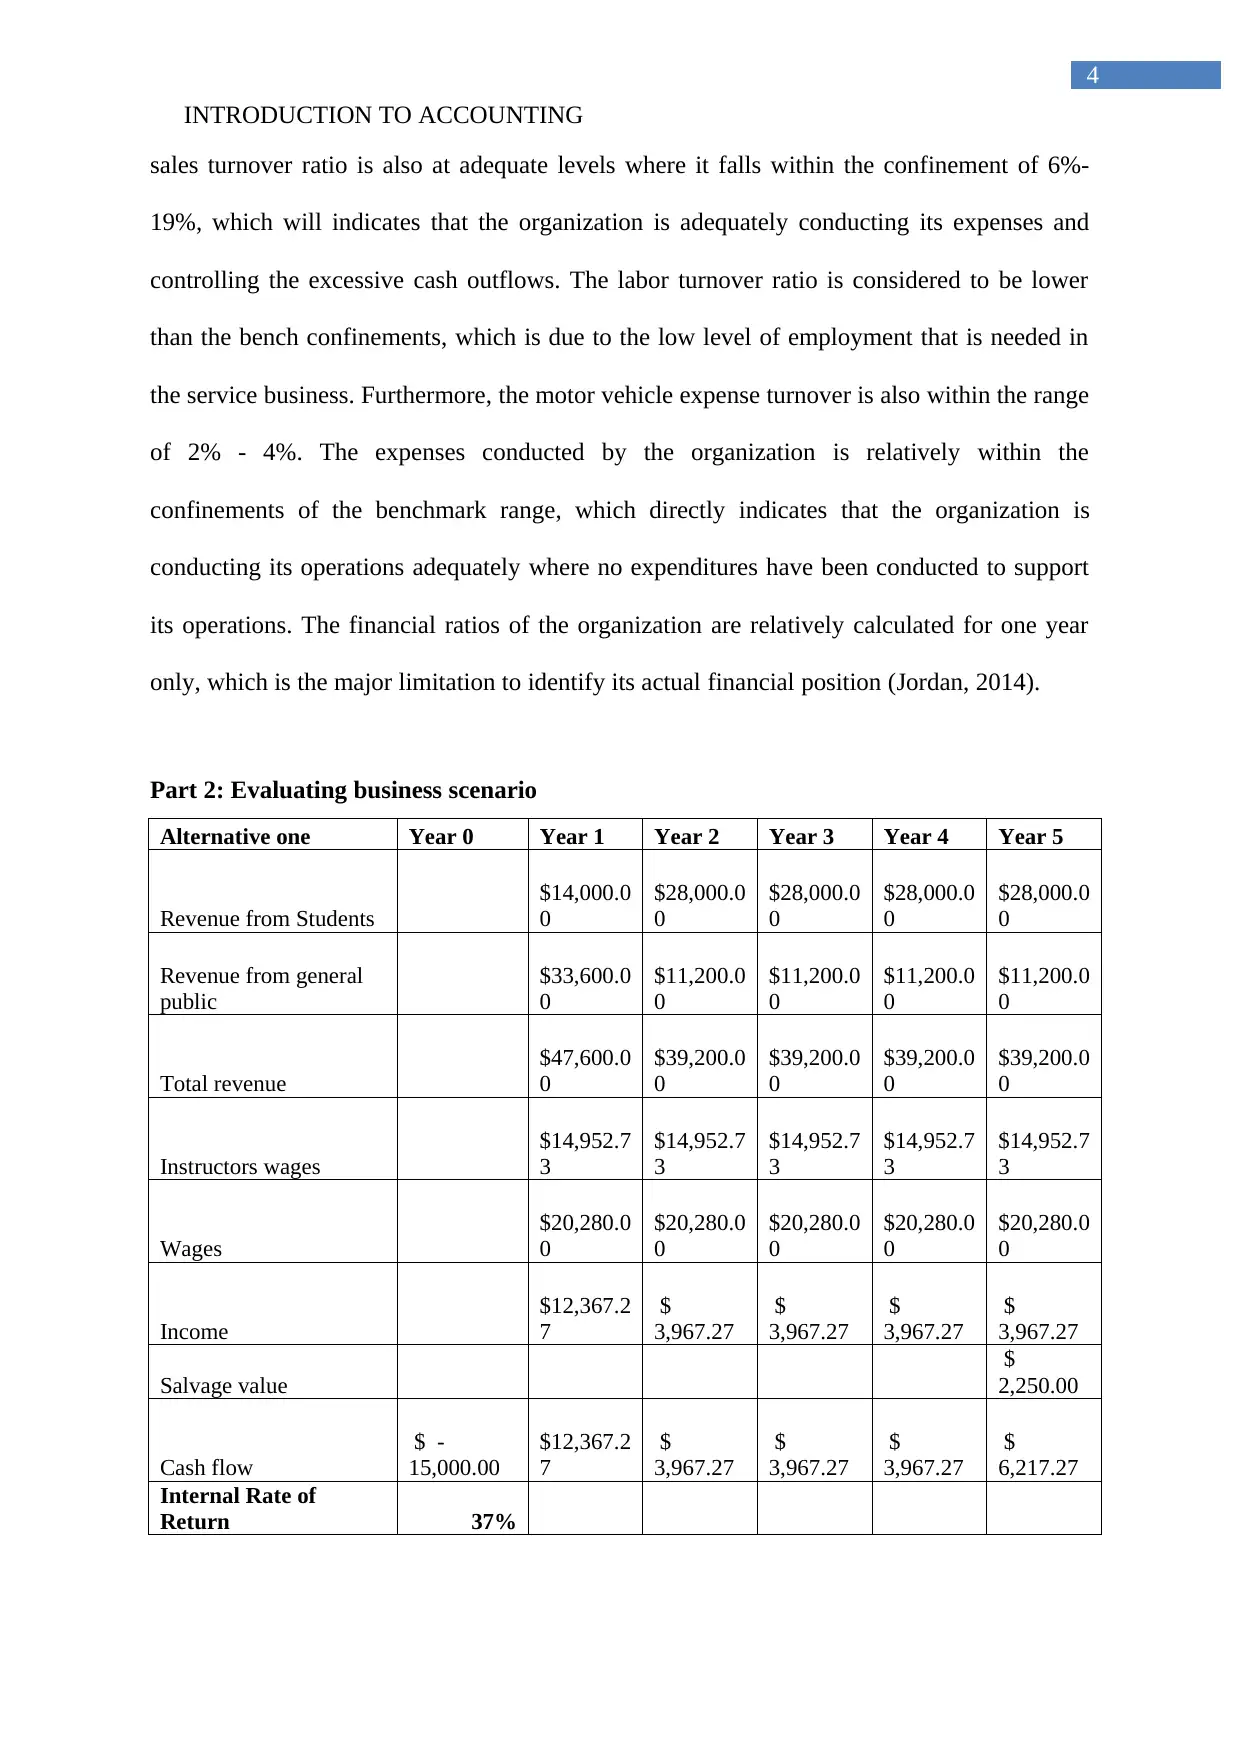
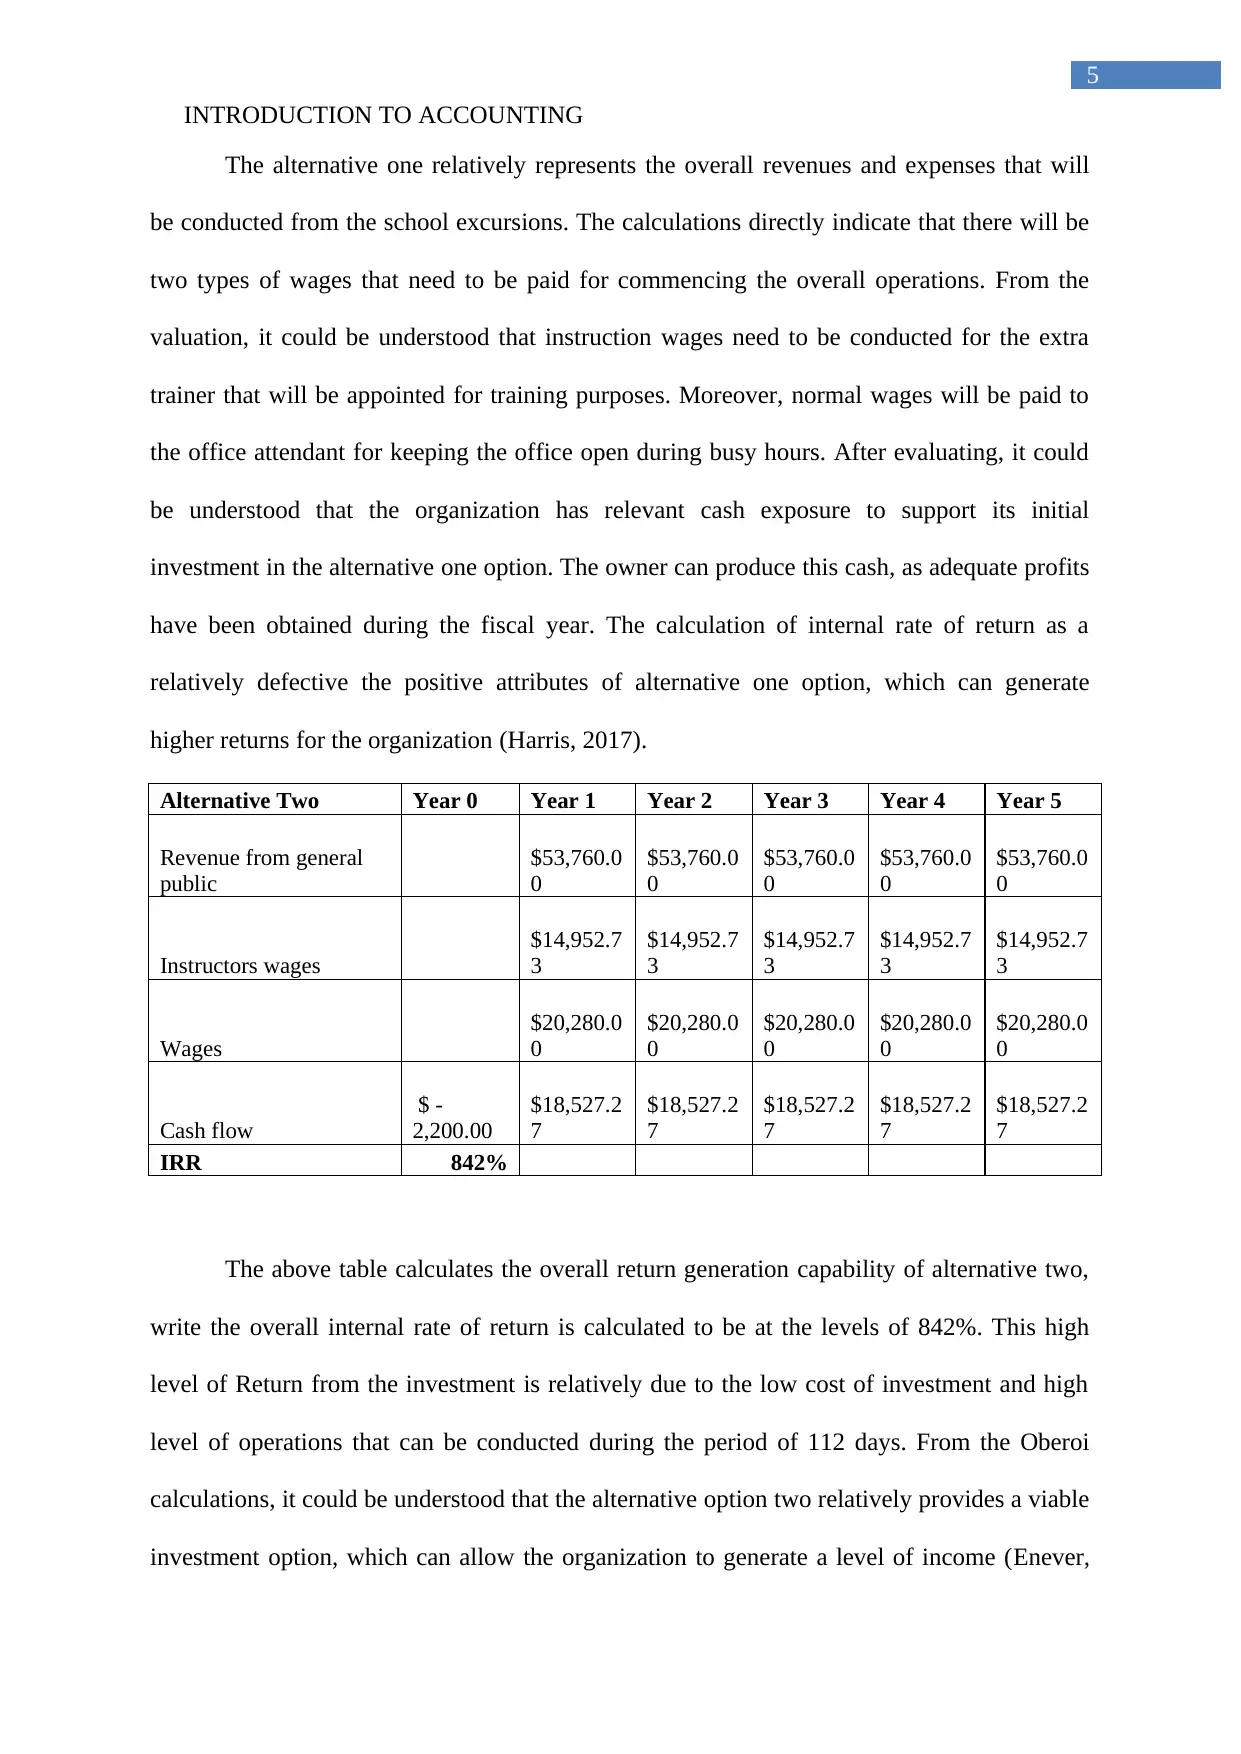
This report presents a financial analysis of WaveRider, a small service business, based on its 2018 financial data. It evaluates the company's profitability, liquidity, and financial stability using various ratios such as gross profit ratio, net profit ratio, current ratio, and debt-to-equity ratio. The report als...

Running head: INTRODUCTION TO ACCOUNTING
Introduction to Accounting
Name of the Student:
Name of the University:
Authors Note:
Introduction to Accounting
Name of the Student:
Name of the University:
Authors Note:
Paraphrase This Document
Need a fresh take? Get an instant paraphrase of this document with our AI Paraphraser

INTRODUCTION TO ACCOUNTING
1
Table of Contents
Section (b): Report to owner, Daniel Simons:...........................................................................2
Part 1: Financial reports analysis...............................................................................................2
Part 2: Evaluating business scenario..........................................................................................4
Reference and Bibliography:......................................................................................................7

INTRODUCTION TO ACCOUNTING
2
Section (b): Report to owner, Daniel Simons:
Part 1: Financial reports analysis
WaveRider
Particulars 2018
Revenue 1,58,894.91
Gross profit 1,42,828.01
Net income 47,732.28
Asset 3,93,337.87
Equity 1,59,885.28
Total liabilities 2,33,452.59
Current assets 17,484.87
Current liabilities 14,260.92
Debt 2,19,191.67
Profitability ratio 2018
Gross profit ratio 89.89%
Net profit ratio 30.04%
Return on assets 12.14%
Return on equity 29.85%
Liquidity ratio 2018
Current ratio 1.23
Financial stability 2018
Debt ratios 0.56
Debt to equity ratio 1.37
The above table directly indicates the financial ratio of WaveRider, which helps in
evaluating the current financial position of the organization. From the analysis, it should be
identified that the overall gross profit margin of the organization is relatively at the levels of
89.89%, which is high as the cost of sales is relatively low. Maximum expenses of the
organization are relatively in administrative expenses, as the organization provides service to
the customers (Vogel, 2014). Moreover, the net profit margin ratio of the organization is
relatively at the levels of 30.04%, which is calculated after deducting all the relevant
⊘ This is a preview!⊘
Do you want full access?
Subscribe today to unlock all pages.

Trusted by 1+ million students worldwide

INTRODUCTION TO ACCOUNTING
3
expenses from the income. Furthermore, the return on assets is relatively at the level of
12.14% while the return on equity is 29.85%.
The calculation of current ratio directly indicates the liquidity ratio of the
organization, which is relatively at the levels of 1.23. The current ratio of the company is not
at adequate levels, as it seems to be lower than the values of two, which does not allow the
organization adequate spread to support is financial obligations. However, there is no
inventory level of your organization, which directly indicates that, the values of current ratio
are relatively similar to quick ratio. In this scenario, the overall exposure of the organization
in current assets is relatively adequate to support is current liability, where after paying its
financial obligations, the management could continue the operations (Scarborough, 2016).
The financial stability condition of the organization is relatively at adequate levels
where the depth ratio is calculated at 0.56. Therefore, the debt accumulated by the
organization is relatively not enough to affect its operations. However, the debt to equity ratio
of the organization is relatively higher where the debt composition is 1.37 times higher than
the equity composition. Therefore, it could be understood that the current financial stability
of WaveRider is adequate.
Annual turnover range WaveRider Benchmark range
Total expense turnover 69.96% 63% – 79%
Cost of sales/turnover 10.11% 6% – 19%
Labor/turnover 12.76% 23% – 34%
Motor vehicle expenses/turnover 1.64% 2% – 4%
The above table directly compares the annual turnover range of WaveRider with the
benchmark range, which eventually helps in identifying the current financial viability of the
organization. From the calculation it is detected that total expense turnover is relatively at
adequate levels of the benchmark and within the confinement of the 63%-79%. This directly
indicates that the organization’s overall expenses are an adequate level. Moreover, the cost of
Paraphrase This Document
Need a fresh take? Get an instant paraphrase of this document with our AI Paraphraser

INTRODUCTION TO ACCOUNTING
4
sales turnover ratio is also at adequate levels where it falls within the confinement of 6%-
19%, which will indicates that the organization is adequately conducting its expenses and
controlling the excessive cash outflows. The labor turnover ratio is considered to be lower
than the bench confinements, which is due to the low level of employment that is needed in
the service business. Furthermore, the motor vehicle expense turnover is also within the range
of 2% - 4%. The expenses conducted by the organization is relatively within the
confinements of the benchmark range, which directly indicates that the organization is
conducting its operations adequately where no expenditures have been conducted to support
its operations. The financial ratios of the organization are relatively calculated for one year
only, which is the major limitation to identify its actual financial position (Jordan, 2014).
Part 2: Evaluating business scenario
Alternative one Year 0 Year 1 Year 2 Year 3 Year 4 Year 5
Revenue from Students
$14,000.0
0
$28,000.0
0
$28,000.0
0
$28,000.0
0
$28,000.0
0
Revenue from general
public
$33,600.0
0
$11,200.0
0
$11,200.0
0
$11,200.0
0
$11,200.0
0
Total revenue
$47,600.0
0
$39,200.0
0
$39,200.0
0
$39,200.0
0
$39,200.0
0
Instructors wages
$14,952.7
3
$14,952.7
3
$14,952.7
3
$14,952.7
3
$14,952.7
3
Wages
$20,280.0
0
$20,280.0
0
$20,280.0
0
$20,280.0
0
$20,280.0
0
Income
$12,367.2
7
$
3,967.27
$
3,967.27
$
3,967.27
$
3,967.27
Salvage value
$
2,250.00
Cash flow
$ -
15,000.00
$12,367.2
7
$
3,967.27
$
3,967.27
$
3,967.27
$
6,217.27
Internal Rate of
Return 37%

INTRODUCTION TO ACCOUNTING
5
The alternative one relatively represents the overall revenues and expenses that will
be conducted from the school excursions. The calculations directly indicate that there will be
two types of wages that need to be paid for commencing the overall operations. From the
valuation, it could be understood that instruction wages need to be conducted for the extra
trainer that will be appointed for training purposes. Moreover, normal wages will be paid to
the office attendant for keeping the office open during busy hours. After evaluating, it could
be understood that the organization has relevant cash exposure to support its initial
investment in the alternative one option. The owner can produce this cash, as adequate profits
have been obtained during the fiscal year. The calculation of internal rate of return as a
relatively defective the positive attributes of alternative one option, which can generate
higher returns for the organization (Harris, 2017).
Alternative Two Year 0 Year 1 Year 2 Year 3 Year 4 Year 5
Revenue from general
public
$53,760.0
0
$53,760.0
0
$53,760.0
0
$53,760.0
0
$53,760.0
0
Instructors wages
$14,952.7
3
$14,952.7
3
$14,952.7
3
$14,952.7
3
$14,952.7
3
Wages
$20,280.0
0
$20,280.0
0
$20,280.0
0
$20,280.0
0
$20,280.0
0
Cash flow
$ -
2,200.00
$18,527.2
7
$18,527.2
7
$18,527.2
7
$18,527.2
7
$18,527.2
7
IRR 842%
The above table calculates the overall return generation capability of alternative two,
write the overall internal rate of return is calculated to be at the levels of 842%. This high
level of Return from the investment is relatively due to the low cost of investment and high
level of operations that can be conducted during the period of 112 days. From the Oberoi
calculations, it could be understood that the alternative option two relatively provides a viable
investment option, which can allow the organization to generate a level of income (Enever,
⊘ This is a preview!⊘
Do you want full access?
Subscribe today to unlock all pages.

Trusted by 1+ million students worldwide

INTRODUCTION TO ACCOUNTING
6
Isaac & Daley, 2014). Currently the organization has adequate cash flow to support both the
alternative 1 and alternative 2, which can eventually help in generating adequate returns in
the long run.
6
Isaac & Daley, 2014). Currently the organization has adequate cash flow to support both the
alternative 1 and alternative 2, which can eventually help in generating adequate returns in
the long run.
Paraphrase This Document
Need a fresh take? Get an instant paraphrase of this document with our AI Paraphraser

INTRODUCTION TO ACCOUNTING
7
Reference and Bibliography:
Baum, A. E., & Crosby, N. (2014). Property investment appraisal. John Wiley & Sons.
Enever, N., Isaac, D., & Daley, M. (2014). The valuation of property investments. Estates
Gazette.
Harris, E. (2017). Strategic project risk appraisal and management. Routledge.
Jordan, B. (2014). Fundamentals of investments. McGraw-Hill Higher Education.
Omar, N., Koya, R. K., Sanusi, Z. M., & Shafie, N. A. (2014). Financial statement fraud: A
case examination using Beneish Model and ratio analysis. International Journal of
Trade, Economics and Finance, 5(2), 184.
Penning-Rowsell, E., Priest, S., Parker, D., Morris, J., Tunstall, S., Viavattene, C., ... &
Owen, D. (2014). Flood and coastal erosion risk management: a manual for
economic appraisal. Routledge.
Scarborough, N. M. (2016). Essentials of entrepreneurship and small business management.
Pearson.
Vogel, H. L. (2014). Entertainment industry economics: A guide for financial analysis.
Cambridge University Press.
1 out of 8
Related Documents

Your All-in-One AI-Powered Toolkit for Academic Success.
+13062052269
info@desklib.com
Available 24*7 on WhatsApp / Email
Unlock your academic potential
© 2024 | Zucol Services PVT LTD | All rights reserved.