Financial Statement Analysis and Evaluation Report, Semester 1

Verified

Added on  2019/09/13

|8
|1103
|320
Report
AI Summary
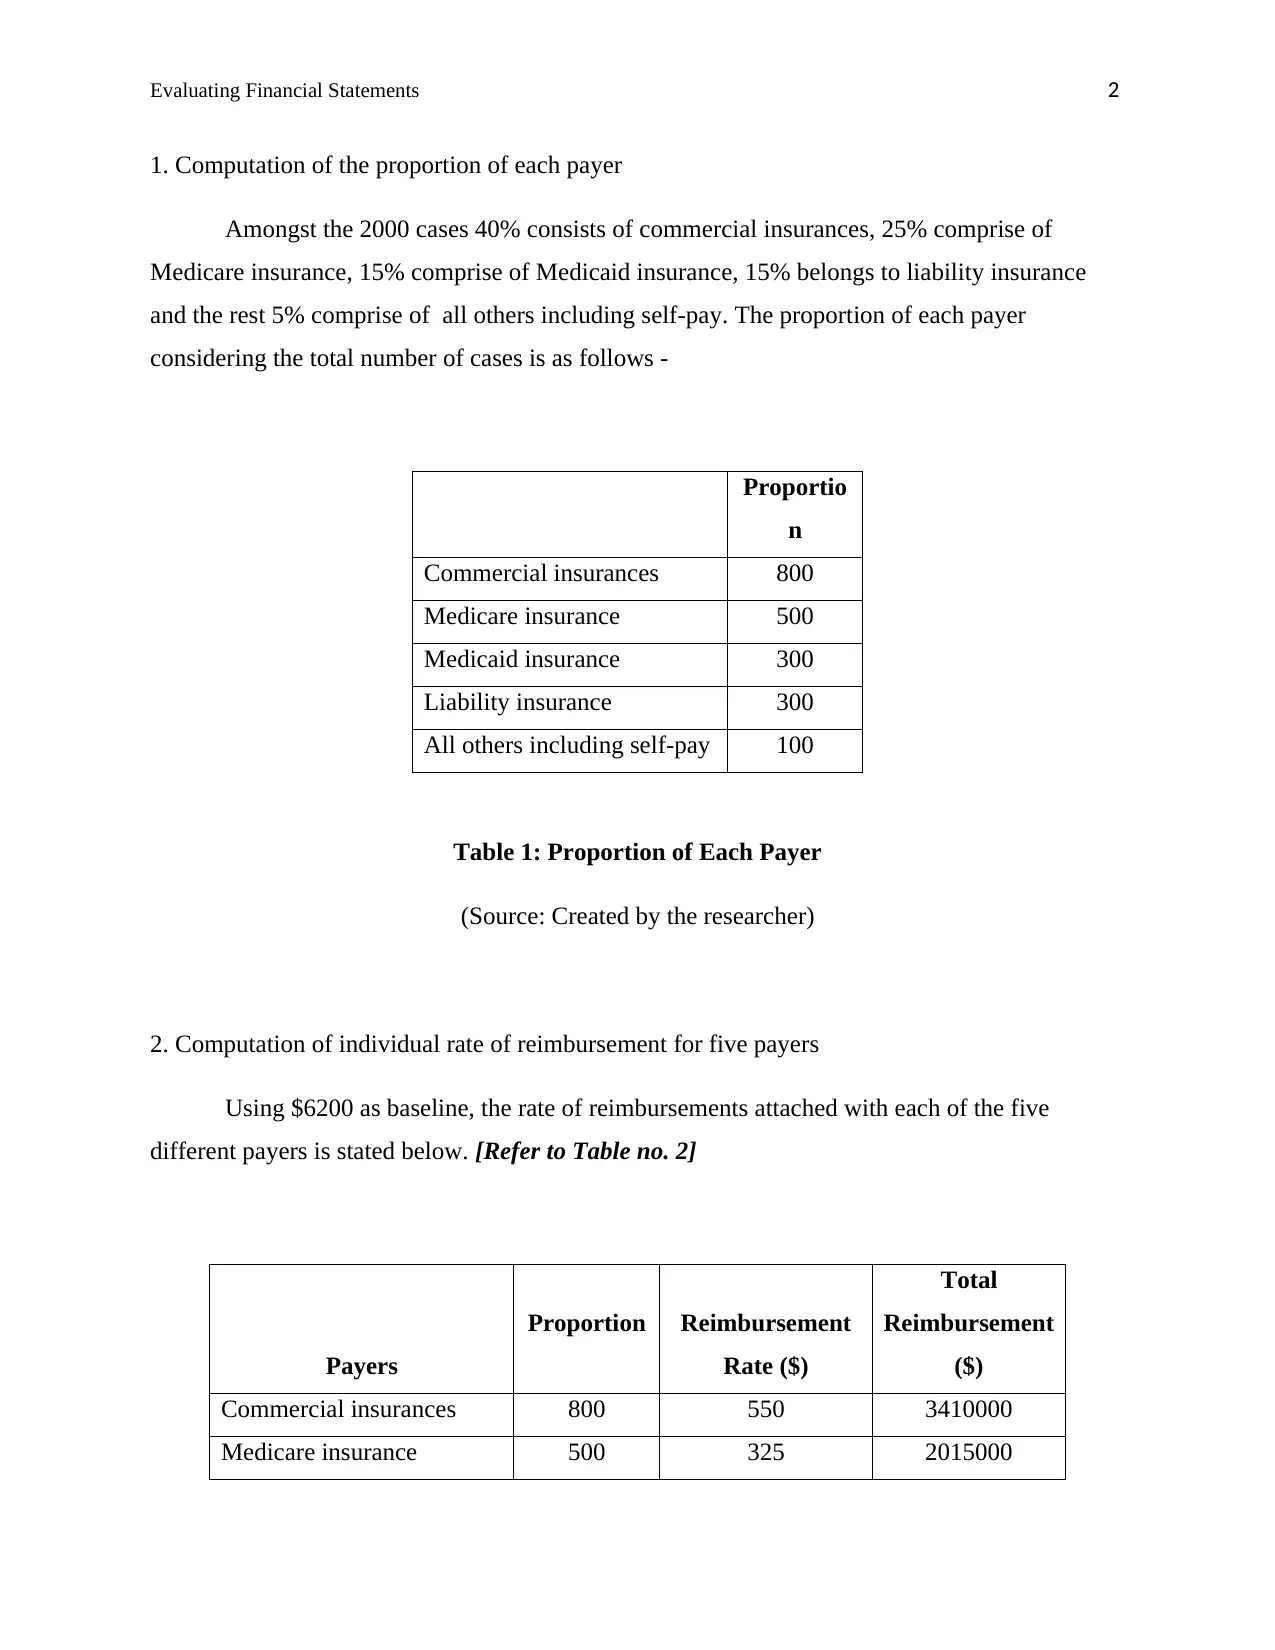
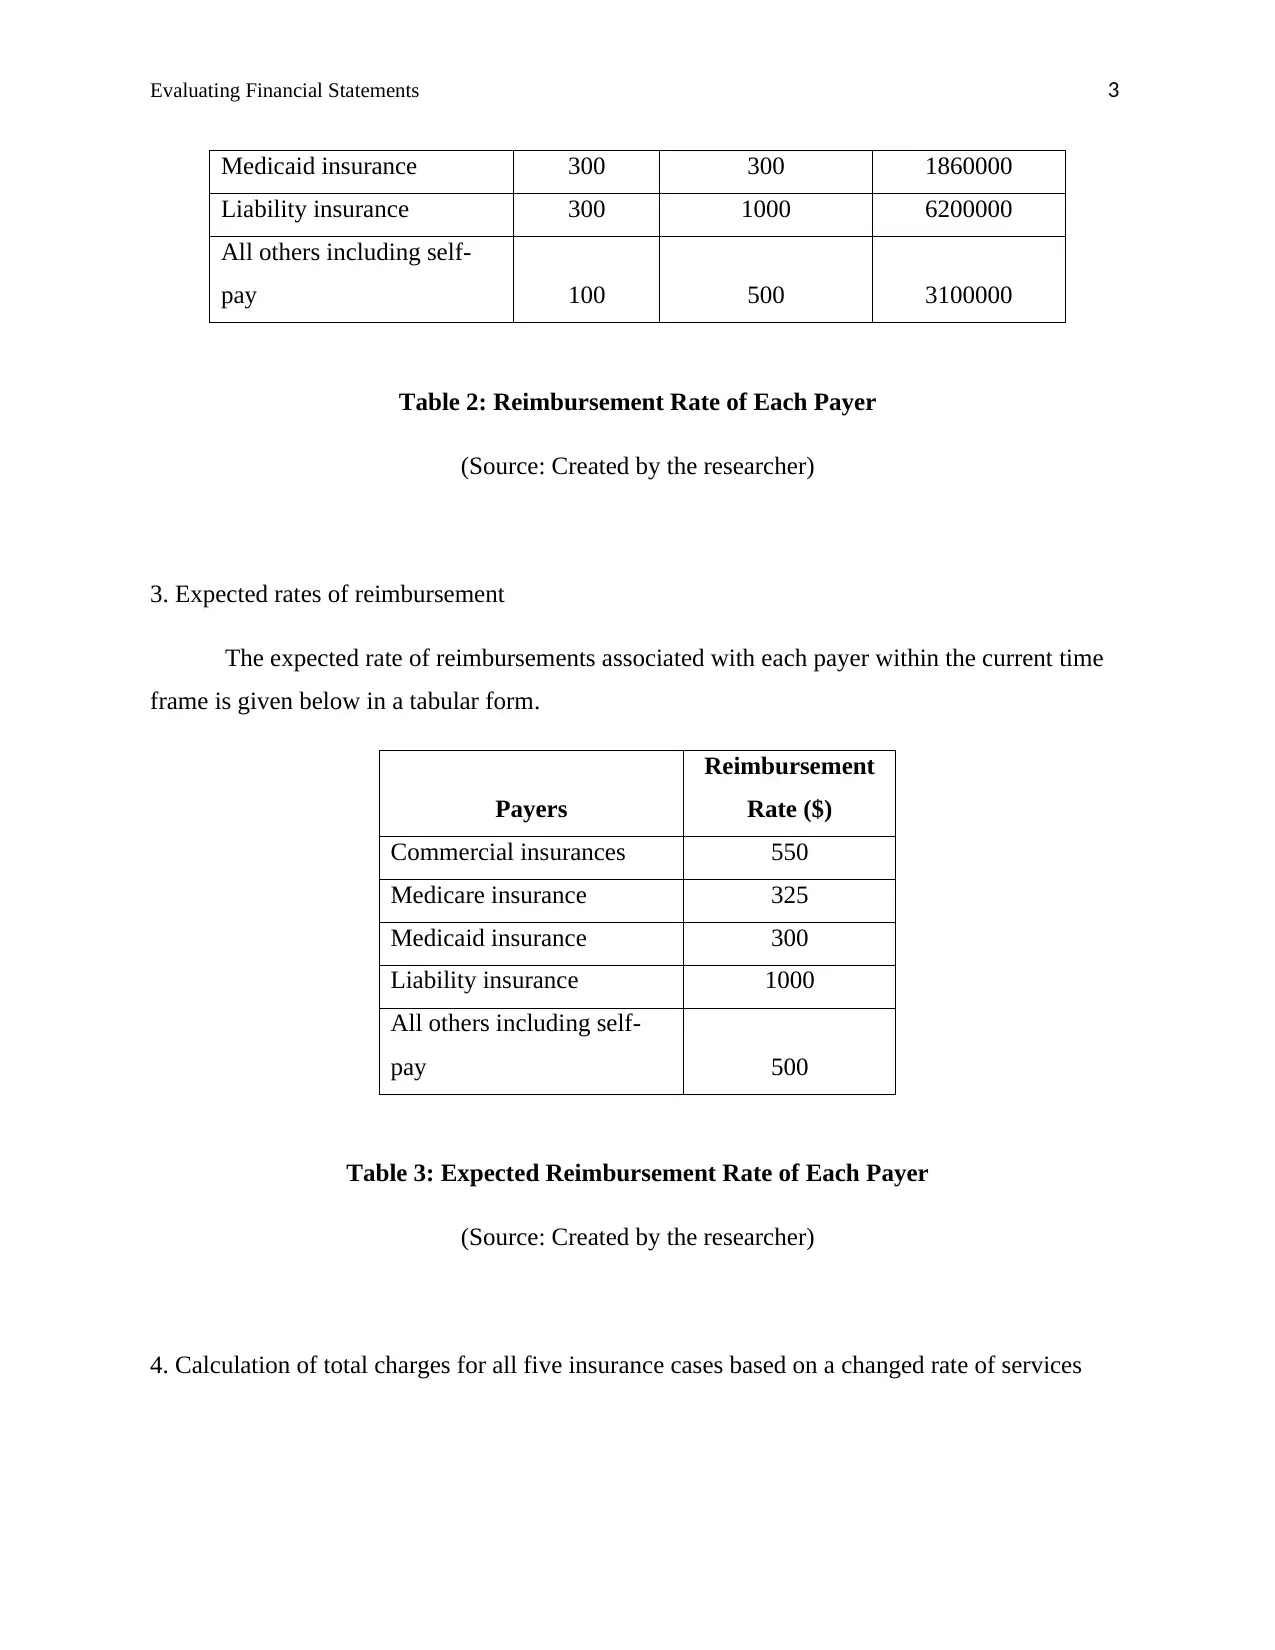
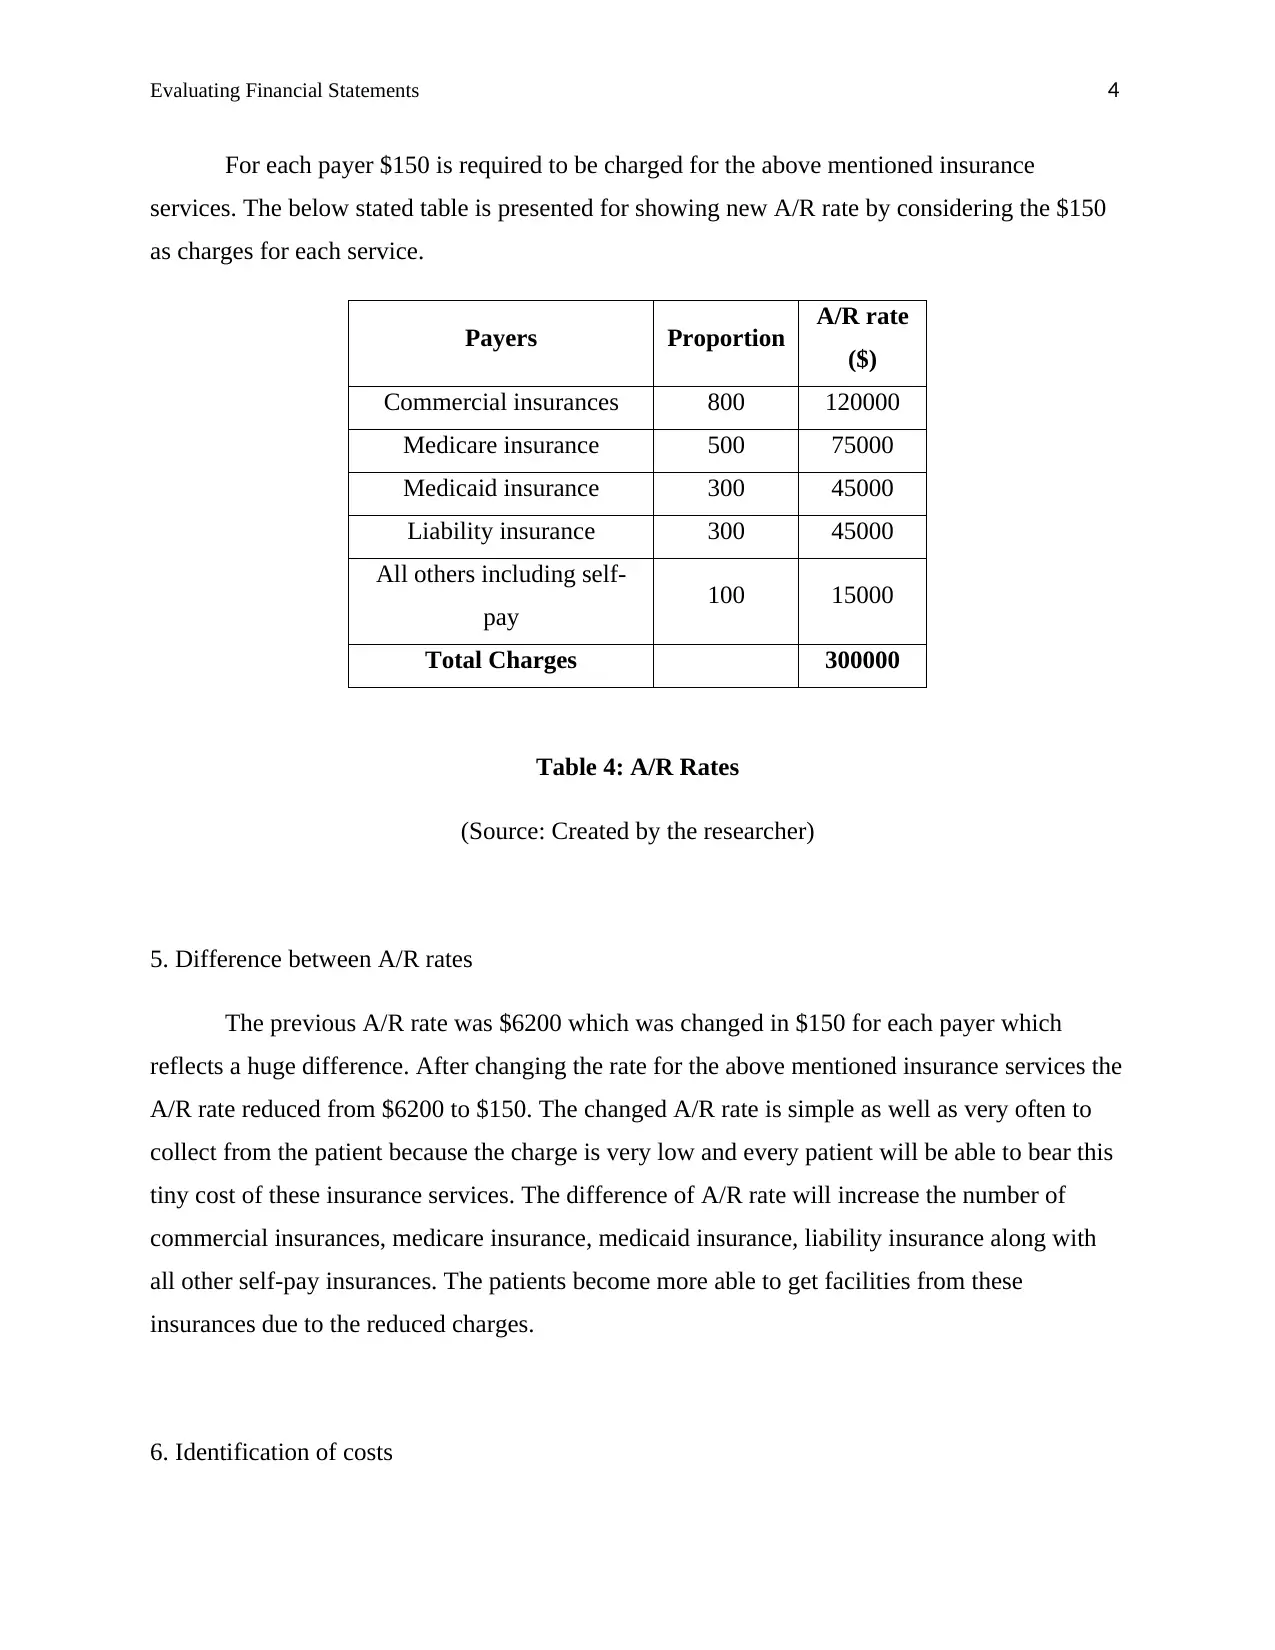
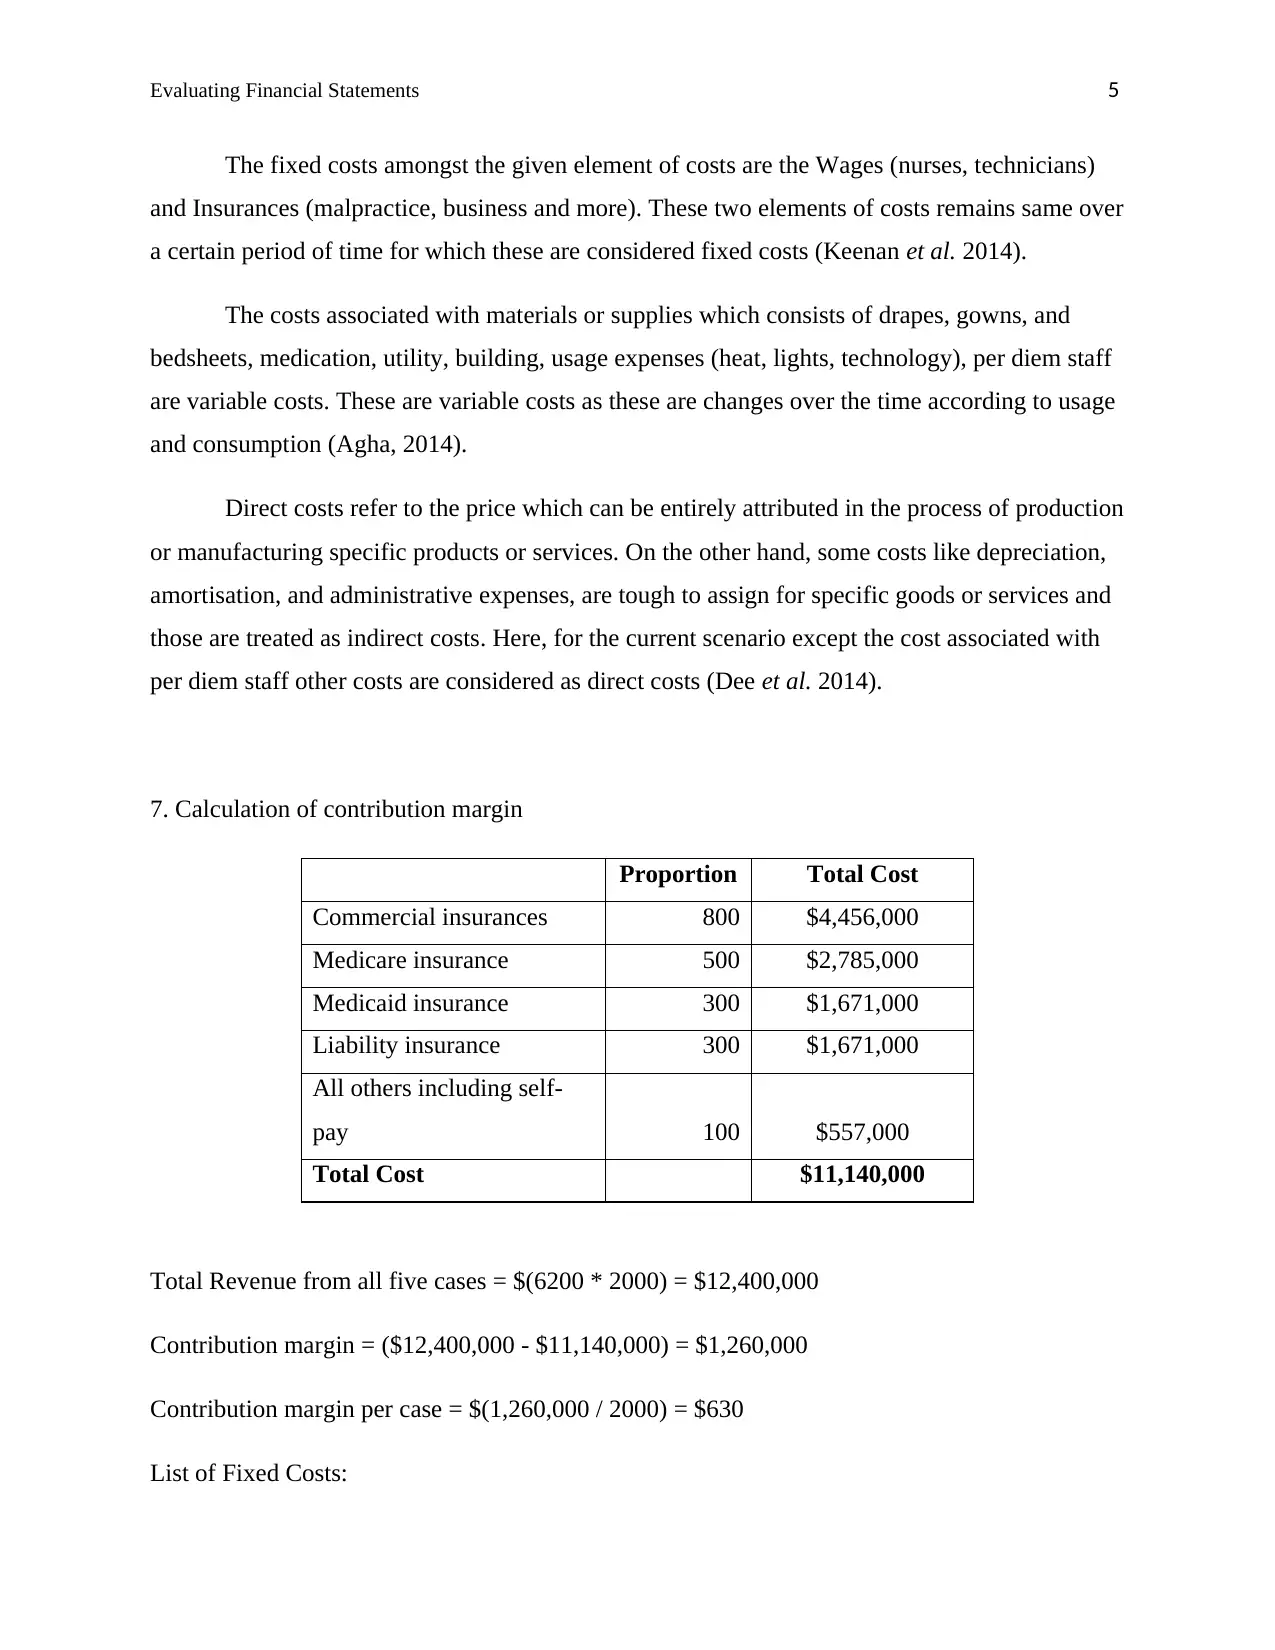
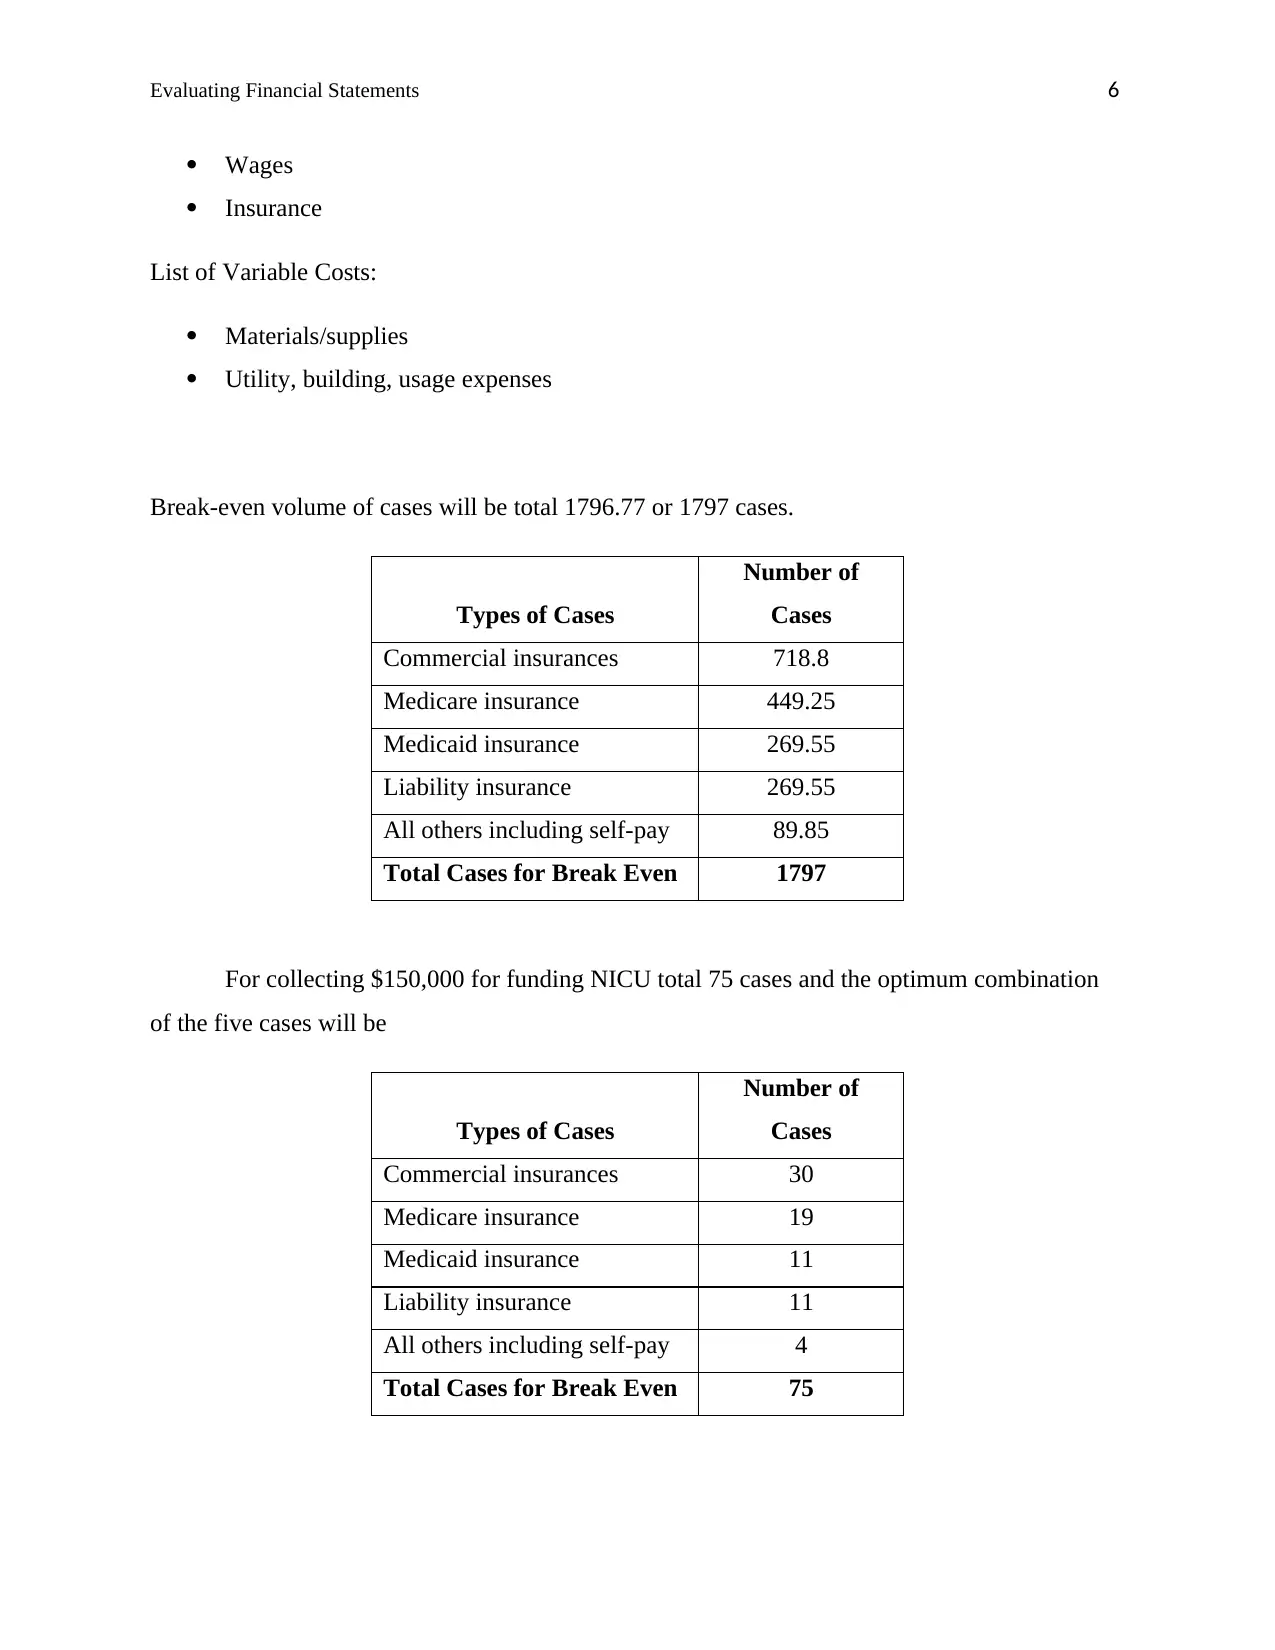
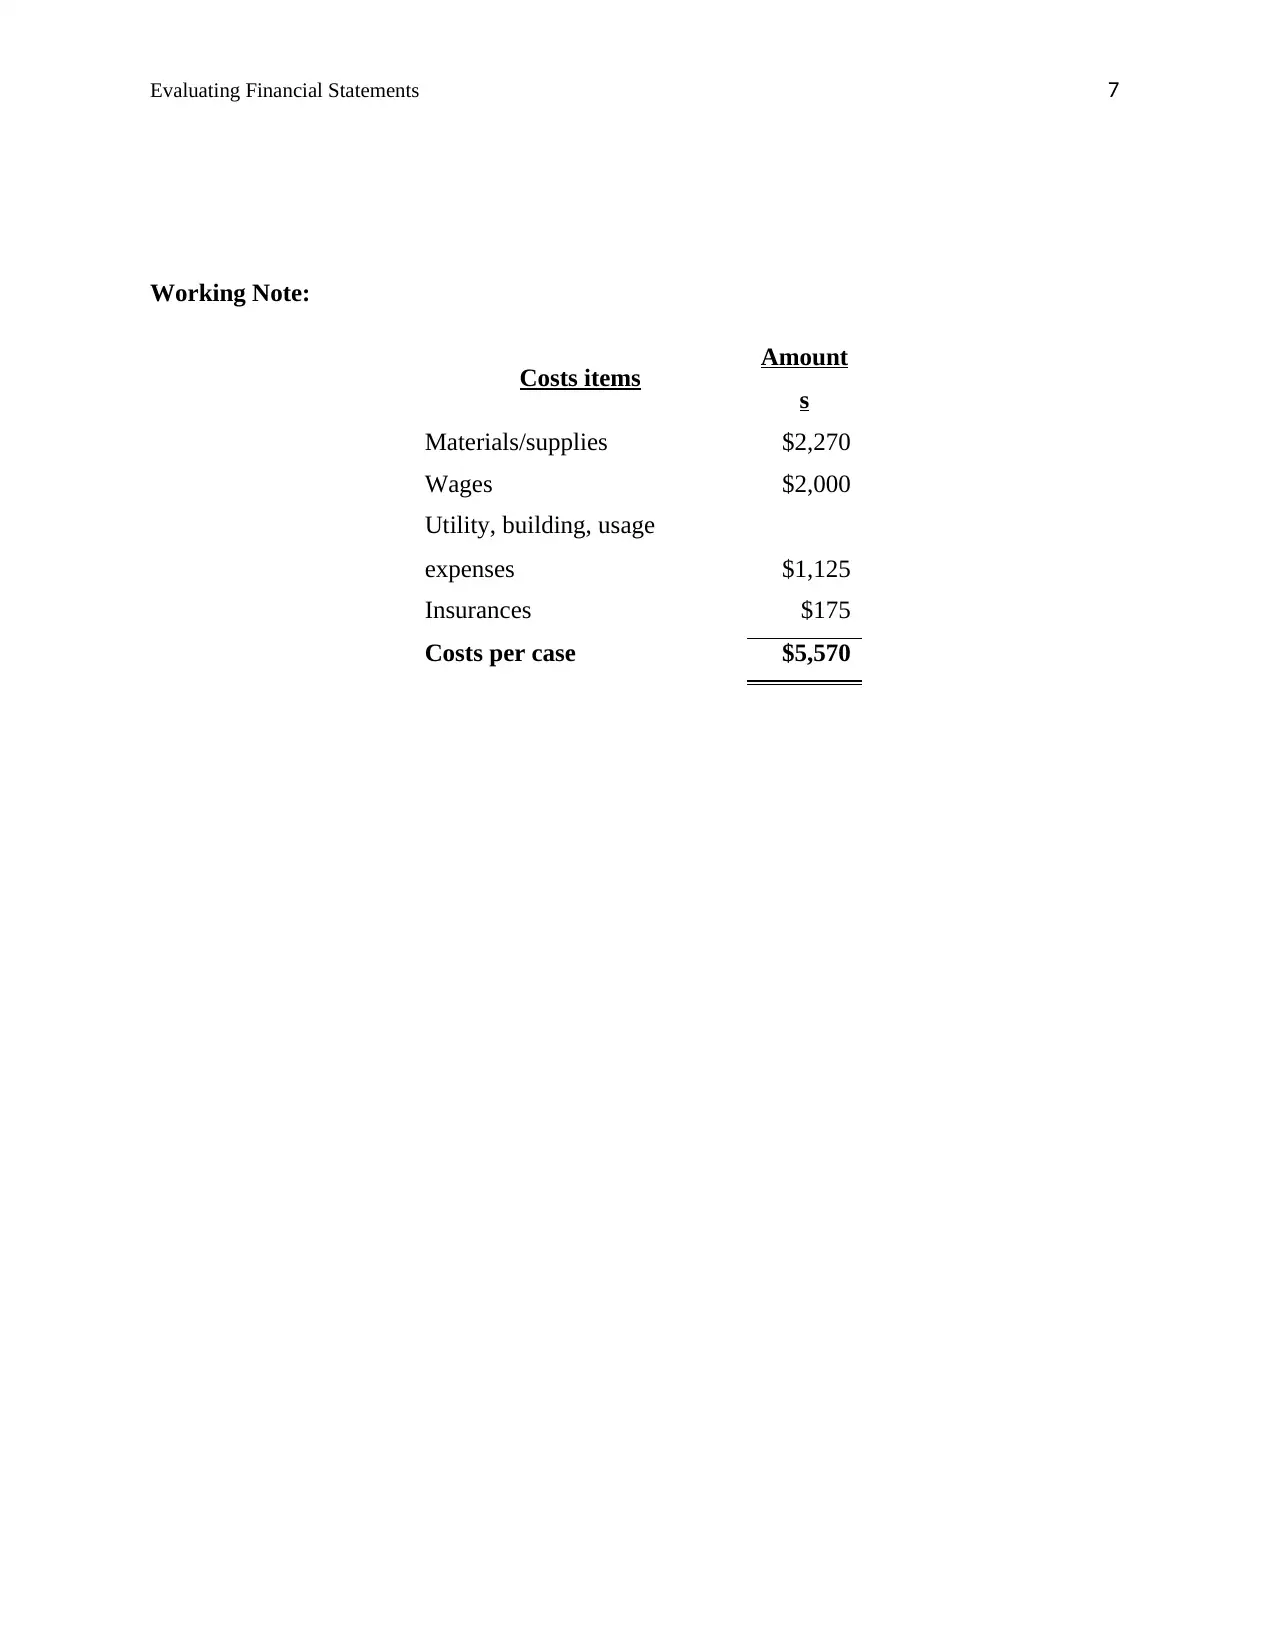
This report presents a comprehensive analysis of financial statements, focusing on the evaluation of different payers and their associated reimbursement rates. The analysis includes the computation of payer proportions, individual reimbursement rates, and the expected rates. The report calculates total charges based on a changed rate of services, highlighting the difference in A/R rates and their implications. It identifies fixed and variable costs, calculates the contribution margin, and determines the break-even volume of cases. Furthermore, the report includes the calculation for funding a NICU. The report offers insights into the financial aspects of healthcare, including payer mix, cost structures, and profitability analysis.
Document Page
Running Head: Evaluating Financial Statements
EVALUATING FINANCIAL STATEMENTS
tabler-icon-diamond-filled.svg

Paraphrase This Document

Need a fresh take? Get an instant paraphrase of this document with our AI Paraphraser
Document Page
Evaluating Financial Statements 2
1. Computation of the proportion of each payer
Amongst the 2000 cases 40% consists of commercial insurances, 25% comprise of
Medicare insurance, 15% comprise of Medicaid insurance, 15% belongs to liability insurance
and the rest 5% comprise of all others including self-pay. The proportion of each payer
considering the total number of cases is as follows -
Proportio
n
Commercial insurances 800
Medicare insurance 500
Medicaid insurance 300
Liability insurance 300
All others including self-pay 100
Table 1: Proportion of Each Payer
(Source: Created by the researcher)
2. Computation of individual rate of reimbursement for five payers
Using $6200 as baseline, the rate of reimbursements attached with each of the five
different payers is stated below. [Refer to Table no. 2]
Payers
Proportion Reimbursement
Rate ($)
Total
Reimbursement
($)
Commercial insurances 800 550 3410000
Medicare insurance 500 325 2015000
Document Page
Evaluating Financial Statements 3
Medicaid insurance 300 300 1860000
Liability insurance 300 1000 6200000
All others including self-
pay 100 500 3100000
Table 2: Reimbursement Rate of Each Payer
(Source: Created by the researcher)
3. Expected rates of reimbursement
The expected rate of reimbursements associated with each payer within the current time
frame is given below in a tabular form.
Payers
Reimbursement
Rate ($)
Commercial insurances 550
Medicare insurance 325
Medicaid insurance 300
Liability insurance 1000
All others including self-
pay 500
Table 3: Expected Reimbursement Rate of Each Payer
(Source: Created by the researcher)
4. Calculation of total charges for all five insurance cases based on a changed rate of services
Document Page
Evaluating Financial Statements 4
For each payer $150 is required to be charged for the above mentioned insurance
services. The below stated table is presented for showing new A/R rate by considering the $150
as charges for each service.
Payers Proportion A/R rate
($)
Commercial insurances 800 120000
Medicare insurance 500 75000
Medicaid insurance 300 45000
Liability insurance 300 45000
All others including self-
pay 100 15000
Total Charges 300000
Table 4: A/R Rates
(Source: Created by the researcher)
5. Difference between A/R rates
The previous A/R rate was $6200 which was changed in $150 for each payer which
reflects a huge difference. After changing the rate for the above mentioned insurance services the
A/R rate reduced from $6200 to $150. The changed A/R rate is simple as well as very often to
collect from the patient because the charge is very low and every patient will be able to bear this
tiny cost of these insurance services. The difference of A/R rate will increase the number of
commercial insurances, medicare insurance, medicaid insurance, liability insurance along with
all other self-pay insurances. The patients become more able to get facilities from these
insurances due to the reduced charges.
6. Identification of costs
tabler-icon-diamond-filled.svg

Paraphrase This Document

Need a fresh take? Get an instant paraphrase of this document with our AI Paraphraser
Document Page
Evaluating Financial Statements 5
The fixed costs amongst the given element of costs are the Wages (nurses, technicians)
and Insurances (malpractice, business and more). These two elements of costs remains same over
a certain period of time for which these are considered fixed costs (Keenan et al. 2014).
The costs associated with materials or supplies which consists of drapes, gowns, and
bedsheets, medication, utility, building, usage expenses (heat, lights, technology), per diem staff
are variable costs. These are variable costs as these are changes over the time according to usage
and consumption (Agha, 2014).
Direct costs refer to the price which can be entirely attributed in the process of production
or manufacturing specific products or services. On the other hand, some costs like depreciation,
amortisation, and administrative expenses, are tough to assign for specific goods or services and
those are treated as indirect costs. Here, for the current scenario except the cost associated with
per diem staff other costs are considered as direct costs (Dee et al. 2014).
7. Calculation of contribution margin
Proportion Total Cost
Commercial insurances 800 $4,456,000
Medicare insurance 500 $2,785,000
Medicaid insurance 300 $1,671,000
Liability insurance 300 $1,671,000
All others including self-
pay 100 $557,000
Total Cost $11,140,000
Total Revenue from all five cases = $(6200 * 2000) = $12,400,000
Contribution margin = ($12,400,000 - $11,140,000) = $1,260,000
Contribution margin per case = $(1,260,000 / 2000) = $630
List of Fixed Costs:
Document Page
Evaluating Financial Statements 6
Wages
Insurance
List of Variable Costs:
Materials/supplies
Utility, building, usage expenses
Break-even volume of cases will be total 1796.77 or 1797 cases.
Types of Cases
Number of
Cases
Commercial insurances 718.8
Medicare insurance 449.25
Medicaid insurance 269.55
Liability insurance 269.55
All others including self-pay 89.85
Total Cases for Break Even 1797
For collecting $150,000 for funding NICU total 75 cases and the optimum combination
of the five cases will be
Types of Cases
Number of
Cases
Commercial insurances 30
Medicare insurance 19
Medicaid insurance 11
Liability insurance 11
All others including self-pay 4
Total Cases for Break Even 75
Document Page
Evaluating Financial Statements 7
Working Note:
Costs items Amount
s
Materials/supplies $2,270
Wages $2,000
Utility, building, usage
expenses $1,125
Insurances $175
Costs per case $5,570
tabler-icon-diamond-filled.svg

Paraphrase This Document

Need a fresh take? Get an instant paraphrase of this document with our AI Paraphraser
Document Page
Evaluating Financial Statements 8
Reference List:
Agha, L. (2014). The effects of health information technology on the costs and quality of
medical care. Journal of health economics, 34, 19-30.
Dee, A., Kearns, K., O’Neill, C., Sharp, L., Staines, A., O’Dwyer, V., ... & Perry, I. J. (2014).
The direct and indirect costs of both overweight and obesity: a systematic review. BMC
research notes, 7(1), 242.
Keenan, J. E., Speicher, P. J., Thacker, J. K., Walter, M., Kuchibhatla, M., & Mantyh, C. R.
(2014). The preventive surgical site infection bundle in colorectal surgery: an effective
approach to surgical site infection reduction and health care cost savings. JAMA
surgery, 149(10), 1045-1052.
chevron_up_icon
1 out of 8
circle_padding
hide_on_mobile
zoom_out_icon
[object Object]